HAL Id: hal-01359308
https://hal.archives-ouvertes.fr/hal-01359308
Submitted on 2 Sep 2016
HAL is a multi-disciplinary open access
archive for the deposit and dissemination of
sci-entific research documents, whether they are
pub-lished or not. The documents may come from
teaching and research institutions in France or
abroad, or from public or private research centers.
L’archive ouverte pluridisciplinaire HAL, est
destinée au dépôt et à la diffusion de documents
scientifiques de niveau recherche, publiés ou non,
émanant des établissements d’enseignement et de
recherche français ou étrangers, des laboratoires
publics ou privés.
TULIP 4
David Auber, Romain Bourqui, Maylis Delest, Antoine Lambert, Patrick
Mary, Guy Melançon, Bruno Pinaud, Benjamin Renoust, Jason Vallet
To cite this version:
David Auber, Romain Bourqui, Maylis Delest, Antoine Lambert, Patrick Mary, et al.. TULIP 4.
[Research Report] LaBRI - Laboratoire Bordelais de Recherche en Informatique. 2016. �hal-01359308�
TULIP 4
David Auber
1, Romain Bourqui
1, Maylis Delest
1,
Antoine Lambert
2, Patrick Mary
1, Guy Melançon
1,
Bruno Pinaud
1, Benjamin Renoust
3, Jason Vallet
11
CNRS UMR 5800 LaBRI, Univ. Bordeaux, Talence, France [email protected]
2
Thales Services SAS, Paris, France [email protected]
3National Institute of Informatics & CNRS UMI 3527 JFLI, Tokyo, Japan
September 2, 2016
Abstract
Tulip is an information visualization framework dedicated to the anal-ysis and visualization of relational data. Based on more than 15 years of research and development, Tulip is built on a suite of tools and tech-niques, that can be used to address a large variety of domain-specific problems. With Tulip, we aim to provide Python and/or C++ devel-opers a complete library, supporting the design of interactive information visualization applications for relational data, that can be customized to address a wide range of visualization problems. In its current iteration, Tulip enables the development of algorithms, visual encodings, interac-tion techniques, data models, and domain-specific visualizainterac-tions. This development pipeline makes the framework efficient for creating research prototypes as well as developing end-user applications. The recent ad-dition of a complete Python programming layer wraps up Tulip as an ideal tool for fast prototyping and treatment automation, allowing to fo-cus on problem solving, and as a great system for teaching purposes at all education levels.
1
Introduction
Although this report presents a system and discusses its design, its con-tent goes much further. Throughout the following pages, we summarize more than a decade of lessons learned working in graph and information visualization, developing new visualization techniques, and building sys-tems for users. The strategy we have adopted is to develop, maintain, and improve the Tulip framework, aiming for an architecture with optimal data structure management from which target applications can be easily
derived. We use Tulip to reproduce and reuse the work published by others and of course for experimenting and validating our research. The architecture of Tulip was designed to promote extensibility and reusabil-ity. Thanks to visualization, the framework also serves as a powerful tool to demonstrate our expertise and know-how when interacting with scien-tific collaborators or data expert users. Overall, Tulip facilitate scienscien-tific collaboration and technology adoption. As we shall argue, the evolution path of our framework brings it into full coherence with Munzner’s nested model [38] and serves all aspects of Information Visualization and Visual Analytics for the creation and analysis of visualization systems. Tulip has software support for validation at any level of this model.
Tulip offers the possibility to efficiently define and navigate into graph hierarchies or cluster trees (nested subgraphs). These techniques have been a central visual paradigm within our research group, as it often pro-vides answers to data analysts. The reason is quite simple: large graphs must be clustered to reduce visual complexity, turning the data explo-ration process into a hierarchy visualization which is built by a clustering algorithm. Hence, Tulip’s low-level data structure was designed since its first version to support the creation of nested and/or overlapping sub-graphs and to integrate at the core of the system a property heritage mechanism that provides both coherence and optimal space usage. Tulip started after David Auber decided to enter the huge graph visualization arena [8,9,11]. The framework was originally designed to deal with graphs (relational data), focusing on graph topology as the main ingredient for visual encodings and mainly exploiting node-link diagrams (vertices and straight lines) as a central visual metaphor.
Scalability was also a requirement to be able to work on huge data sets; the core architecture and low-level data structures of Tulip are op-timized to reach ambitious goals in terms of graph size (nodes and edges) that could be handled and visualized. After these initial efforts, Tulip found a place within our research group and soon became an everyday experimental tool. Because data analysis and combinatorial mathematics are companion fields to graph visualization, Tulip included a rather long list of node and edge metrics that could be mapped to color or size. Obvi-ously, Tulip initially served as an experimental framework from which the design of drawing algorithms and visualization techniques were developed, tested, and validated. Nowadays, Tulip can be seen as an information visualization framework and it is still evolving1.
The growth of our community helped us gain visibility, and we were soon asked to cooperate with data expert users to build visualization ap-plications in many domains such as producing automated drawing for secondary RNA structures [12], visualizing software reverse engineering graphs [24], social networks [10], air passenger traffic [45], or graph rewrit-ing [42]. Other examples are given throughout this paper. The graph hierarchy paradigm residing deep within Tulip was later fully exploited by the work of [4–7] and more recently by [42]. Over the years, Tulip have evolved from an algorithmic-centered graph drawing system to a vi-sual data analytics dashboard combining different vivi-sualization techniques
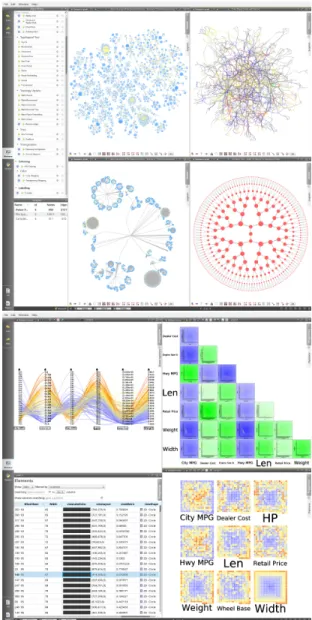
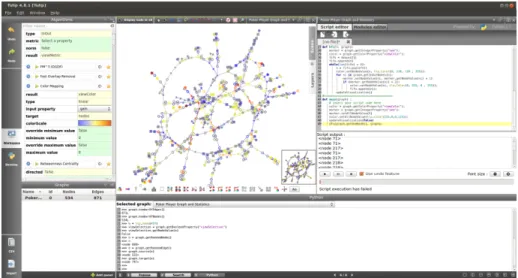
(see Fig. 1).
Figure 1: Tulip 4 is a framework that enables visualization researchers and application designers to operate on an algorithm, technique/interaction, and visual encoding level. The figure on the top shows an overview of Tulip with some graph drawing made with different algorithms and metrics. The figure on the bottom shows several views of the same data set with custom interactions. The data comes from [52] (cars data set).
reusabil-ity of results. As such, from a software engineering perspective, it heavily relies on object composition rather than inheritance. Even if object com-position is often more complex for the programmer, it considerably reduces code duplication and dependencies between modules. We are constantly improving and refactoring the framework to minimize code duplication and re-implementation to ease the addition of future research results, and to preserve architecture scalability.
The rest of this paper is structured as follows: Section 2 describes pre-vious and related software systems that inspired the design of many parts of Tulip. Section 3 gives an overview of Tulip. Section 4 describes the architecture of the Tulip libraries and software. In this section, we de-scribe elements that support each level of validation in Munzner’s nested model: algorithm plugins (section 4.1.2) provide support for validating al-gorithm design, views and interactors (Sect. 4.3.1 and Sect. 4.3.2) provide support for validating encoding/interaction technique design, and perspec-tives (Sect. 4.4) provide support for validating data/operation abstraction design and domain problem characterization. Section 5 presents recent applications of the Tulip library made in our research group. Finally, Section 7 presents some conclusions and future work.
2
Historical Background
Developing a framework over an extended period of time often means being compared to or challenged by competitor systems and libraries. This section presents a subset of the libraries that are closest in spirit to our work. We briefly discuss the philosophy or underlying principles of each, contrasting them to Tulip.
2.1
Libraries
2.1.1 LEDA/AGD/OGDF [23, 35, 39]
The LEDA/AGD/OGDF graph drawing libraries were built to provide a collection of efficient graph drawing algorithms. These libraries include some of the most powerful, sophisticated, and complex algorithms to pro-duce graph drawings. However, the aim of these libraries is to draw graphs –that is, to decide the positions of nodes in the plane. These libraries do not tend to focus on a fully integrated information visualization library but rather concentrate on graph topology. Therefore, extra information linked to nodes and edges of the graph is difficult to integrate into the vi-sualization process. That said, LEDA/AGD have inspired our work (see Section 4.1.2, “Algorithms”). Note that OGDF graph drawing algorithms are integrated into Tulip (see Sect. 4.1.2 for more details).
2.1.2 GraphViz [26]
This library is similar to OGDF and supports extrinsic data (i.e., labels, size, and orientation of graph elements). GraphViz has been successful from both end user and InfoVis community member perspective. It offers one of the best solutions for drawing hierarchical (directed and acyclic)
graphs. However, the library does not focus on fully integrating its algo-rithms into a completely functional information visualization system.
2.1.3 VTK/Titan [46, 53]
VTK is a library for producing applications supporting scientific visual-ization techniques. Recent developments of this library extend its scope to information visualization even though VTK was not originally designed to support the visualization of abstract (non-geometric) data. The original strength of the library was its efficient rendering of meshes in three di-mensions, and optimizations can be made under the assumption that most information visualization techniques are focused on rendering information in two dimensions. However, information visualization often focuses on user interaction and visual data manipulation, requiring efficient methods for tracking changes to the data, needs to be supported, and this library does not appear to directly support this functionality.
2.2
Toolkits
Toolkits provide users an environment for the development of information visualization applications. They offer an off-the-shelf data import/storage solution and often include a variety of widely used graph layouts and node/edge metrics. The two toolkits we comment on here primarily sup-port the design, development, and validation of new interactive visual-ization techniques, rather than offering sophisticated support for graph drawing algorithms.
2.2.1 Prefuse/Flare [31]
This framework provides a comprehensive set of interactive information visualization techniques. Its clever design and management of interaction make it widely used for information visualization applications. On the other hand, the toolkit supports only a few graph drawing algorithms and node/edge metrics.
2.2.2 InfoVis Toolkit [28]
The InfoVis Toolkit shares similarities with Prefuse and offers a compre-hensive set of information visualization techniques, for instance, node-link diagrams, tree maps, or matrix views. As such, it has many of the advan-tages and disadvanadvan-tages of Prefuse. The toolkit supports few but relevant graph drawing algorithms and metrics. The concept of multi-views im-plemented in this framework has inspired a similar design in Tulip.
2.3
Software
2.3.1 ASK-GraphView/CGV [1, 50]
This software system shares an important feature with Tulip as it relies on the computation of subgraph hierarchies and implements multi-scale graph drawing techniques to explore large data sets that do not necessarily
fit into the main memory. ASK-Graph view is part of the few scalable graph visualization frameworks. However, it essentially offers a single visualization technique relying on multi-scale graph drawing as a central visual paradigm.
2.3.2 GUESS [2]
GUESS uses a scripting language to perform basic tasks (searching and filtering, etc.). This scripting language is very powerful and useful for users with programming experience in Python. However, direct manipulation of the data through interactive techniques may be preferable for some users, which is the focus of Tulip. However, we have integrated a powerful Python bindings in Tulip to allow easy and quick Python scripting. See Sect. 4.6 for more details.
2.3.3 Pajek [17]
The Pajek software focuses on the analysis of large graphs (social net-works), providing several powerful tools such as k-core computation, Ec-centricity, and others. It is widely used for social network analysis (SNA). In its first versions, Tulip shared many similar ideas with this software. However, few visualization techniques outside node-link diagrams are sup-ported by Pajek.
2.3.4 Gephi [16]
After self-announcing to be the ‘Photoshop’ for graph visualization, Gephi rapidly became one of the most popular graph visualization software. It integrates multiple metric and layout algorithms, features dynamic graphs, interactive data manipulation and visualization in the same spirit of Tulip. The software is open-source, developed in Java, and focuses on user-friendly interfaces, so it rapidly gain a wide audience and an active community of users. The target audience are non-programming users, whose graphs are often of limited size. Gephi’s limitation is tied to the memory allocated in the Java Virtual Machine, and can hardly reach be-yond 100,000 nodes and 1,000,000 edges.
2.3.5 Cytoscape [47]
Cytoscape was originally a dedicated software for visualization of networks in biology. Now, it is a complete framework for complex network analysis. In many ways, it shares many ideas with the Tulip framework. Once again, the use of Java to implement the software may be problematic when working on huge graph as more memory and more CPU time is needed, especially when the garbage collector is active.
3
Key Points
The Tulip framework consists of five packages. The first package, the Tulip core library, provides an efficient and fine-tuned data structure
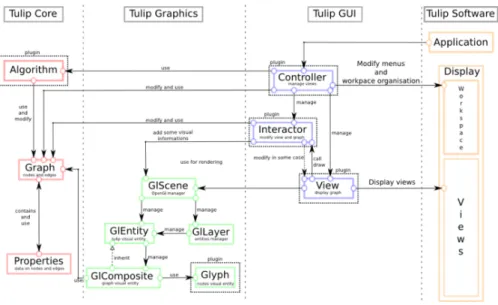
designed for abstract data visualization. The second package is a com-plete OpenGL rendering engine (Tulip OGL) tailored for information visualization techniques. The third package is a library of GUI compo-nents created using the Qt library (Tulip GUI). The fourth package is a complete bidding of the C++ API to Python. It makes the usage of Tulip inside Python code straightforward. Finally, Tulip software is an appli-cation where users can embed their algorithm, visualization technique, or complete information visualization pipeline. Figure 2 summarized the connections between these different libraries.
Figure 2: Tulip architecture overview. The Tulip framework consists of four packages. Tulip core provides an efficient data structures for relational data. Tulip graphics is a complete OpenGL rendering engine. Tulip GUI is a collection of widgets built on top of Qt library for the purpose of informa-tion visualizainforma-tion. Finally, Tulip software is an applicainforma-tion for embedding algorithms, visualization techniques/interaction, and complete information vi-sualization systems. All these packages can be dynamically extended through the plugin architecture of Tulip.
4
Tulip Main Features
4.1
Tulip Core
The Tulip core library was created for the purpose of manipulating data sets consisting of entities and relations between them. It enables to ef-ficiently store into memory these entities/relations as well as attributes attached to them. Furthermore, it provides the necessary functions to
access these data as well as standard useful algorithms. For instance, it includes functions to test whether or not a graph is planar, or to compute a uniform quantification of a set of values. The Tulip core library also integrates a generic plugin mechanism [14]. It is used many times in our library to enable easy extensions of our framework. The principle of that plugin mechanism is to enable each plugin to specify their input/output requirements as well as their dependency with other plugins. It is pos-sible to call these plugins directly in a program or to use them directly through an automatically generated user interface. Furthermore, since plugins are dynamically loaded, a dependency mechanism enables us to check the coherence of a set of plugins.
In the following, we describe the Tulip meta-model that is, from our point of view, the part that differentiates the most Tulip from all other information visualization software. For more details on the basic data structure or functions (matrix, convex hulls, etc.) provided by Tulip, the interested reader should refer to the API manual2
4.1.1 Meta-Model
Based on the previous Tulip version [9], the Tulip meta-model focuses on minimizing the amount of memory used while providing efficient op-erations on the data set. The original idea behind the data structure was to manage high-level operations used in the visual analysis process in the data structure. Integration of all these operations provides a global optimization during the interactive exploration of abstract data.
As shown in Fig. 3, the Tulip meta-model user only has access to the class called Graph. In terms of design pattern terminology, this class is a facade, meaning it provides simplified and centralized access to a set of complexly interacting classes. Programmers do not need to understand the behavior of the manipulated objects through the facade. Furthermore, it eases the implementation of data storage optimizations into the library as external modules are not directly accessed. One should note that this facade can be used even when working on non-relational data. This property is due to the fact that a graph data structure with an unbounded set of attributes is extremely versatile and allows to store a wide variety of data (relational, multidimensional, geospatial, etc.). In the following section, we present some of the operations provided by this facade.
Subgraph hierarchy. One of the first requirements was to provide efficient management of subgraphs. As a subgraph generalizes the notion of a subset to relational data, it is often used in graph visualization sys-tems that follow the Shneiderman mantra [48]: “overview first, zoom and filter, then details-on-demand”. In Fig. 3, we see the facade currently uses two classes inheriting from AbstractGraph: GraphImpl is responsi-ble of storing the entities and relations, while GraphView is responsiresponsi-ble of storing subgraphs by using a filtering mechanism on a Graph. This
2
The documentation is available inside the software or on the Tulip website: http:// tulip.labri.fr/Documentation/current/doxygen/html/index.html.
ObservableGraph Graph GraphDecorator AbstractGraph PlanarGraph ObservableProperty Property GraphView GraphImpl User
Figure 3: Overview of the meta-model class diagram. Instead of providing a complex set of classes, Tulip philosophy is to provide centralized access to the data structure through the Graph interface. The resulting implementation provides an optimized and extensible data structure.
approach is efficient in terms of memory, because, in most cases, storage needed for entities and relations in a filter can be done in a single bit (worst cases appear when fragmentation of these indexes are maximal). Further-more, when a subgraph structure is implemented with filtering, entities and relations used are exactly the same. Thus, no overhead is required for correspondence between entities and relations in the different subgraphs. To guarantee the coherence in the subgraph hierarchy, every modifying operation on a subgraph is applied recursively to its sub-subgraphs or its supergraphs when necessary. Thanks to this implementation, Tulip can manage a very large number of subgraphs. Using the current implemen-tation, a graph having 1,000,000 nodes and 5,000,000 edges with 200,000 subgraphs requires about 825 MB on a 64-bit architecture. If one is only interested in graph partitions, where elements must be strictly contained in a subgraph and all its ancestors to the root, this data structure can still be optimized. However, Tulip does not support this optimization as it would limit visualization techniques for overlapping subgraphs and clusters. HGV [43] implements this efficient data structure, and we refer any interested reader to the associated paper.
Property sharing. Our second requirement was to support the stor-age of an unrestricted number of properties, or attributes, on graph ele-ments. We have chosen to create a single object for each property rather than store them inside the entities and relations. Even if this data struc-ture appears slightly less intuitive for a programmer, this choice is nec-essary to enable global optimization and increase cache hits during itera-tion of entities (especially during rendering). This idea is also used in the IVTK [28] framework. In order to enable sharing of properties between subgraphs, we provide an inheritance mechanism for properties. As shown in Figure 4, each subgraph inherits its supergraph properties and can also
redefine or create its own properties, comparable to the inheritance mech-anism in object-oriented languages. In all the visualization techniques and systems we have developed, this property sharing mechanism has been a key feature for synchronization to provide efficient “overview+detail” im-plementations.
Figure 4: Graph Hierarchy (figure created with Tulip): Tulip provides man-agement of a hierarchy of subgraphs through an efficient filtering mechanism of graphs. The inheritance mechanism of graph properties in the hierarchy maximizes the number of properties shared between subgraphs. For instance, Subgraph 1 inherits the layout of the root graph. The inheritance mechanism is also able to redefine properties in subgraphs like one would do in an object-oriented programming language. Subgraph 2, for example, has redefined its layout property but inherits the color, size and shape properties of its parent, whereas Subgraph 1.2 inherits its parent layout but uses different color and shape properties.
Aggregation (meta-nodes/edges). The third requirement enables hierarchical aggregation [27] of entities/relations, one of the forte of the Tulip meta-model which has been especially extended and optimized for this purpose. First introduced in [13] and perfected after working on sev-eral multi-scale problems [6, 7, 20, 42], the meta-model presented above supports efficient aggregations and disaggregations. of subgraphs. Also, we have introduced aggregation functions in order to be able to modify the way aggregated values are computed.
Observable data structure. Interactive visualization often requires the modification of graph topology (graph structure), decomposition (sub-graph or aggregation), and attributes (properties). To prevent static links between the Tulip data structure and external algorithms or systems, we provide an observer mechanism that listens for all modifications and ap-plies them to the data structure.
State management. One of the most powerful feature of the Tulip meta-model is it ability to save the current state of the data structure very efficiently. Like the OpenGL matrix stack, we provide two functions: push and pop. These two functions can save or restore the current state of the data structure through a stack. A naive implementation of this feature (copy the whole data-structure) would be suboptimal when dealing with a large number of graph elements and their properties. In Tulip, this mechanism has been designed with the proxy design pattern. It allows objects to behave like other objects, hiding direct manipulation of the data structure from the user and allowing data sharing to be globally optimized. Using the state stack, it is possible to write an efficient implementation of the command design pattern, and thus to provide effective undo/redo operations on large data sets. For instance, a graph with 40,000 nodes and 80,000 edges under the following modifications, “change all the size,” “change the layout,” “change all the colors,” requires less than 115 MB (including Tulip GUI, 3D rendering engine, and plugin memory usage), enabling immediate undo/redo on a recent computer.
Alternative graph model. Tulip also proposes an alternative, yet simpler, implementation of a graph structure called VectorGraph offer-ing very efficient access and modification times. On the other hand, and in opposition to the meta-model, VectorGraph does not support subgraphs, observers and meta-graphs. This alternative structure is very effective when addressing problems where no nested hierarchy, subgraphs or meta-elements are needed.
4.1.2 Plugins
Several kinds of algorithms have been published and are used in infor-mation visualization. In Tulip, these algorithms are defined as plugins managed by the Tulip plugin system. A Tulip plugin has an unlimited number of input parameter types, and thus, by using the dynamic param-eter declaration mechanism, a programmer can implement a large variety of algorithms. Nonetheless, in order to categorize algorithm major classes and ease automatic connections with the user interface, we provide models and interfaces for plugins to only modify a single Tulip property and we guarantee that the rest of the data-structure is left untouched.
Standard graph drawing algorithms, for instance, only need to modify node positions or the number and position of edge bends, both stored in a Tulip layout property. Based on this idea, we distinguish the layout plugins as specific plugins to draw all kind of graphs (hierarchical, tree, planar, . . . ), apply force-directed layouts, render spectral methods, map entities on space-filling curves or create edge bundling. The layout plugin
collection of Tulip is also enlarged by the different layout algorithms provided in the open graph drawing framework (OGDF) library.
The measure plugins follow the same concept and are used to com-pute real values on entities and relations. The standard Tulip distribu-tions provides many plugins like k-cores computation, eccentricity, be-tweenness centrality, pagerank, (bi/tri)connected component, strength metric, Louvain clustering measure.
Tulip proposes additional variations based on the available types of properties such as color plugins, size plugins or selection plugins. We also provide a more general plugin type which can modify any element of the data structure and any property. This type of plugin are simply called “Algorithms”. Furthermore, while a plugin is running, a call-back mechanism allows interactive visualization of the plugin’s results.
4.1.3 Data Import and Export
Import/Export of a variety of data formats are mandatory for building generic information visualization libraries. In Tulip import/export is part of the plugin architecture even for the tulip file format (see below). There-fore, programmers can extend the import and export capabilities of Tulip by designing their own plugins for custom file formats. Consequently, im-port algorithms can be implemented to either create graphs (following published models for instance), import web graphs, social networks, a file system, or even graphs saved using another visualization software. Obvi-ously, export algorithms can also be implemented to respond to every need.
Nevertheless, the standard Tulip distribution is able to import graphs and their attributes from many format such as CSV (Comma Separated Value), GML (Graph Modeling Language), DOT (Graphviz), GEXG (Gephi Format) and NET/PAJ (Pajek). Tulip is also able to export an image of a graph in png (or jpeg) format (or many more when using the GUI via the Qt library), SVG (Scalable Vector Graphics) or GML.
To address the complex structure generated by nested subgraphs and meta-elements, Tulip also has its own text format (tlp) which was devel-oped to support the Tulip meta-model. The tlp format allows an efficient storage of the graph on disk. We also have a binary version (tlpb) which was designed to handle huge graphs. It allows very fast reading/writing of the graph on disk. Both tlp and tlpb files can be embedded in an extended tlpx file. It is a zipped archive containing the graphs and the required in-formation on the opened visualizations and their configurations to restore them after opening the file in the Tulip GUI.
4.2
Tulip Graphics
Efficient rendering of large amounts of geometric information is a bottle-neck in most information visualization systems. In the Tulip Graphics library, we provide an OpenGL-based, multilayer rendering engine that in-cludes the necessary functions for implementing information visualization techniques.
In our multilayer rendering engine, three-dimensional information can be displayed on different layers. For instance, using layers and trans-parency enables the Tulip graphics library to render textured quads be-hind the scene, display only nodes or edges. Through the OpenGL stencil buffer, we are able to force the visibility of elements on layers. This func-tionality implements a guaranteed visibility [37] for rendered elements. For example, in our visualization techniques, we use this capability to guarantee that selected elements are always visible.
To ease the implementations of new techniques, we provide functions to manipulate the camera, select elements, render aggregated elements, ren-der basic geometric entities, and facilitate the use of vertex/pixel/geometric shaders. Special attention has been paid to make these operations appli-cable on huge data sets. For instance, computing and rendering curves, such as Bézier, splines, and B-splines, are done on the GPU, allowing Tulip to render more than 10,000 edges with more than 100 bends in real time without storing any precomputed geometry. In this example, we save the storage and transfer of 2,000,000 triangles required to render this set of curves.
To be able to extend existing visual metaphors, we provide once again a plugin mechanism to add new visual objects. These can be used to create Glyphs. For instance, a programmer can create a plugin for rendering pie charts according to specific attribute values. After installing the plugin, all graph visualization (node-link diagram, scatter-plots, etc.) can render graph entities using the new visual object.
Using an external rendering engine could have been possible. Two main reasons required that we design our own rendering engine. First, ex-ternal rendering engines can generate memory overhead unable to handle graph of over 500,000 elements in less than 256 MB of memory. Secondly, when the Tulip project began in 2000, 3D rendering engines were not easily available and powerful enough for information visualization. How-ever, designing an OpenGL rendering engine for the purpose of abstract data visualization allows us to optimize and fine tune the rendering engine according to the visualization implemented visualization techniques.
The philosophy behind the Tulip Graphics Since the early days of Tulip, the aim was to have an efficient and direct rendering of the data stored without duplication. However, as the amount of available memory has increased significantly. We have integrated optimizations that are more memory intensive. For example, we use octrees to optimize selecting elements or computing level of detail, and we use texture-based rendering to accelerate the rendering of aggregated elements during zoom and pan. In software engineering terminology, a composite design pattern is used to model the hierarchy of visual objects to rendered. A naive implementa-tion requires the instantiaimplementa-tion of a large number of objects and therefore does not scale to large data sets because of memory constraints. To solve this problem, the Tulip Graphics library accesses this composite using a visitor pattern. First, the visitor pattern adds new functionality to the composite without any modification to its data. For instance, the visitor can compute bounding boxes needed for level of details used during ren-dering. Secondly, the visitor pattern can simulate a hierarchy of objects without building it. For example, when using the GraphComposite class
from the Tulip API, the visitor traverses a dynamically created hierar-chy of objects instead of creating this hierarhierar-chy beforehand. Objects are generated and reused on the fly in a way that is similar to the flyweight design pattern during rendering. This pattern avoids data duplication in the data model and graphics library, allowing the system to scale to larger data sets and synchronize rendering with the model.
4.3
Tulip GUI
According to Munzner [38], deciding on the proper visual encoding to use should be determined after problems from real-world users have been characterized. Of course, each problem does not need its own unique and completely new visualization techniques each time. The problem often turns into selecting the proper techniques to assemble and implement together with the proper operations. Some techniques now have been used and studied long enough so that their usability perimeter has more or less been established. Because Tulip aims to be used for implementing end-user visualization systems, it has to implement a wide palette of existing techniques. Thus, a choice has been made to implement pairs of visual encoding and operations based on their usefulness and scope as assessed by the InfoVis community.
Tulip allows users to easily go back and forth between a node-link diagram, where metrics were mapped as color or size, and histograms, that helped understand how a metric was able to capture a key property in the data. These data analysis features include a set of well-established data visualization techniques (see Section 4.3.1). Tulip has evolved from essentially offering a unique visual encoding (node-link diagram) to a va-riety of data analysis techniques that can moreover be astutely combined and synchronized. All these features were carefully and coherently in-tegrated into the framework using Agile development methodology (see Section 5.1).
The overall architecture is based on the Model-View-Controller (MVC) architectural pattern. The model-view-controller approach is a well- known approach for designing interactive systems. The pattern splits the software architecture in three independent components. The model component has the responsibility to store the information, the view com-ponent gives a representation for the information, and the controller manages communication between one or more views and the model. This architecture dissociates the data structure (Model) from the representa-tion (View) and the system behavior (Controller). In the following, we describe three main components of the Tulip GUI library.
4.3.1 Views
Views can be defined as visual representations of data. Node link-diagrams, parallel coordinates, and scatter-plots are just a few examples of views that can be used to gain insight into a data set. Tulip uses the above-described meta-model to create multiple views of the same data set. The idea is to use the same data independently of the current view. For ex-ample, nodes in the node-link diagram of a graph may have several
at-tributes, and these attributes could be placed in a 2D scatter-plot. Having all views sharing the same data model helps maintain system coherence and enables users to work with several views simultaneously. Structur-ing data manipulation in this way allows the information in one view to be easily analyzed in all other views, hopefully providing more insight. Figure 5 shows three different views, and in each view, one can see that each element visual attributes (such as shapes, colors, and relative sizes) are preserved. This makes a fundamental, although simple, user interac-tion quite powerful. As an example, when selecting nodes in a histogram, to focus on high-value nodes, the user instantly sees where these nodes spread in the node-link diagram. Views are plugins, so adding new data views is possible.
Figure 5: A centralized meta-model maintains coherence between views of a same graph. (Left) Histogram view. (Middle) Node-link diagram. (Right) Scatter-plot views. All three views share the same visual attributes (color, shape, size. . . ) enabling the user to switch between views easily and keep track of selected elements from view to view.
For optimization purposes and to implement specific types of views, the programmer occasionally needs a custom data structure. For these cases, views can observe any change done in the meta-model (see Sec-tion “Meta-Model” for details) for synchronizing all views to it. As an example, consider the scatter-plot matrix view (see Fig. 6) of Tulip. This view generates a buffer of textures for efficient navigation through the ma-trix. The data model, in this case, is used to generate the scatter-plot rep-resentation for each pair of dimensions, and the view stores these results as images. During interactive navigation, the rendering engine displays only the textured quads. If the data set is modified by another view or interactor, the set of textures needs to be rendered again. The observer mechanism of Tulip notifies the appropriate views and modifies the data only when necessary.
Views are implemented as Tulip plugins. Currently, all views are implemented using the Tulip rendering engine, but programmers are not limited to this engine. Integrating rendering engines such as VTK or even multiple engines simultaneously inside a single view can be supported. However, the programmer would need to synchronize all views manually. An example of a foreign rendering engine used in conjunction with the
Figure 6: (Left) The node-link diagram view renders glyphs for nodes and curves for edges. The view provides navigation such as zoom and pan, bring and go [36], fish-eye views, and a magnifying glass. Direct editing of the graph elements and data, such as adding or removing nodes and edges or translating, rotating or scaling elements, is also supported. Other operations on this view include graph splatting, meta-node/graph hierarchy exploration, and texture-based animation. (Right) The scatter-plot 2D view renders attribute values to depict possible correlations between properties, and the matrix allows efficient navigation between dimensions. The view provides similar interaction to the node-link diagram and implements an interactor to search for correlation in an interactively defined subsets of elements. Splatting is also available in this view.
Tulip rendering engine inside a single view is the geographic view mash-up, where the Google Map API renders a map in one layer while the Tulip rendering engine renders the remaining layers on top of this map. Figures 6–9 present overviews of the major views implemented in the current Tulip release.
4.3.2 Interactors
Interaction is essential for most information visualization techniques. How-ever, generalizing interaction in an extendable way raises a significant challenge as a wide range of methods require support. A selection re-quires a transparent rectangle to be drawn on top of selected elements. Opening a meta-node requires a single click, a small amount of zooming and panning, and modification of the graph structure locally at the meta-node. The bring-and-go technique (Moscovich et al. 2009) changes the layout of the graph and requires both zoom and pan of the camera along a well-defined trajectory. Furthermore, programmers should be able to combine all these interactive techniques in the final visualization. As an example configuration, the mouse wheel could handle both zoom and pan, a left click could modify element selection, and a right click could display
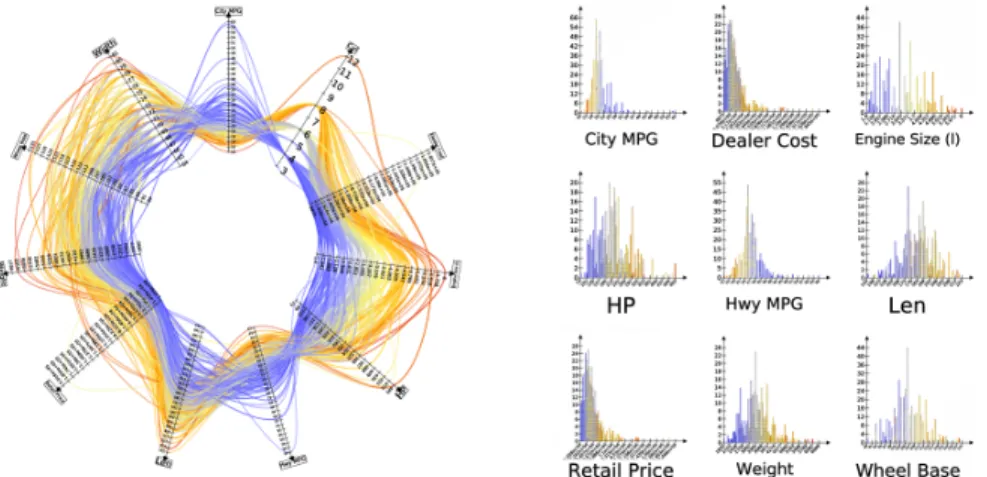
Figure 7: (Left) The parallel coordinates view depicts multivariate data, us-ing the traditional parallel coordinates representation as well as a circular representation. In both views, lines can be rendered with smooth Bézier curves. Interaction with the view is supported through zoom and pan, axis edition/permutation/shifting, and multi-criteria/statistical selection. (Right) The histogram view provides a view of element frequency. A matrix of his-tograms allows for the visual comparison of several statistical properties of a set of dimensions. This view has a standard set of navigation and statistical inter-actors. Additionally, an interactor enables the user to build nonlinear mapping functions to any of the graph attributes such as size, colors, glyphs, etc.
a context menu.
To support a wide range of interaction methods, we implemented the chain of responsibility design pattern. This pattern models the transmis-sion of a message through a chain of linked objects. During the trans-mission, the message can stop or continue along its path according to the object it passes through. In Tulip, we call an Interactor an entire chain and an InteractorComponent an object in the chain.
An InteractorComponent implements an interaction method and can handle all GUI events on a view, modify Tulip data structure, modify the view, and render objects on top of the view. In the MVC paradigm, this component can be seen as a microcontroller. To encourage reuse, an InteractorComponent is programmed to be as small as possible. For instance, the zoom and pan, fish-eye lens, magnifying glass, zoom box, and box selection interactors are often reused in different views and are implemented in five individual interactors.
An Interactor is an ordered set of InteractorComponent. The inter-actor receives all events from the view and implements the chain of respon-sibility which asks each InteractorComponent whether or not it handles an event. The Qt library is used as much as possible to achieve these operations. The interactor is also responsible for providing configuration widgets, documentation, and an icon for display in toolbars. Furthermore,
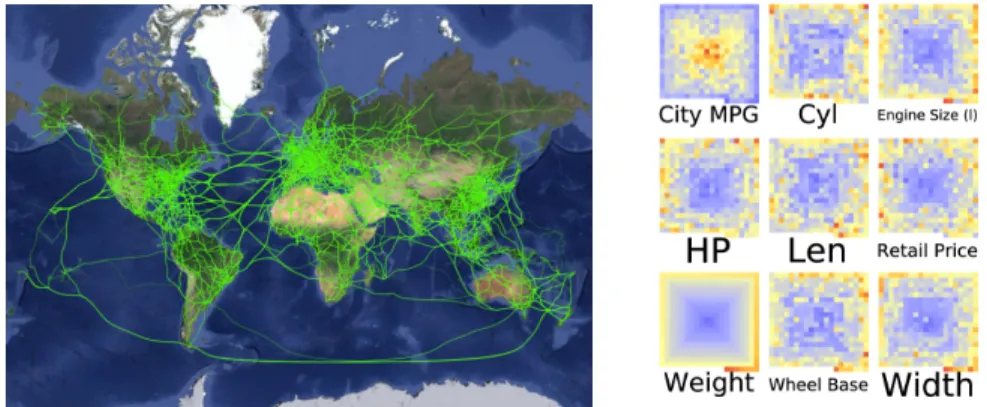
Figure 8: (Left) The geographic view implements a mash-up of the Google Map API. to specify geospatial positions of the nodes of a graph. When working with data in geography, graphs can be displayed on top of the map. This view sup-ports standard zoom and pan as well as the selection of elements. (Right) The pixel-oriented view uses space-filling curves to display large number of entities and relations on a screen. This view supports Peano curves, Z-order curves, spi-ral curves, and square curves. The pixel-oriented view is based on our previous data cube [15] visualization and supports zoom and pan/selection interaction as well as focus+context techniques.
Figure 9: (Left) The self-organizing view implements Kohonen self-organizing maps [33]. Several kinds of topology/connectivity for the generated maps are supported as well as navigation and selection interactors. (Right) The matrix view implements a matrix view of the graph. This view has been built to support graphs with a large number of nodes and edges. Zooming and selection interactors are available for this view.
interactors report the views with which they are compatible. In order to reuse the interactor without modification of source code, the set of views that an interactor supports can be dynamically extended.
Interactors are also Tulip plugins. Thus, programmers can create their own interactors by combining interactor components or developing new ones. As a result, interactors can be reused across views, and the programmer can extend the different types of interactions supported by Tulip. For example, GPU-based graph splatting can be implemented as an interactor.
4.4
Perspectives
As each application requires considerable programming effort which we all hope to reuse, Tulip supports domain-specific or user-centered perspec-tives. Following [38], real-world problems should be first characterized and abstracted into good operations and data types. There are good reasons to believe that Tulip contains several of the basic ingredients needed to properly combine and/or develop these operations and data types using Tulip’s plugin-based architecture.
After applying the Tulip framework in a variety of domains, including biology, social network analysis, and geography, we realized that many as-pects of a visualization system cannot be generalized and must be left to the application developer. However, in order to reduce re-implementation, we tried to embed all domain-specific elements inside perspective plu-gins, allowing general system components and interaction to be reused across applications.
A Tulip perspective specifies the visualization techniques (algorithms, views, and interactors) to assemble, how to load them and the graphi-cal user interface (GUI) These plugins can use domain-specific widgets, menus, and libraries. Perspectives are very different from the generic perspective that comes with the open source release. They are designed through user interviews and problem characterizations and are customized using Tulip libraries and plugins. The Porgy perspective (Sect. 5.2) is a good example of such implementation.
As our meta-model is generic, we hypothesized that one could keep the same data representation and switch between user interfaces depending on task. The development of the Tulip perspective was inspired by this requirement. In the MVC model, controllers are responsible for managing connections between models and views. Thus, by changing the controller, also known as a mediator pattern in the design pattern terminology, one can change the system behavior.
4.5
Tulip Run-Time Environment
As described above, the philosophy of the Tulip framework is to facilitate the reuse of plugins over many contexts. The advantage of this approach is that it allows easier framework extension. However, a disadvantage of this approach is programming an application that exploits a collection of plu-gins may be difficult to implement. This added complexity is, more gen-erally, a disadvantage of plugin-based systems. Tulip tries to overcome
those difficulties by implementing a simple plugin interface, and simple mechanism for plugin’s parameters and plugin’s inter-dependencies. Sec-tion 4.4, “Perspectives”, shows that Tulip does not create a visualizaSec-tion system, it is a perspective plugin launched by the Tulip software.
In our experience, we list the functions we consider either necessary or general enough to be used by a visualization system:
Model management: All perspectives store data inside a shared Tulip data model. The framework provides import, export, open/close and checks the data structure for modifications.
Plugin management: Since perspectives are plugins, they cannot be used until they are loaded. Thus, the framework initializes all li-braries and plugins. It also checks for plugin dependencies and can update or download plugins using the Tulip plugin web service. When creating a desktop application, as opposed to a web appli-cation, this functionality is necessary to involve the end user in the development. Frequent installation of new releases is one of the most important problems for end users.
Cross-platform support: Supporting multiple platforms is very time consuming when designing new applications. In Tulip, we aim to provide a platform-independent execution environment so program-mers can focus on the implementation of their visualization work-flow. Tulip is available for Linux (and *BSD systems), Windows, and Mac OS.
4.6
Python Integration
First introduced in Tulip 3.5, the Tulip framework now provides Python binding of all Tulip main features. It empowers users with easy scripting capabilities, facilitated by the property-based nature of Tulip. We used a common approach to bind C/C++ definitions with the SIP tool.3
The bindings are also publicly available from PyPI and can be in-dependently installed from the Tulip framework as a standard Python package4. Users can then manipulate their graphs, create visualization and export images completely independently from the Tulip perspec-tives and GUI previously mentioned. The main features provided by the bindings are the following ones:
Creation and manipulation of graphs: the Tulip data structure used for storing large and complex networks, defines and navigate graph hierarchies or cluster trees (nested sub-graphs) can be manipulated through Python independently of their visualization.
Storage of data on graph elements: Tulip allows the association of different kind of serializable data (Boolean, integer, float, string, ...) and visual attributes (layout, color, size, ...) with graph elements. All these data can be easily accessed from the Tulip graph data
3Riverbank Computing Limited. SIP - a tool for automatically generating Python bindings
for C and C++ libraries. http://www.riverbankcomputing.co.uk/software/sip/
4This package is available at https://pypi.python.org/pypi/tulip-python and can be
structure facilitating the development of algorithms. The accessors and iterators are implemented in a “pythonic” way to ease their ma-nipulation.
Creation of interactive visualizations: Tulip OpenGL visualizations (typically node-link diagrams) can be created from Python. Visual-izations are synchronized, meaning every modification on the visual-ized data (graph structure, visual attributes, . . . ) triggers automatic redraw. This is a convenient way to generate animations for exam-ple. It also makes Tulip a very didactic tool to support learning and teaching: now all graph theory algorithms can be visually rendered on-the-fly, in front of your students.
The ability to write plugins in Python: Python developers can con-tribute to Tulip and write plugins (algorithms, graph import/export) in their favorite language. These plugins can be called and inte-grated in the Tulip software in the same manner as the C++ ones, thus C++ plugins can call Python plugins and the other way round. Additionally, Tulip-python provides a start-up script environment so users can set up their own environment and automatically load plugins whenever they import the Tulip library or start the Tulip GUI.
Integration within the Python nebula: This renders possible any ex-tension of Tulip thanks to the immense resource of Python packages. External packages can be imported also within the Tulip GUI, as well as combined outside the GUI. For example, Detangler, discussed in Section 5.4, integrates Tulip with many other packages such as Numpy, for matrix manipulations. This enables also very flexible imports as prototyping specific parsers is made easier by Python and binding with the well known Neo4j graph database, SNAP [34], NetworkX [30] or any other graph library is made extremely easy. The Python integration is of course one important feature of the main Tulip GUI, and we provide a complete Python environment with Tulip-specific auto-completions. This auto-completion mechanism is aware of all graph properties and types, of all available plugins, parameters and data types, and, of course, of all the API provided by Tulip. The Python integration into the GUI takes different shapes (see Fig. 10):
An interactive console allows user to modify their graphs on the fly. All visualization settings are bounded with their representations, so any modification of the visualization parameters will show directly. Rapid edition of graph parameters can thus be rendered easily. A Python view can be attached to any graph. Instead of an actual
visu-alization view, it is a Python development environment in a nutshell attached to the current graph, with their own standard output. In this view, an ecosystem of scripts can be created and executed on the current graph. These scripts can be played, paused and stopped at will. This view is very convenient for rapid prototyping, debugging of visualizations and analysis algorithms.
A Python development perspective offers a comfortable development environment for plugins and modules. Modules edited within this
Figure 10: Python integration. The interactive console is shown a the bottom of the application and the Python view is displayed on the right. All the trans-formations performed using Python are applied in real time on the graph and can be visualized using another view (like the node-link diagram on the left).
environment benefit from all auto-completion capabilities and will be reloaded upon edition. In this perspective, the creation of Tulip-python plugins are facilitated thanks to a wizard, which automat-ically templates the scripts upon users’ choices. It also helps in editing and registering scripts on-the-fly. Plugins can be designed from this perspective, and, once saved, automatically reused in any other tulip application.
5
Key Applications
The Tulip framework congregates a set of libraries and an application managing the plugins using them. In a way, without plugins, Tulip is not able to visualize data. Nonetheless, it provides all the necessary functions and data structures to efficiently manipulate relational data as a graph. In this section, we describe some of the visualization systems we have built for diverse projects, all of which use Tulip as a starting point.
5.1
Generic Tulip Perspective
The Tulip Graph Visualization Perspective (see Fig. 1 for an overview) provides a generic software interface for the purpose of information vi-sualization and visual analytics. This perspective allows to interactively combine existing algorithms, techniques, and interaction methods to gen-erate domain-specific visualizations in a sort of pipeline exploration. This feature is helpful during projects, especially during interviews with end
users, as a combination of existing features can often be used as a foun-dation. The user feedback and the constructive critics can be used for designing the final visualization methods, usually implemented during the later stages of the project.
The user interface is automatically generated, compiling all available plugins. It also provides tools for manual configuration of both views and interactors. Moreover, the perspective supports the edition of graph element properties, the exploration of many subgraph hierarchies, and direct access to built-in functions of the Tulip core library (e.g., through the Python console or mouse context menus).
Section 6 below presents an instance of working session using this perspective to explore a data set.
5.2
Porgy: a Tulip Perspective
Porgy is an interactive visual environment fully supporting graph re-writing systems (GRS) related tasks [42]. A GRS operates on graphs by substituting local patterns according to a set of rewriting rules. Porgy enables rule-based modeling and simulation steering through graphical representations and direct manipulation of all GRSs components.
As a Tulip perspective, Porgy aims at designing relevant graphical representations and appropriate interactions on dynamic graphs. When using Porgy however, the dynamic graphs emerge from graph rewrit-ing systems. GRSs appear as powerful formalisms to capture and study phenomena occurring in complex systems, such as the evolution of bio-molecular networks [3] or the study and comparison of propagation models in social networks [51]. The ability to act on the simulation of the rewrit-ing calculus offers to the experts a unique mean of interactrewrit-ing with the systems they design and study, turning interactive visualization of GRSs into a high-level visual programming environment.
Porgy can be used to: trigger a series of transformations on the graph using graph rewriting rules (each describing some transformations), dis-play a sequence of graphs obtained after application of rewriting rules, as well as the sequence of rules used to attain these transformations, and de-sign analysis and verification tools to check static and dynamic properties of graphs.
5.3
rNAV: a standalone Tulip application
rNAV (for RNA navigator, see Fig. 12) is a tool for the visual exploration and analysis of bacterial sRNA-mediated regulatory networks. rNAV has been designed to help bioinformaticians and biologists to identify, from lists of thousands of predictions, pertinent and reasonable sRNA target candidates for carrying out experimental validations. The application proposes automatic mRNAs extraction from a simple genbank or embl genome file. rNAV also features an automatic annotation enrichment plugin powered by the DAVID (Database for Annotation, Visualization and Integrated Discovery) statistical enrichment tool [32] and two inter-action prediction tools: SSearch (part of the FASTA family [41]) and IntaRNA [22].
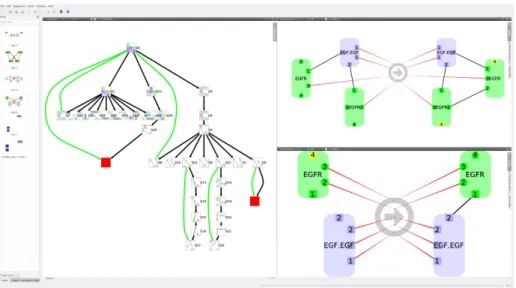
Figure 11: The Porgy perspective. The tool is here used to model, visualize and simulate biological systems with the tree on the left displaying different states of the system and their possible transitions, and the two graphs on the right showing examples of rules used to perform rewriting transformations.
rNAV algorithms can be gathered into pipelines which can then be saved and reused over several sessions. To support exploration awareness, rNAV also provides an exploration tree view that allows users to navigate through the steps of the analysis, select the sub-networks to visualize and compare results. These comparisons are eased by the integration of multiple and fully linked views.
This framework had been used to analyze various real biological data including several mycoplasma strains, perform genome-wide detection of sRNA targets [25] and analyze sRNA-mediated regulatory bacterial net-works [49].
5.4
Detangler: using Tulip as a server
Detangler5 [44] is a web-based tool designed for the analysis of multiplex networks (see Fig. 13). The tool provides a web-based interface which associates two networks through brushing and linking. Although the vi-sual interface is implemented using D3 [19], the graph computing engine is implemented using Tulip.
D3 offers great interactivity with all sorts of vector graphics. The analysis of multiplex networks as proposed by Detangler heavily relies on this interactivity. However, D3 is limited in performance and does not offer the richness of Tulip’s graph visualization and analysis algorithms. Detangler brings the best of the two API by providing an appealing SVG front-end, with a Tulip-based back-end graph analysis engine. The tool
Figure 12: The rNAV software. The different views are linked and represent the same genomic data set, enriched (annotated) using DAVID, at different state of the analysis. The redundant annotations can be filtered and regrouped to ease the visual analysis and labels can be used to display several input information like p-value, similarity or interaction energy. Finally, the exploration tree view (bottom right) shows the steps taken to perform the analysis.
then offers all of Tulip visualization algorithms and graph measures di-rectly within the web interface.
The engine relies on a combination of multiple C++ and Python Tulip plugins (such as Noack’s edge linlog [40]) delivered from a web server. The web server relies on the Tornado6 library in combination with the stand-alone Tulip-python library. In a REST-based manner, all user interactions, modifications or editions are transmitted to the server, which updates the graph accordingly, compute the requested information and delivers the results asynchronously.
In this example application, all the heavy-lifting is operated by the Tulip server using the Python bindings while all other lightweight inter-actions are performed directly in the client using D3’s flexibility.
6
Tutorial/Use case: using Tulip to
ana-lyze the Enron Email data set
The Enron Email data set (see http://www.cs.cmu.edu/~enron/) con-tains about half a million email exchanges (messages) collected from 150
Figure 13: An example of Detangler (http://detangler.labri.fr:31497 ). The mul-tiplex graph, layouts, and graph measures are all computed on the fly from the server side using Tulip. D3 is needed for the final rendering on the client side and maintains a communication with the server to handle user interactions.
individual email accounts. The exchanged messages involve more than 30, 000 persons and was released by the US Federal Energy Regulatory Commission during its investigation of the company. There are numer-ous questions one can ask about this data, with, as a main motivation, the intention to identify the most prominent actors, i.e., those by whom the troubles may have emerged. Because of the high number of edges, a powerful computer with a decent GPU is required.
We use the data found on the Stanford Network Analysis Project website (SNAP, https://snap.stanford.edu/data/email-Enron.html). The data file is organized as a network (a graph) where nodes correspond to email addresses appearing in the data and edges link two addresses i, j if address i sent at least one email to address j. Non-Enron email addresses act as sinks (no outgoing edges) and sources (no incoming edges) in the network as the data only covers communications between Enron email addresses. Even if the used data set proposes a limited content (only the graph topology is given in the data set), thus limiting the questions we can hope to answer, there is still information left to be found.
As a first step, we need to extract the file from the downloaded archive and import it into Tulip using the CSV import functionality. We wish to create a graph which contains a single edge (relation) for each i, j entry (one per line). Once the operation completed, the imported data is instantiated as a graph whose nodes are placed at random positions.
Although nodes can be differentiated from one another, using some layout algorithms provide a better drawing. For instance, a simple “Cir-cular” layout reveals some “holes”, or less dense area, in the center of the view. This implies that some nodes have a more limited number of connections, however, not much more insight as to how/why this hap-pens can be obtained using this graph drawing. The F M3 layout [29], a force-directed layout, is a much more efficient algorithm giving visually appealing results when facing graphs of small or intermediate size. The new drawing reveals more information on how exchanges took place as one
can now see a main component and a few satellite components of minor importance (Fig. 14). A subgraph containing only the largest component can be created by selecting all of the largest component’s elements (nodes and edges) and using the “Create subgraph from selection” item in the menu. We rename this subgraph “largest component” and to solely use this graph for the rest of this section.
Figure 14: The largest component plus some satellites of the Enron email data sets drawn with the FM3 plugin.
The (network) analytics. We may expect major actors as having exchanged more messages than others. A way to spot them is to compute the degree of nodes (“Degree” plugin). As a measure algorithm, the re-sulting value is stored in a Tulip property called “viewMetric” by default. The panel “Histogram View” can be used at this point to visualize the degree distribution just computed. It appears that, in this network, most of the actors have few connections. By using “Search”, or the selection interactor directly on the histogram, it is easy to select nodes with a high degree and find that only 1320 nodes have a degree of at least 100. Doing so, you can see that the newly selected nodes are also immediately selected in all the panels where they exist. Generally speaking, with Tulip, any view can be used to select graph elements. This allows analysts to jump back and forth between Tulip panels to visualize the selected data using another point of view and refining their selection by visually exploring the data set. A more visual feedback can be obtained with the “Color Mapping” plugin. For instance, it can be used after the “Degree” plugin to map the computed node degrees to a specific color according to a color scale.
More analytics (Actor Centrality) For this second part of net-work analysis, we decide to compute the “PageRank” index [21] of each actor (email address). This algorithm is well known for being the base of the index Google uses to rank web pages. Considering how “PageR-ank” uses the number of references, or hypertext links, to compute the index values, one may expect the actors with high index to be referred to more often in the network, and thus to have received more messages. The “spreadsheet view” panel can display the graph elements in a table, showing each of their respective values for all the property existing in the graph. As we select the single actor with the maximum “PageRank” in-dex (a click on a column header sort the column), we can alter its visual properties to make the node more noticeable:
• Make its size (viewSize property) 10 times as big as other nodes (map it to (10,10,10)),
• Make its shape (viewShape property) a “2D Hexagon”,
• Change its bordercolor (viewBorderColor property) to green and the width (viewBorderWidth property) of the border to 2.
With the actor now clearly visible, one can see that the node is not in the middle of the graph but is rather a part of a group of users strongly connected and slightly off-center. This location suggests that something interesting may be taking place between the core part of the network (the “center”) and this denser component to which the high index actor belongs.
Make it simple and readable (Aggregation and quotient graph) We propose now to build a simplified view of the network con-nectivity structure. To this end, we apply the “Louvain” algorithm [18]. Generally speaking, this clustering algorithm identifies subgroups of strongly connected users in the network. The algorithm just assigns each node an integer to indicate the subgroup number to which it belongs. Another plugin named “Equal value” can be used subsequently to form subgroups by putting all nodes having the same value for a given property in the same subgroup (using the viewMetric property by default). All subgroups become subgraphs of the graph on which the plugin is run.
To conclude this analysis, make sure the “largest component” graph is selected. We finally use the plugin “Quotient Clustering” (with the “Layout quotient graph(s)” option set) to create an extra graph in the hierarchy called “quotient of . . . ”. Dragging and dropping it into the node-link view will load the newly computed quotient graph. This peculiar graph provides an additional insight in comparison to the plain node-link view as each group of strongly connected users (also known as communities) is isolated in a subgraph, showing a clearer picture of their inner structure. The quotient graph also reveals how these subgroups interact with each other, some being peripheral while others are more “central” and somehow “larger” (Fig. 15).
Figure 15: The quotient graph of the largest graph component. This view provides a legible visualization when considering the subgroups. It is easy too see how some of the large and denser subgroups aggregate many subgroups with fewer nodes.
7
Future Directions
We have presented Tulip 4, an information visualization framework, and have explained the architectural choices made to create a robust, main-tainable and evolutive platform. Although Tulip has been primarily de-veloped as a scientific research tool to ease the creation of prototypes and perform experimentation in visualization, several years of software main-tenance, evolution and reinforcement have made Tulip fit as a base for the production of industrial projects. Information visualization has al-ways been at the center of Tulip, but while the limitation in the number of elements one may visualize can be reached quite quickly depending of the hardware, the core of the Tulip framework can scale to huge data sets, counting hundreds of millions of elements, thus still allowing fast computation without too much trouble. With more than a hundred of shipped-in plugins, dozens more available through the Plugin Center and the possibility to create your own plugins, Tulip provides a rich library with state-of-the-art algorithms adapted for both visualization and net-work analysis. Furthermore, Tulip is completely free and open-source, and is provided under the LGPL license to the community.
We have started to work on the next major release (Tulip 5). The main goal is to make Tulip usable both with a thin client, using a Web browser, and as a classical desktop application. To this end, a brand new rendering engine based on OpenGLES is being developed as well as a new interaction library for the future Web version of Tulip. On a more low-level aspect, we plan to generalize the VectorGraph API as the default graph datastructure.
Acknowledgments
The authors gratefully thank Daniel Archambault, Jonathan Dubois, Lud-wig Fiolka, Charles Huet and Morgan Mathiaut for their efforts to make Tulip such a good software.
References
[1] J. Abello, F. van Ham, and N. Krishnan. ASK-graphview: A large scale graph visualization system. IEEE Trans. on Visualization and Computer Graphics, 12(5):669–676, 2006.
[2] E. Adar. GUESS: A language and interface for graph explo-ration. In In CHI’06: Proceedings of the SIGCHI conference on Human Factors in Computing Systems, pages 791–800, 2006. http: //graphexploration.cond.org/.
[3] Oana Andrei, Maribel Fernandez, Hélène Kirchner, Guy Melançon, Olivier Namet, and Bruno Pinaud. PORGY: Strategy-Driven Inter-active Transformation of Graphs. In Rachid Echahed, editor, 6th In-ternational Workshop on Computing with Terms and Graphs (TER-MGRAPH 2011), volume 48 of Electronic Proceedings in Theoretical
Computer Science (EPTCS), pages 54–68, Saarbrücken, Germany, April 2011.
[4] D. Archambault, T. Munzner, and D. Auber. Grouse: Feature-based, steerable graph hierarchy exploration. In Proc. of Eurographics/IEEE VGTC Symp. on Visualization (EuroVis ’07), pages 67–74, 2007. [5] D. Archambault, T. Munzner, and D. Auber. TopoLayout: Multilevel
graph layout by topological features. IEEE Trans. on Visualization and Computer Graphics, 13(2):305–317, March/April 2007.
[6] D. Archambault, T. Munzner, and D. Auber. GrouseFlocks: Steer-able exploration of graph hierarchy space. IEEE Trans. on Visual-ization and Computer Graphics, 14(4):900–913, 2008.
[7] D. Archambault, T. Munzner, and D. Auber. TugGraph: Path-preserving hierarchies for browsing proximity and paths in graphs. In Proc. of the 2nd IEEE Pacific Visualization Symposium, pages 113–121, 2009.
[8] D. Auber. Outils de visualisation de larges structures de donnes. Phd, University Bordeaux I, 2002.
[9] D. Auber. Tulip : A huge graph visualization framework. In P. Mutzel and M. Jünger, editors, Graph Drawing Software, Mathematics and Visualization, pages 105–126. Springer-Verlag, 2003.
[10] D. Auber, Y. Chiricota, F. Jourdan, and G. Melanon. Multiscale navigation of small world networks. In IEEE Symposium on Infor-mation Visualisation, pages 75–81, Seattle, GA, USA, 2003. IEEE Computer Science Press.
[11] David Auber. Tulip. In Petra Mutzel, Mickael Jnger, and Sebastian Leipert, editors, 9th International Symposium on Graph Drawing, GD 2001, volume 2265 of Lecture Notes in Computer Science, pages 335–337, Vienna, Austria, 2001. Springer-Verlag.
[12] David Auber, Maylis Delest, Jean-Philippe Domenger, and Serge Du-lucq. Efficient drawing of rna secondary structure. Journal of Graph Algorithms and Applications, 10(2):329–351, 2006.
[13] David Auber and Fabien Jourdan. Interactive refinement of multi-scale network clusterings. In IV ’05: Proceedings of the Ninth In-ternational Conference on Information Visualisation, pages 703–709, Washington, DC, USA, 2005. IEEE Computer Society.
[14] David Auber and Patrick Mary. Mise en place dun mécanisme de plugins en c++. Programmation sous Linux, 1(5):74–79, 2006. [15] David Auber, Noel Novelli, and Guy Melançon. Visually mining the
datacube using a pixel-oriented technique. In IV, pages 3–10, 2007. [16] Mathieu Bastian, Sebastien Heymann, Mathieu Jacomy, et al. Gephi:
an open source software for exploring and manipulating networks. ICWSM, 8:361–362, 2009.
[17] Vladimir Batagelj and Andrej Mrvar. Pajek - analysis and visual-ization of large networks. In Graph Drawing Software, volume 2265, pages 77–103, 2003.