HAL Id: cea-01593500
https://hal-cea.archives-ouvertes.fr/cea-01593500
Submitted on 26 Sep 2017HAL is a multi-disciplinary open access archive for the deposit and dissemination of sci-entific research documents, whether they are pub-lished or not. The documents may come from teaching and research institutions in France or abroad, or from public or private research centers.
L’archive ouverte pluridisciplinaire HAL, est destinée au dépôt et à la diffusion de documents scientifiques de niveau recherche, publiés ou non, émanant des établissements d’enseignement et de recherche français ou étrangers, des laboratoires publics ou privés.
Redox Properties of Monocyclooctatetraenyl
Uranium(IV) and (V) Complexes: Experimental and
Relativistic DFT Studies
Farida Kias, Fatiha Talbi, Aziz Elkechai, Abdou Boucekkine, Didier
Hauchard, Jean-Claude Berthet, Michel Ephritikhine
To cite this version:
Farida Kias, Fatiha Talbi, Aziz Elkechai, Abdou Boucekkine, Didier Hauchard, et al.. Redox Properties of Monocyclooctatetraenyl Uranium(IV) and (V) Complexes: Experimental and Rela-tivistic DFT Studies. Organometallics, American Chemical Society, 2017, 36 (19), pp.3841-3853. �10.1021/acs.organomet.7b00585�. �cea-01593500�
1
Redox Properties of Monocyclooctatetraenyl Uranium (IV) and (V)
Complexes: Experimental and Relativistic DFT Studies.
Farida Kias, † Fatiha Talbi, † Aziz Elkechai, †* Abdou Boucekkine, ‡* Didier Hauchard, § Jean-Claude Berthet, ¶ and Michel Ephritikhine ¶*
†Laboratoire de Physique et Chimie Quantique, Faculté des Sciences, Université Mouloud Mammeri de Tizi-Ouzou, 15000 Tizi-Ouzou, Algérie.
‡ Institut des Sciences Chimiques de Rennes, UMR 6226 CNRS-Université de Rennes 1, Campus de Beaulieu, 35042 Rennes Cedex, France.
§ Ecole Nationale Supérieure de Chimie de Rennes, ISCR, UMR 6226 CNRS, 11 allée de Beaulieu, CS 50837, 35708, Rennes Cedex, France
¶ NIMBE, CEA, CNRS, Université Paris-Saclay, CEA-Saclay, 91191 Gif-sur-Yvette, France
* Corresponding Authors:
E-mail: A.B. abdou.boucekkine@univ-rennes1.fr
M.E. michel.ephritikhine@cea.fr
2
___________________________________________________________________________ Abstract
The redox properties of a series of mono(cyclooctatetraenyl) uranium (IV) and (V) complexes [(Cot)(Cp)U(NEt2)2] (1) (Cot = –C8H8, Cp = –C5H5) [(Cot)U(OiPr)3] (2), [(Cot)U(NMe2)3] (3), [(Cot)U(N{SiMe3}2)2] (4), [(Cot)U(NEt2)3]– (5) and the cyclopentadienyl compound [(C5Me5)U(NEt2)3] (6) have been investigated using cyclic voltammetry and relativistic Density Functional Theory (DFT). Electrochemical measurements of half–wave potentials in tetrahydrofuran were carried out under strictly anaerobic conditions. The calculations of ionization energies (IE) and electron affinities (EA) of these compounds, related to the UIII/UIV, UIV/UV and UV/UVI redox systems, revealed a very good linear correlation (r2 = 0.99) between calculated ionization energies at the ZORA/BP86/TZP level and the measured E1/2 half–wave oxidation potentials. A similar good linear correlation between the computed electron affinities and the electrochemical reduction potentials (r2 = 0.98) was obtained. It was found to be crucial to take into account the solvent effect as well as the spin-orbit coupling. The DFT computations permitted the estimation of the oxidation potential of 3 as well as the reduction potential of 5 for which the electrochemical measurement failed. An explanation of the different redox behaviors of the complexes has been given, considering the donating ability of the ligands and the nature of their frontier MOs. The molecular orbital analysis underlines the determining role of the metal 5f orbitals whereas a good correlation is observed between the Nalewajski–Mrozek bond indices and the structural variations related to the redox processes.
Keywords ZORA/DFT; redox properties; monocyclooctatetraenyl uranium complexes; ionization energy; electron affinity; electrochemical half–wave potentials; 5f orbitals.
3
4
INTRODUCTION
The synthesis of bis(cyclooctatetraenyl) uranium [(Cot)2U] (Cot = –C8H8 ), the analogue of ferrocene with a C8 aromatic ligand,1 was a major incitement to the development of organoactinide chemistry. The tetravalent "actinocenes" [(Cot)2An] (An = Th, Pa, Np, Pu, Am), and trivalent "lanthanocene" derivatives [(Cot)2Ln]−, came to enrich this new family of π– sandwich complexes.2,3 The nature of the metal–ligand bond and the role of the metal f orbitals
have attracted considerable attention.2,4-6 The reputed high stability of these complexes could
be explained by electronic considerations (mainly the overlapping of the metal f and dianionic aromatic ligand orbitals), knowing that steric factors imposed by the two cyclooctatetraenyl rings 5 confer a linear configuration to these compounds. The poor reactivity of these
compounds was for a long time evidenced by their reluctance to ligand coordination. However, recent studies have changed this generally accepted idea with the characterization of the cyanide adducts [(Cot)2An(CN)]– (An = U, Th),7,8 [(Cot)2Th(CN)2]2– and the neutral thorium complexes [(Cot)2Th(L)] (L = pyridine, bipyridine, phenanthroline and tBuNC).8 On the other hand, the reputedly chemically inert uranocene was also found to react with the very robust uranyl (VI) salts to give inorganic and organometallic hexanuclear uranium(IV) oxide clusters.9
These reactions are based on the unique redox behavior of the two anionic ligands (η-C8H8)2− of [(Cot)2U], which deliver four electrons, favoring reduction without deoxygenation of the uranyl(VI) species and further activation of the strong U=O bonds with trapping of the released U4+ ions.
By comparison with the limited chemistry of the bis(Cot) complexes, the mono(cyclooctatetraenyl) uranium compounds exhibit a rich diversity,10 with series of
derivatives of general formula [(Cot)UX2] and [(Cot)UX3]q– in which the variety of X ligands is as wide as in the two large and popular families of tris(cyclopentadienyl) [(Cp)3UX] (Cp =
–C5H5) and bis(pentamethylcyclopentadienyl) [(Cp*)2UX2] (Cp* = –C5Me5) compounds.11 The cyclooctatetraenyl ligand was found to stabilize the low and high oxidation states of uranium, from +3 to +5, giving to the complexes the capacity to be involved in redox processes.
Knowledge of the electron affinities (EA) and ionization energies (IE) of uranium compounds would be of major interest for the understanding and control of their stability and reactivity. However, no direct experimental determination of IE and EA of actinide complexes is reported to date, whereas a series of electrochemical studies of the UIII/UIV, UIV/UV and UV/UVI redox systems have been carried out with bis and tris(cyclopentadienyl),
5
bis(pentamethylcyclopentadienyl) and phospholyl uranium complexes.12-21 The only
voltammetry experiments on mono(cyclooctatetraenyl) complexes were performed with the uranium(III) mixed–sandwich compounds [(C8H6{1,4–iiPr3}2)(EC4Me4)U] (E = N, P, As), [(C8H6{1,4–SiiPr3}2)(C5Me4R)U] (R = Me, Et, iPr, tBu) and their dimeric uranium(IV) CO2 reduction products.22 The similarities in the UIII/UIV redox couples suggest that the selectivity in the outcome of CO2 reductive activation by these complexes is steric in origin rather than electronic.
While the lack of experimental measurements of electron affinities and ionization energies is due in great part to the difficulty in handling air sensitive and radioactive complexes, computational quantum chemistry offers useful routes to access to these properties. Schaefer et al 23have showed that EAs and IEs obtained with calibrated Density Functional Theory (DFT)
methods are rather reliable and in good agreement with experiment.23 First theoretical
investigation of EAs of organoactinide complexes which concerned the cyclopentadienyl uranium complexes [(Cp)3UX] and [(Cp*)2UX2] and some phospholyl derivatives showed that the DFT computed IEs and EAs correlate very well with the experimental half–wave reduction potentials E1/2.20,24
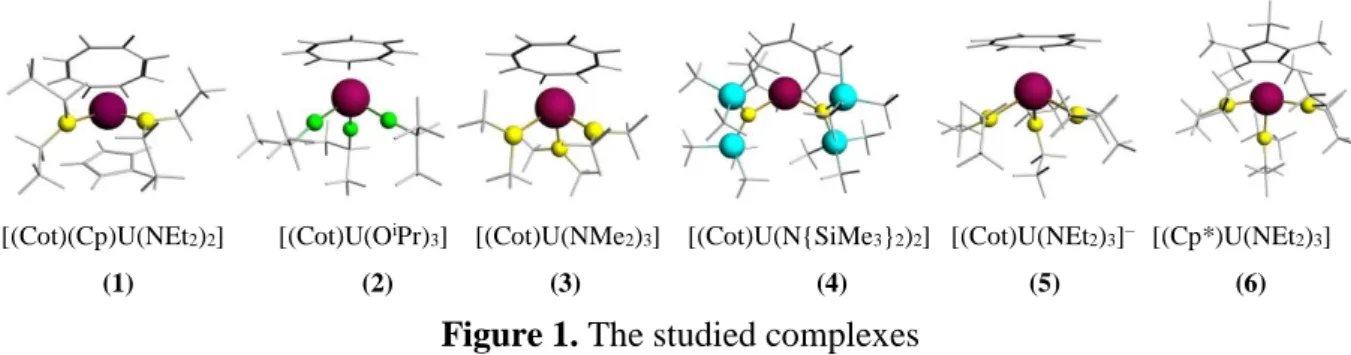
Here, we present a detailed relativistic DFT study of the redox behavior of two series of monocyclooctatetraenyl uranium complexes (Figure 1). Those of the first series are in the +V oxidation state, [(Cot)(Cp)U(NEt2)2] (1) (Cot = –C8H8, Cp = –C5H5), [(Cot)U(OiPr)3] (2), [(Cot)U(NMe2)3] (3),10g while the second series is composed of the uranium(IV) compounds [(Cot)U(N{SiMe3}2)2] (4),10a [(Cot)U(NEt2)3]– (5)10g together with the cyclopentadienyl derivative [(Cp*)U(NEt2)3] (6).25 Special attention will be paid to the electronic factors which govern the EAs and IEs of these U(V) and U(IV) complexes. The effects of the redox processes on the electronic structures will be investigated by analysis of the Nalewajski–Mrozek 26 bond–
multiplicity indices and the Hirshfeld electronic charges.27
[(Cot)(Cp)U(NEt2)2] [(Cot)U(OiPr)3] [(Cot)U(NMe2)3] [(Cot)U(N{SiMe3}2)2] [(Cot)U(NEt2)3]– [(Cp*)U(NEt2)3] (1) (2) (3) (4) (5) (6)
6 COMPUTATIONAL DETAILS
The calculations were performed using Density Functional Theory (DFT),28 scalar relativistic
corrections being introduced via the zeroth–order regular approximation (ZORA)29 to the Dirac
equation. Solvents effects have been taken into account using the Conductor–like Screening Model. The calculations were performed using the Amsterdam Density Functional (ADF2014.01) program package.30c The Vosko–Wilk–Nusair functional (VWN)31 for the local
density approximation (LDA) and the gradient corrections for exchange and correlation of Becke and Perdew32 respectively, i.e. the BP86 functional have been used. Our previous studies,
at the ZORA/BP86 level, showed that calculations carried out on bis and tris(cyclopentadienyl) uranium complexes lead to computed EAs in good agreement with experimental half–wave reduction potentials, so that we shall use the same methodology in the present work.
Geometry optimizations which have been carried out at the scalar relativistic level were followed by single point computations including spin–orbit coupling. In this study, we used for all atoms a triple–zeta Slater–type basis set (STO) augmented by one set of polarization functions, i.e. the triple–zeta polarized (TZP) basis set, taken from the ADF/ZORA/TZP database. The more extended ZORA/QZ4P basis set has also been used to check the accuracy of the computed properties. The spin unrestricted DFT scheme is used. The frozen–core approximation where the core density is obtained from four–component Dirac–Slater calculations has been applied for all atoms. For carbon C.1s, oxygen O.1s and nitrogen N.1s, the 1s core electrons were frozen, while the 1s/2s/2p cores were frozen for the silicon Si.2p. The U.5d valence space of the heavy element includes the 5f/6s/6p/6d/7s/7p shells (14 valence electrons). Several studies have shown that the ZORA/BP86/TZP approach reproduces the experimental geometries and ground state properties of f–element compounds with a satisfying accuracy.20,24,33-35
In our case, we carried out first the full geometry optimizations of the species under consideration, in the gas phase, at the spin unrestricted level. Next, the geometries were re– optimized in the solvent (benzene, toluene or THF) using the COSMO model. We used the non–default Delley type of cavity,36cthe solvent being considered with its dielectric constant
and its cavity radii. Then, single point calculations including spin–orbit corrections were carried out using the previously optimized geometries, for both the gas phase and the solution.
Molecular geometry and molecular orbital plots were generated, respectively, by using the MOLEKEL 4.337 and the ADFVIEW programs.30c
7
The computational evaluation of electron affinities or ionization energies is a difficult task owing to the fact that it implies odd–electron systems, with spin contamination and SCF convergence problems. It should be noted that in our case, spin contamination was found negligible, since the computed values <S2> of the squared spin operator are very close to the exact values for all the studied species (deviation less than 3%).
In the present work, the ionization energies (or the electron affinities) were calculated as the energy difference between the neutral and cationic (or anionic) forms of the complexes at their respective optimized geometries, i.e. the “ΔE method”. In terms of the energies E at optimized geometries, IE and EA are computed as follows: IE = E(cation) – E(neutral) for the oxidation reaction, and EA = E(neutral) – E(anion) for the reduction reaction. The ADF program that we use produces Total Bonding Energies (TBE) rather than total energies, so that IE is computed in our case as the TBE(cation) – TBE(neutral) difference for the oxidation process and EA as
TBE(neutral) – TBE(anion) for the reduction one.
EXPERIMENTAL ELECTROCHEMICAL DETAILS
Electrochemical experiments were performed in a single–compartment three–electrode cell designed for highly air–sensitive compounds and connected to an argon–vacuum line. The working electrodes were a platinum conventional disk electrode (0.5 mm radius) for cyclic voltammetry and a platinum disk microelectrode (7.5 µm radius) for steady state voltammetry. The auxiliary electrode was a platinum wire and the reference electrode a wire Ag/AgCl in THF+0.1mol.L–1 Bu4NPF6. The ferricinium/ferrocene ([Cp2Fe]+/0) system was used as an internal standard reference. All potentials are referenced to this redox system. The voltammetric studies of the UV series [(Cot)(Cp)U(NEt2)2] (1), [(Cot)U(OiPr)3] (2), [(Cot)U(NMe2)3] (3), and the UIV ones [(Cot)U(N{SiMe
3}2)2] (4), [(Cot)U(NEt2)3]– (5) and [(Cp*)U(NEt2)3] (6) were performed at room temperature in THF with tetrabutyl ammonium hexafluorophosphate or tetrabutyl ammonium tetraphenylborate as supporting electrolyte (NBu4PF6 at 0.1mol.L–1or NBu4BPh4 at 0.07 mol.L–1). Tetrahydrofuran (Aldrich) was stored under vacuum over sodium and benzophenone and transferred directly into the electrochemical cell by simple condensation (static vacuum method). Tetrabutylammonium salts (hexafluorophosphate (NBu4PF6) and tetraphenylborate (NBu4BPh4), Fluka, electrochemical grade), used without further purification, were dried under vacuum.
Electrochemical measurements were carried out with EG & G Princeton Applied Research potentiostat/galvanostat model 273A controlled by a computer. In cyclic voltammetry at
8
conventional electrodes, ohmic drop was compensated by feedback method in order to avoid distortions of voltammograms.
Half–wave potentials (E1/2) foroxidation or reduction redox system were determined from voltammograms obtained at conventional microelectrode under pure diffusion condition in cyclic voltammetry from (Epc + Epa)/2 (where Epc and Epa are the peak potential of the reduction oxidation reaction at the electrode respectively) and at ultramicroelectrode under steady state diffusion condition (with low potential scan rate: 20mV.s–1) from the potential at
ilim/2 (where ilim is the limiting current of the reduction or the oxidation wave). The E1/2 values of UIII/UIV, UIV/UV, UV/UVI redox systems given in the text are corresponding to the mean values of E1/2 determinations (between 2 and 4 determinations depending of the complex). The maximum relative standard deviation of values is lower than 2%.
RESULTS AND DISCUSSION
Structural Properties. First, the full geometry optimizations of the complexes 1 – 6 and their reduced and oxidized forms were carried out in the gas phase, at the spin unrestricted level of the theory. For the complexes 1 2 and 3 we considered the highest spin state for all species, i.e. a doublet state (5f1) for the neutral uranium(V) complexes, a triplet state (5f2) for the anionic uranium(IV) complexes and a singlet state (5f0) for the uranium(VI) cations, while for the compounds 4 5 and 6 the spin states are respectively a quartet state (5f3) for the anionic uranium(III) derivatives, a triplet one (5f2) for the neutral (4 and 6) and anionic (5) uranium(IV) complexes, and a doublet state (5f1) for their oxidized forms. All compounds have been optimized without any symmetry constraint. Finally, in order to check that the optimized geometries are minima on the potential energy surfaces and to simulate IR spectra, we also performed the calculation of the vibration frequencies of the complexes under consideration. Then, the geometries were further re–optimized in solution, using the COSMO approach, considering three different solvents, i.e. the two solvents used for the synthesis of the complexes: benzene (for 1, 2, 3) and toluene (for 4, 5 and 6), and tetrahydrofuran (THF), used for the electrochemical measurements. The non–default Delley type of cavity was used, the solvents being considered with their dielectric constants respectively equal to 2.30, 2.38 and 7.58 for benzene, toluene and THF, whereas the cavity radius have been set equal to 3.28 Å, 3.48 Å and 3.18 Å for benzene, toluene and THF respectively. Finally, single–point variational spin–orbit ZORA calculations using the previously optimized geometries have been carried out,
9
in both the gas phase and solution, in order to compute the spin–orbit coupling contributions to the energies.30b,38 In our case of open–shell systems, the non collinear approximation has been
used.38b
First of all, it is necessary to study the structures of the different species involved in the redox processes. In Table 1 are listed the most relevant computed geometrical parameters, i.e. bond distances and angles in the gas phase and in solution (benzene or toluene) at the ZORA/BP86/TZP level (the optimized structures and coordinates are given in Supporting Information (SI)).
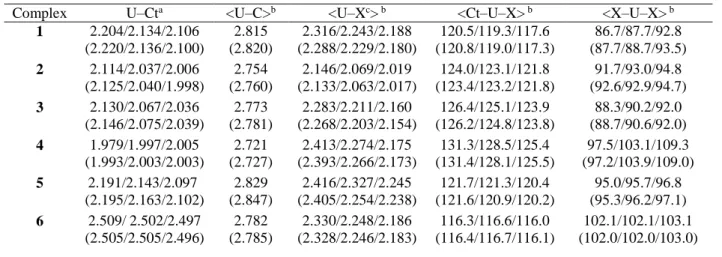
Table 1. Computed distances (Å) and angles (deg.) for complexes 1–6 and their oxidized and reduced forms at the ZORA/BP86/TZP level in the gas phase and in solution (in parentheses) given in the order reduced/neutral/oxidized from left to right.
Complex U–Cta <U–C>b <U–Xc> b <Ct–U–X> b <X–U–X> b 1 2.204/2.134/2.106 (2.220/2.136/2.100) 2.815 (2.820) 2.316/2.243/2.188 (2.288/2.229/2.180) 120.5/119.3/117.6 (120.8/119.0/117.3) 86.7/87.7/92.8 (87.7/88.7/93.5) 2 2.114/2.037/2.006 (2.125/2.040/1.998) 2.754 (2.760) 2.146/2.069/2.019 (2.133/2.063/2.017) 124.0/123.1/121.8 (123.4/123.2/121.8) 91.7/93.0/94.8 (92.6/92.9/94.7) 3 2.130/2.067/2.036 (2.146/2.075/2.039) 2.773 (2.781) 2.283/2.211/2.160 (2.268/2.203/2.154) 126.4/125.1/123.9 (126.2/124.8/123.8) 88.3/90.2/92.0 (88.7/90.6/92.0) 4 1.979/1.997/2.005 (1.993/2.003/2.003) 2.721 (2.727) 2.413/2.274/2.175 (2.393/2.266/2.173) 131.3/128.5/125.4 (131.4/128.1/125.5) 97.5/103.1/109.3 (97.2/103.9/109.0) 5 2.191/2.143/2.097 (2.195/2.163/2.102) 2.829 (2.847) 2.416/2.327/2.245 (2.405/2.254/2.238) 121.7/121.3/120.4 (121.6/120.9/120.2) 95.0/95.7/96.8 (95.3/96.2/97.1) 6 2.509/ 2.502/2.497 (2.505/2.505/2.496) 2.782 (2.785) 2.330/2.248/2.186 (2.328/2.246/2.183) 116.3/116.6/116.0 (116.4/116.7/116.1) 102.1/102.1/103.1 (102.0/102.0/103.0)
a Ct = centroid of Cot or Cp* ligand. b Average values, c X = N for all complexes, except 2 for
which X = O.
Our discussion will be focused first on the optimized geometries obtained for the isolated compounds. In complexes 1–3 5 and 6, the uranium centre is found in a pseudo–tetrahedral configuration with the centroids of the C8 or C5 rings and the N or O atoms at the apices (Figure 1). The computed U–N bond distances in all complexes vary from 2.20 to 2.27 Å and are similar to those determined in other amide compounds10j. Thus, the U–N bond lengths of 4, 2.27 Å, are slightly larger than the Th–N distances of 2.32 Å in the crystallographically characterized complex [(Cot)Th(N{SiMe3}2)2],10a in line with the larger ionic radius of the ion Th4+ compared to U4+ ( rTh4+ ≈ rU4+ + 0.05 Å).39 In the computed structure of 4, presented in Figure 2, the
10
atom and the centroid of the Cot cycle U–Ct is 2.003 Å whereas those between the metal and carbon atoms of the cycle U–Ci are on average of 2.72 Å (values in THF), accurately reproducing the experimental value of 2.70 Å. The computed structure of 4 also shows that one carbon atom of each silyl ligand (C(6) and C(14), see Figure 2) is located nearer to metal than the others, in such a way as to mimic a four–legged piano stool with trans nitrogen atoms and trans carbon atoms.
Figure 2. Structure and atom numbering of [(Cot)U(N{SiMe3}2)2]
The U–C(6) and U–C(14) bond lengths are 3.363Å and 3.206 Å respectively, while the distances between the metal center and the other amide carbon atoms are all greater than 4.001 Å. These interactions induce the small contraction of some amide–based ligand angles; thus, N(2)–Si(3)–C(6) and N(11)–Si(12)–C(14) angles are 109.7° and 108.6° respectively, while the other N–Si–C angles average 112.9° (details of the geometrical parameters are in the SI). The computed geometrical parameters of 4 are in full agreement with the X–ray crystal structure of [(Cot)U(N{SiMe3}2)2].10a
The mean U–N and U–C bond lengths in [(Cot)U(NMe2)3] (3) and [(Cot)U(NEt2)3]– (5) are 2.19 and 2.73 Å, and 2.26 and 2.77 Å respectively, and are larger than those of 2.13 and 2.66 Å determined by EXAFS and X-ray crystallography in the cation [(Cot)U(NEt2)2(THF)]+, reflecting the increasing electronic charge of these complexes (see SI).
The U–O distance and the Ct–U–O and O–U–O angles of [(Cot)U(OiPr)3] (2), of 2.06 Å, 123.2 and 92.9° respectively, are consistent with those found recently by Moylan 40 (2.03 Å, 124.3
and 91.4°) in a DFT study at the ZORA/PBE0 level on similar compounds. In the same way, the computed U–N and U–C(cot) distances of the oxidized form of [(Cot)(Cp)U(NEt2)2] (1), of 2.18 Å and 2.79 Å respectively, can be compared with those of 2.19 Å and 2.78 Å of
11
[(Cot)(Cp)U(NEt2)2]+40. In addition, the same U–N and U–C(Cp*) bonds of the oxidized form of [(Cp*)U(NEt2)3] (6) compound presenting calculated distances of 2.18 Å and 2.78 Å respectively, similar to those of Moylan (2.14 Å, 2.74 Å), accurately reproduce the experimental data (2.16 Å, 2.77 Å) of the analogue cationic amide complex [(Cp*)2U(NEt2)2]+.10i
Finally, as it can be seen in Table 1, the influence of the different solvents on the optimized geometrical parameters is rather small, even if we note that the U–Ct and U–C distances increase slightly in solvent whereas the other U–X bond lengths decrease by less than 1%.
The electron capture by the uranium(V) and (IV) compounds leading to the anionic uranium(IV) and (III) species causes a lengthening of the metal–ligand distances (see complete geometrical parameters for all species in SI), that is mainly due to the increase of the ionic radius of uranium from U5+ to U4+ or from U4+ to U3+.39 On the opposite side, the oxidation
process induces a shortening of the metal–ligand bonds (ca. 0.1 Å). Moreover, it is noteworthy that oxidation affects somewhat the Cot–U–X angles which contract slightly by ca 2°, with for consequence an opening of the X–U–X angles. Thus, the average Cot–U–N angle (in gas phase) passes from 119.3° in 1 to 117.6° in the corresponding cationic UVI species, whereas the average N–U–N angle opens from 87.7° to 92.8°. The optimized molecular geometries of the complexes and their oxidized and reduced forms are depicted on Figure 3.
12
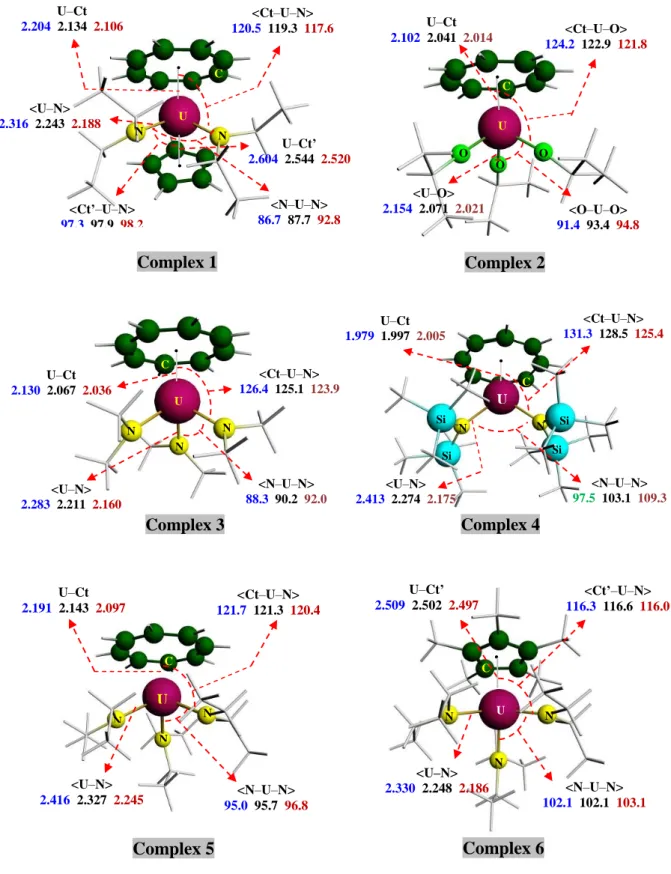
Figure 3. Optimized geometries of the complexes and their reduced and oxidized forms computed at the ZORABP86/TZP level (isolated molecule). Distances given in the order UIV/UV/UVI or UIII/UIV/UV from left to right. Hydrogen and carbon atoms are omitted for clarity; (Ct and Ct’ are the centroids of the Cot and Cp in 1 (or Cp* in 6) respectively).
U N N 7 7 C Complex 1 <N–U–N> 86.7 87.7 92.8 <U–N> 2.316 2.243 2.188 <Ct’–U–N> 97.3 97.9 98.2 <Ct–U–N> 120.5 119.3 117.6 U–Ct 2.204 2.134 2.106 U–Ct’ 2.604 2.544 2.520 Complex 2 C O O U O <U–O> 2.154 2.071 2.021 U–Ct 2.102 2.041 2.014 <O–U–O> 91.4 93.4 94.8 <Ct–U–O> 124.2 122.9 121.8 Complex 4 U–Ct 1.979 1.997 2.005 <Ct–U–N> 131.3 128.5 125.4 <U–N> 2.413 2.274 2.175 <N–U–N> 97.5 103.1 109.3 N N Si Si Si U C Si N N U C N <U–N> 2.283 2.211 2.160 <Ct–U–N> 126.4 125.1 123.9 U–Ct 2.130 2.067 2.036 <N–U–N> 88.3 90.2 92.0 Complex 3 Complex 6 Complex 5 <U–N> 2.416 2.327 2.245 <Ct–U–N> 121.7 121.3 120.4 U–Ct 2.191 2.143 2.097 <N–U–N> 95.0 95.7 96.8 C N N N U N N U C N <Ct’–U–N> 116.3 116.6 116.0 <N–U–N> 102.1 102.1 103.1 U–Ct’ 2.509 2.502 2.497 <U–N> 2.330 2.248 2.186
13
Nalewajski and Mrozek (N–M) bond orders26 are useful tools to study the electronic
structure of organometallic complexes.41 Generally, the calculated N–M bond orders correlate
very well with the experimental properties like bond lengths and vibrational frequencies. In Table 2 are reported the Nalewajski–Mrozek bond orders (NMBO) of the U–N and U–O bonds and the corresponding distances in complexes 1–6 computed at the ZORA/BP86/TZP level in the gas phase and solution (benzene or toluene).
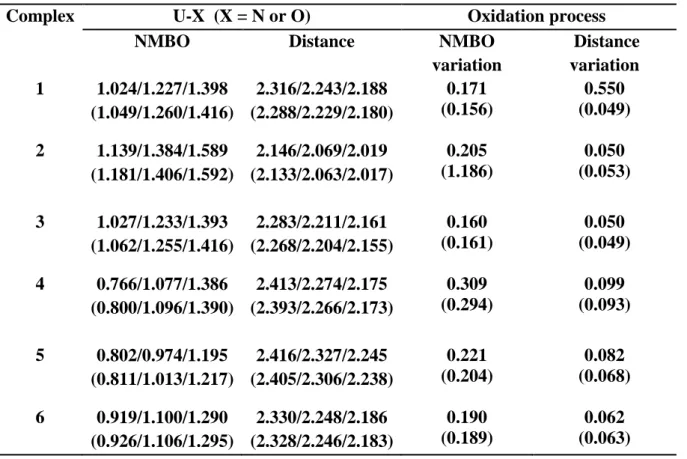
Table 2. Nalewajski–Mrozek Bond Orders (NMBO) and Distances of U–N or U–O Bonds of the Complexes and their Reduced and Oxidized Forms in the Gas Phase and in Solution (in parentheses)a
Complex U-X (X = N or O) Oxidation process
NMBO Distance NMBO
variation Distance variation 1 1.024/1.227/1.398 (1.049/1.260/1.416) 2.316/2.243/2.188 (2.288/2.229/2.180) 0.171 (0.156) 0.550 (0.049) 2 1.139/1.384/1.589 (1.181/1.406/1.592) 2.146/2.069/2.019 (2.133/2.063/2.017) 0.205 (1.186) 0.050 (0.053) 3 1.027/1.233/1.393 (1.062/1.255/1.416) 2.283/2.211/2.161 (2.268/2.204/2.155) 0.160 (0.161) 0.050 (0.049) 4 0.766/1.077/1.386 (0.800/1.096/1.390) 2.413/2.274/2.175 (2.393/2.266/2.173) 0.309 (0.294) 0.099 (0.093) 5 0.802/0.974/1.195 (0.811/1.013/1.217) 2.416/2.327/2.245 (2.405/2.306/2.238) 0.221 (0.204) 0.082 (0.068) 6 0.919/1.100/1.290 (0.926/1.106/1.295) 2.330/2.248/2.186 (2.328/2.246/2.183) 0.190 (0.189) 0.062 (0.063)
a NMBO and distances given in the order UIV/UV/UVI or UIII/UIV/UV from left to right.
The amide complexes present a single U–N bond (bond order equal to 1.227 for 1, 1.233 for 3, 1.077 for 4, 0.974 for 5 and 1.100 for 6). The U–N NMBO increases in the oxidized species and decreases in the reduced forms. As expected, these changes in bond multiplicity reflect the variations in the bond lengths, a higher bond order corresponding to a shorter bond length. Thus, a good linear correlation is obtained in the oxidation process between the variation
14
of the NMBOs of the U–N bonds and that of the U–N bond lengths (r2 = 0.98) (the alkoxide
complex 5 is excluded from this correlation). The correlation graph is given in the SI.
Electrochemical studies
The voltammograms obtained at a platinum electrode for the different complexes in THF + NBu4PF6 0.1 mol.L–1 present generally an oxidation and a reduction step as indicated by figures 4 and 5 for respectively the complexes 6 and 4 given as examples. Also, it can be observed on voltammograms at ultramicroelectrode under steady state diffusion condition an oxidation wave characterized by its half–wave potentials (E1/2, potential at ilim/2) which is equal to –0.720 V for 6 on figure 4b. This E1/2 value is referenced to the [(Cp)2Fe]+/0 redox couple by adding ferrocene in the electrolytic solution (oxidation wave at 0V on figure 4b). At the exception of 5, all the other complexes exhibit a reduction wave with a limiting current (Ilimred)
equal to Ilimox for the oxidation step. This indicated that the number of exchanged electron for
both redox processes are the same and equal to 1 if these limiting currents are compared to those of the ferrocene oxidation. The shape of the wave for a redox system depends of the kinetic of charge transfer and it can be concluded that the different redox systems for the studied complexes are according to rapid one–electron transfer processes. This is confirmed by cyclic voltammetry at conventional disk microelectrode (1 mm diameter) in the case of reversible redox system like oxidation of 4 (figure 5) and both oxidation and reduction of 6 (figure 4a). It can be noticed that in cyclic voltammetry the determination of the E1/2 value ((Epc + Epa)/2) is only possible if the redox system is chemically reversible (for example case of the oxidation process of 6 in UV on figure 5) or quasi–reversible (case of reduction process of 6 in UIII on figure 5). Moreover, the reversibility of the redox process of some complexes could be influenced by the nature of the anion used for the supporting electrolyte as indicate in the case of 6 (figure 4a). Also, in presence of NBu4PF6 no peak appears on the cyclic voltammogram at the forward scan for the oxidation system while it becomes totally reversible when the hexafluorophate anion is substituted by the tetraphenylborate anion. This behavior can be explained by the reaction of PF6– with the UV electrogenerated at the electrode.21 For solubility consideration the concentration of NBu4BPh4 cannot be higher than 0.07 mol.L–1. This leads to distortions due to ohmic drop which should be compensated to ensure reliable results. The E1/2 values were not notably influenced by the nature of the supporting electrolyte. Finally we can notice that the complementarities of steady state voltammetry at UME towards cyclic
15
voltammetry at classical electrodes is useful for the determination of E1/2 and number of transferred electron especially in the case of irreversible redox system, while cyclic voltammetry gives information concerning the stability of the complex resulting of the electron transfer.
information concerning the stability of the complex resulting of the electron transfer.
Figure 4. Reduction and oxidation of [(Cp*)U(NEt2)3] (6) 1.75 10–3 mol.L–1
(a) in cyclic voltammetry at Pt 1mm microelectrode in THF + Bu4NPF6 0.1 mol.L–1 or
b) In Steady State Voltammetry
E 1/2a E(V) vs [Cp2Fe]
+/-I
limredIlim
Ox UIII UIV + 1 e– UIV UV + 1 e– UIV UV + 1 e– UIII UIV + 1 e– Fc Fc + + 1 e– Fc Fc+ + 1 e– E(V) vs [Cp2Fe] +/0 a) In Cyclic Voltammetry16
Bu4NBPh4 0.07 mol.L–1 , v=100 mV.s–1 and (b) in steady state voltammetry at Pt UME (50 µm) in THF + Bu4NBPh4 0.07 mol.L–1, v=20 mV.s–1
Figure 5. Oxidation and reduction of 1.6210–3 mol.L–1 [(Cot)U(N{SiMe3}2)2] (4) on Pt disk microelectrode (d=1mm) in THF + Bu4NBPh4 0.07 mol.L–1; v=0.05 V.s–1
For the complexes 1 to 6 the values of E1/2 for oxidation and reduction system are collected in Table 3. Half–wave potentials could be assimilated to the apparent standard potentials of the UIII/UIV, UIV/UV and UV/UVI redox couples and can be correlated to computed ionization energies and electro affinities.
Table 3. Summary of Redox Potential Data* for Monocyclooctatetraene Complexes [1–6] in THF Electrolyte Solution at Room Temperature
UV Complexes Type E1/2(UVI/UV) (V) (reversibility) E1/2(UV/UIV) (V) (reversibility) ΔE1/2 (V) 1 [(Cot)(Cp)U(NEt2)2] –0.210 (Irev) –1.595 (Rev) 1.39 2 [(Cot)U(OiPr)3) –0.190 (Irev) –1.675 (Rev) 1.48 3 [(Cot)U(NMe2)3] ** –1.749 (Rev) - UIV Complexes Type E1/2(UV/UIV) (V) (reversibility) E1/2(UIV/UIII) (V) (reversibility) ΔE1/2 (V) 4 [(Cot)U(N{SiMe3}2)2] –0.100 –2.330 2.23 Epa UIII UIV + 1 e– UIV UV + 1 e– Epc UIV UV + 1 e– UIII UIV + 1 e– E(V) vs [Cp2Fe+/0] –2.6 –2.1 –1.6 –1.1 –0.6 –0.1 –3.6 –3.1 1.0 3.0 –1.0 –3.0
17 (Rev) (quasiRev) 5 [(Cot)U(NEt2)3]– –1.590 (Rev) *** - 6 [(Cp*)U(NEt2)3] –0.720 (quasiRev) –3.050 (Rev) 2.33
* All E1/2 values are referenced to the [(C5H5)2Fe]+/0 redox couple, ** The determination of
these potentials failed, *** The experimental determination not possible in the THF electrolyte.
From the electrochemical results given in Table 3, we can classify the redox potentials which decrease according to 4 > 2 > 1 > 6 > 5 for the oxidation process and to 1 > 2 > 3 > 4 > 6 for the reduction one. Electronic effects are dominating in these electrochemical reactions. It should be noted the particular case of the anionic compound 5 with an exceptionally but expected low UV/UIV potential (–1.59 V) knowing that 5 is an anionic species, thus easier to oxidize. If the UV/UIV potentials couples of the first UV series are in the usual range [1.4–1.8 V], those of the second series of complexes (4 and 6) are shifted to more negative potentials (destabilized) by ~1 V due to the electron donating abilities of their ligands. An analogous argument has been used to rationalize the reduction potentials of the aforementioned complexes, given in Table 3. For instance, the complex with the more electron-donating pentamethylcyclopentadienyl Cp* exhibits the lowest measured potential (–3.05 V) and is the most difficult to reduce. As expected and usual, a low lying HOMO indicates a complex with a high IE and a low energy LUMO an easily reducible complex.
A final observation is that the variations in redox potentials, as seen in Table 3, are more pronounced on the E1/2 values for the reduction process than those of the oxidation process. The reversibility of the redox system is indicated in Table 3. It appears that the oxidation of UV complexes (1 and 2) is not reversible indicating that the corresponding UVI cations are not stable and a chemical reaction is coupled to the charge transfer. This is due to the fact that the HOMOs of these complexes are not pure 5f MOs, but predominantly ligand MOs (see SI). Thus, the oxidation of these complexes does not lead to a regular stable U(VI) iso-structural complex. On the contrary, the other complex which exhibits a metallic 5f HOMO give rise to the observed U(V)/U(VI) reversibility. On the contrary the reduction step exhibits reversible behaviors for 1 to 3 indicating a stability of the UIV anions. The LUMOs of the U(V) complexes are metallic 5f MOs so that the reduction leading to a stable U(IV) complex is expected. For the UIV complexes (4 to 6) all the redox systems are reversible or quasi–reversible.
18
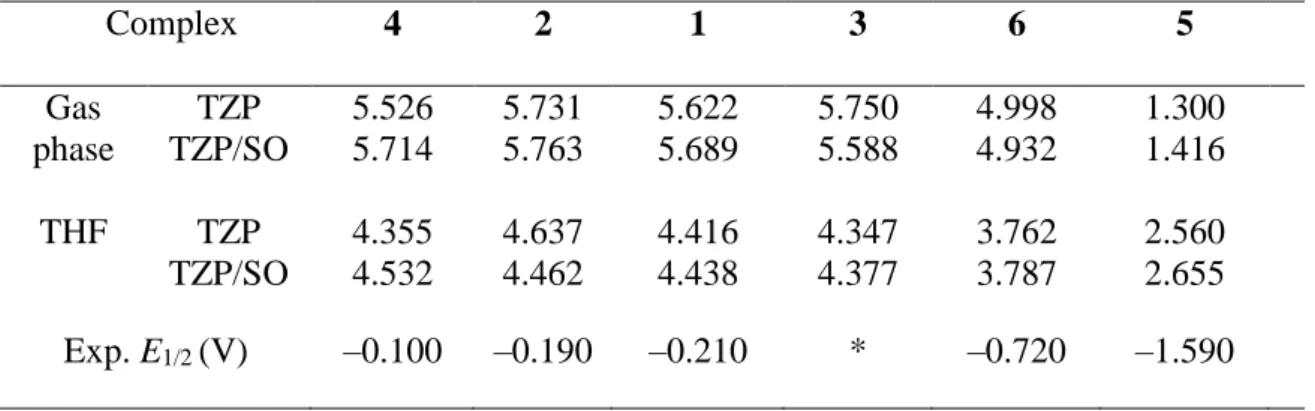
Redox Properties. We consider first the oxidation of the complexes. The total bonding energies (TBEs) calculated for all species allow the determination of the ionization energies (IEs). In all cases, the IEs were computed according to the “∆E method”, that is the difference between the TBEs of the compounds and their oxidized forms at their optimized geometries; the computed TBE values are given in SI. In Table 4 are given the computed IEs, in the gas phase and in solution (THF) for all complexes, at the ZORA/BP86/TZP level of theory; the row with the acronym SO corresponds to the values of the IE taking into account spin–orbit coupling. In the last row of this Table are displayed the experimental half-wave oxidation potentials electrochemically measured.21
Table 4. Ionization Energies (eV) of the Complexes at the ZORA/BP86/TZP Level in the
Gas Phase and in Solution, and the Experimental Half–Wave Oxidation Potentials E1/2
(V) Complex 4 2 1 3 6 5 Gas phase TZP TZP/SO 5.526 5.714 5.731 5.763 5.622 5.689 5.750 5.588 4.998 4.932 1.300 1.416 THF TZP TZP/SO 4.355 4.532 4.637 4.462 4.416 4.438 4.347 4.377 3.762 3.787 2.560 2.655 Exp. E1/2 (V) –0.100 –0.190 –0.210 * –0.720 –1.590
*system not characterized (no measured value of E1/2)
Considering the complexes in the gas phase, it can be noted in Table 4 that all the computed IEs are positive, their values being between 1.300 and 5.750 eV and between 1.416 and 5.763 eV when including spin-orbit coupling. The IE of complex 5 is characterized by its low value (2.655 eV in solution) compared to those of the other compounds, due to the fact that 5 is an anionic species. This compound, which exhibits the lowest half–wave oxidation potential (–1.590 V), is therefore the easiest to oxidize. At the opposite side, complex 4 exhibits the highest IE (4.532 eV in solution) and probes to be the most difficult to oxidize, a situation which results from the weak electron donating ability of the silyl amide ligand as given by the Hammett constants,44 notwithstanding the influence of its steric hindrance.
19
In addition, it can be seen that spin–orbit coupling affects in a slightly different way the IEs of these systems, leading to a small increase of IE except for the neutral tris(amide) compounds 3 and 6 for which IE decreases slightly. The effect of solvent appears by a significant decrease of the IEs (about 1.2 eV), except as expected for the anionic compound 5 whose IE increases by 1.24 eV. The order of ionization energies is: IE(4) > IE(2) > IE(1) > IE(3) > IE(6) > IE(5).
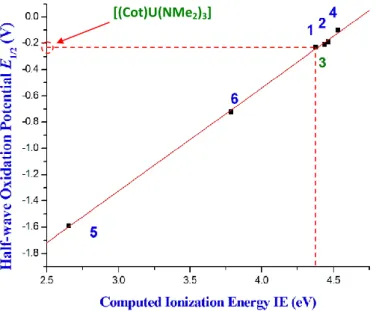
A very nice linear correlation is obtained between the computed IEs (in THF at the TZP level including the spin–orbit correction) and the five measured half-wave oxidation potentials
E1/2, the r 2correlation coefficient of the linear regression being equal to 0.99 (Figure 6). Neglecting spin–orbit effects worsens slightly the IE/E1/2 correlation (r2 = 0.97), in agreement with Schreckenbach study which shows that spin−orbit corrections to the AnVI/AnV reduction potential of the actinyl complexes [AnO2(H2O)5]n+ (An = U, Np, and Pu) are essential.45 Finally, it is worth noting that neglecting solvation affects even more the correlation between IE and
E1/2, with the r2 factor equal to 0.95.
Figure 6. Correlation between the computed ionization energies at the ZORA/BP86/TZP level in THF and the measured half–wave oxidation potentials E1/2 for the studied complexes. Following this good correlation, the value of the half–wave oxidation potential of complex 3 can be estimated, E1/2(3) = −0.24 V, using the linear regression of Figure 6, i.e. IE = 4.69 + 1.28 E1/2 and IE(3) = 4.377 eV. This E1/2 value makes this complex, as 1, 2 and 4, difficult to oxidize electrochemically. Experimentally, the oxidation process showed the existence of a
20
system which could not be characterized, because of its slowness or the presence of a chemical reaction coupled with the charge transfer.
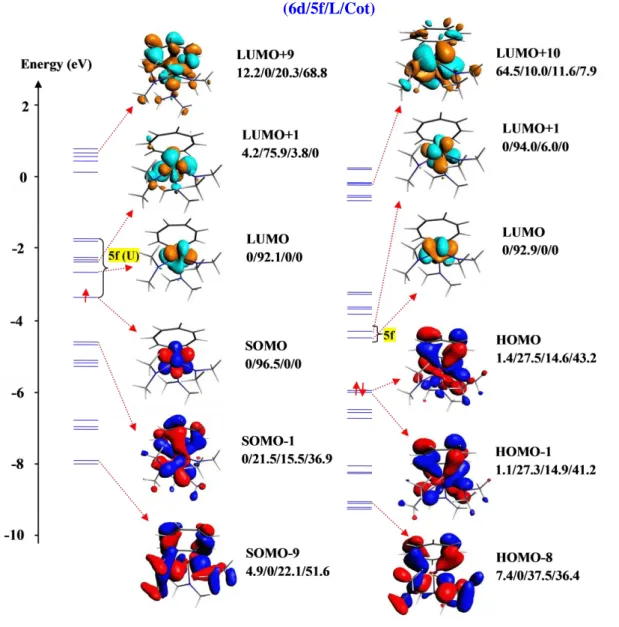
In order to study the changes undergone by the electronic structures upon oxidation, the molecular orbital (MO) diagrams of the complexes and the corresponding oxidized forms have been considered. The molecular orbital analysis carried out on the six compounds shows that the MO diagrams are quite similar within the same series of complexes; thus the OM analysis will be focused on two representative compounds, namely [(Cot)U(NMe2)3] (3) and [(Cot)U(N{SiMe3}2)2] (4) for the UV and UIV series, respectively. The MO diagram of 3 and 4 and their cationic oxidized forms are presented in Figures 7a and 7b, respectively. These diagrams show the occupied and virtual MO energy levels of selected orbitals, computed at the scalar–relativistic level, and plotted with the percentages (6d/5f/L/Cot) indicating the weight of the 6d and 5f metal orbitals as well as those of L and Cot ligands (L = NR2 with R = Me or SiMe3) in the MOs (more detailed frontier MO diagrams are given in the SI). The right side of each diagram corresponds to the cationic oxidized form of the complex.
In complex 3 (Figure 7a), the HOMO and LUMO exhibit a 5f character with the high contribution to MOs of 96.5 and 92.1 %, respectively. The contribution of the ligands to the HOMO and LUMO is practically negligible. From HOMO−1 to HOMO−9, and from LUMO+1 to LUMO+9, the contribution of the ligands to the MOs increases to reach large values in the HOMO−9 and LUMO+9, 73.7 and 89.1 %, with the Cot ligand contribution of 51.6 and 68.8 %, respectively. The same trend is observed in the cationic UVI derivative except in the HOMO where the ligands contribute with 57.8 % of which 43 % correspond to the Cot ligand. If we compare the HOMO–LUMO gap, we note that the UV complex 3 presents a smaller gap (0.675 eV) than that of the corresponding UVI species (1.515 eV), which makes this latter more stable than 3.
21
Figure 7a. α–MO diagram of the representative uranium(V) complex 3 (left) and its cationic oxidized form (right) (scalar ZORA/BP86/TZP computations in THF).
The MO diagrams of the UIV complex 4 (Figure 7b) reveal that the HOMO and LUMO have mostly 5f character with a weight of 92.9% and 92.7 % respectively.
A large contribution of ligands is observed in HOMO−9 and LUMO+9 with rate of 63.2 % and 19.2 % respectively. In the HOMO−9, the main contribution is essentially from the silyl amide ligand whereas in the LUMO+9, the main contribution is from the Cot ligand.
In the cationic oxidized form of 4, a notable difference is observed in HOMO−1 where, in contrast to 4, the ligand contributes significantly to the MOs with a weight of 61.92 % mainly from the Cot ligand (56.12 %). The HOMO–LUMO gap in both species is relatively small, 0.55 eV in 4 and 0.60 eV in its oxidized form, indicating that the two species have similar stabilities.
22
Figure 7b. α–MO diagram of the representative uranium(IV) complex 4 (left) and its cationic oxidized form (right) (scalar ZORA/BP86/TZP computations in THF).
Now, we examine the reduction of the two series of UV and UIV complexes, their half– wave reduction potentials determined from electrochemical measurements, relative to the UV/UIV and UIV/UIII redox systems, being available. The EAs are computed as the difference between the TBEs of the compounds and their reduced forms in their optimized geometries. The computed EAs, in the gas phase and in solution (THF), for all complexes at the same level of theory, are given in Table 5. In order to refine the results, we also carried out calculations by using the more extended ADF/ZORA basis sets, i.e. the TZ2P (Triple zeta) and the QZ4P (Quadruple Zeta) with two and four functions of polarization respectively. The rows with SO correspond to the values of the EA taking account of spin–orbit coupling. In the last row, are
23
displayed the experimental half–wave reduction potentials in volts (E1/2 vs. [Cp2Fe]+/0) of the complexes, measured in THF.21 The computed TBE values are given in the SI.
Table 5. Computed EAs (eV) of the UV/UIV and UIV/UIII Complexes at the TZP Level in
the Gas Phase and in THF.
Complex 1 2 3 4 5 6 Gas Phase TZP 1.487 1.168 1.197 1.063 −3.133 0.574 TZP-SO 1.569 1.148 1.375 1.032 −2.953 0.669 In THF Solvent TZP 2.830 2.453 2.571 2.172 0.533 1.764 TZP-SO 2.901 2.431 2.635 2.184 0.771 1.856 STZ2P 2.783 2.419 2.582 2.199 0.481 1.768 TZ2P-SO 2.850 2.437 2.642 2.172 0.700 1.852 SQZ4P 2.649 2.418 2.507 2.098 0.560 1.657 SQZ4P-SO 2.623 2.395 2.450 2.017 0.500 1.607 Exp. E1/2 (V) −1.595 −1.675 −1.749 −2.330 * −3.050
* Electrochemical measure for complex 5 failed
Except for the anionic complex 5, the computed EAs in the gas phase are as expected all positive, since the TBEs of the anionic reduced complexes, in their triplet or quadruplet state for the UIV or UIII species, respectively, are smaller than those of their neutral parents in their doublet and triplet state, respectively. The mixed Cot−Cp complex 1, which has the highest half–wave reduction potential (–1.595 V) exhibits the highest EA (1.487 eV) and is therefore the easiest to reduce. On the contrary, the pentamethylcyclopentadienyl amide compound 6 exhibits the lowest EA (0.574 eV) and is the more difficult compound to reduce.
While the spin–orbit coupling has a small influence on the TBEs of UV and UVI complexes (the increase being of 0.18 eV in maximum), the corrections brought by the solvent are relatively significant and affect differently the TBEs of the UV and UIV species, inducing an important variation of the EAs of the order of 1.3 eV. Complex 5is noticeable by the very large increase of its EA which passes from –3.133 to +0.533 eV. The use of the large QZ4P basis set permits to obtain an excellent linear correlation (r2 = 0.99) between the computed EAs (calculated in THF at the QZ4P level including the spin–orbit correction) and the measured half–wave reduction potentials E1/2 (Figure 8). If the solvent effects are not taken into account, the above correlation worsens significantly (r2 = 0.94).In the same way as for oxidation, this
24
reduction potential, i.e. E1/2 ≈ –4 V; this result explains the difficulty to reduce the anionic complex 5.
Figure 8. Correlation between the computed electron affinities at the ZORA/BP86/TZP level in THF and the experimental half–wave potentials E1/2 for the complexes.
Mulliken Population Analysis (MPA) and Hirshfeld Charge Analysis of the complexes shed light on some other aspects of the metal–ligand interactions. Despite its well–known limitations, MPA permits to describe qualitatively the evolution of charge transfers and bonding interactions occurring in a series of homologous molecular systems, while the Hirshfeld analysis27 which has been shown to be a valuable tool in inorganic chemistry, provide useful
atomic net charges. In Table 6 are collected the computed Mulliken metal spin populations and Hirshfeld charges of U, Cot and other ligands of the complexes and their oxidized and reduced forms. The numbers –1, 0 and +1 indicate respectively the anionic UIV, the neutral UV and the cationic UVI species. Metal spin population is calculated as the difference between the total α and β electronic populations of the metal. The net charges of the Cot and other ligands L are the global charges of these ligands and not only those of the atoms bound to uranium.
25
Table 6. Mulliken Metal Spin Density and Hirshfeld Charges of the Complexes (scalar ZORA/BP86/TZP Computations in THF).
Complex Complex charge
MPA Hirshfeld Charges Metal spin density U Cota Lb
1 –1 2.33 +0.572 –1.146 –0.426 0 1.42 +0.636 –0.419 –0.217 +1 0.000 +0.673 +0.317 +0.010 2 –1 2.25 0.549 –0.769 –0.780 0 1.28 0.674 –0.361 –0.313 +1 0.000 +0.752 +0.128 +0.120 3 –1 2.28 +0.568 –0.785 –0.783 0 1.34 +0.641 –0.383 –0.258 +1 0.000 +0.690 +0.037 +0.273 4 –1 3.02 +0.530 –1.062 +0.009 0 2.25 +0.652 –0.878 +0.226 +1 1.32 +0.709 –0.268 +0.559 5 –2 3.11 +0.492 –1.065 –1.427 –1 2.29 +0.579 –0.795 –0.784 0 1.38 +0.638 –0.429 –0.209 6 –1 3.03 +0.497 –0.521 –0.976 0 2.24 +0.603 –0.170 –0.433 +1 1.30 +0.690 +0.190 +0.120 a For 1, the Hirshfeld charge of Cot is the sum of the two rings, Cot and Cp. b The charge of ligand L is [complex charge – (U+ Cot) charge]
The Mulliken analysis (detailed in SI) indicates that the net charges of the metal are much smaller than their oxidation states due to the ligand–to–metal donation, the latter effect being highlighted by the weak negative charges carried by the Cot and L ligands. The MPA spin densities are larger than the total number of 5f electrons for all species, except for the cationic ones of the second series of uranium(V) complexes which are closed–shell systems. For instance, the MPA metal spin density is equal to 3.02 instead of 3 for the anionic reduced form of 4, while it is 2.25 instead of 2 and 1.32 instead of 1 for 4 and its cationic oxidized form, respectively. In each case a small delocalization of the unpaired electrons on the ligands is observed. The spin population data for the isolated complexes are practically similar to those computed in solution (see SI details).
26
Another quantitative approach of the major electron transfers occurring in molecular systems is provided by the Hirshfeld’s analysis (HA), which is supposed to give more realistic net charges than MPA.46 As already noticed with MPA, the ligand–to–metal donation increases
with the uranium oxidation state; this is highlighted by the decrease of the net charges of the ligands. For example, in complex 4, the sum of net charges carried by the two bulky ligands Cot and N(SiMe3)2, which is negative (–1.05) in the anionic reduced species, passes to –0.65 in the neutral complex 4, and becomes positive (+0.29) in the cationic oxidized form. Thus, the HA reproduces the same tendency than MPA (–1.30, –0.34 and +0.71 respectively with MPA, values in SI), but leads to a relatively smaller net charge for the UV derivative. On the other hand, HA is more realistic than MPA concerning the net charges carried by the uranium which increase slightly with the oxidation state of the central metal.
CONCLUSION
This work describes the redox behavior of two series of monocyclooctatetraenyl uranium complexes, i.e. the UV compounds [(Cot)(Cp)U(NEt2)2] (1) [(Cot)U(OiPr)3] (2), [(Cot)U(NMe2)3] (3), and the UIV compounds [(Cot)U(N{SiMe3}2)2] (4), [(Cot)U(NEt2)3]– (5) together with the cyclopentadienyl derivative [(Cp*)U(NEt2)3] (6), which have been investigated using cyclic voltammetry and, for the theoretical part, relativistic ZORA/BP86 computations.
Very good correlations (r2 = 0.99) were found between calculated ionization energies (IE) and electron affinities (EA) respectively with the measured oxidation and reduction potentials. It was found crucial to take into account the solvent effect as well as the spin-orbit coupling. The DFT computations permitted the estimation of the oxidation potential of 3 as well as the reduction potential of 5 for which the electrochemical measurements failed.
The electrochemical behavior of the two series of complexes revealed the ability of complex 4 to undergo a U(IV)U(V) process; the highest value of its oxidation potential (-0.10 V) is explained by the presence of the less electron donating ability of the trimethylsilyl amide ligand. Of the other side, in the case of complex 6, the more electron donating ligands Cp* and NEt2 bring the reduction potential towards the lower limit of the redox range (-3.05 V) making thus it most difficult to reduce. The variations of the computed IE and EA with the nature of the amide, alkoxide and Cot ligands, particularly with their electron donating ability, have been discussed through the various analyses carried out (MO diagram, NMBO and Hirshfeld). The reversibility or irreversibility of the redox systems could be rationalized considering the frontier
27
MO diagram of the complexes. For instance, the fact that the oxidation of UV complexes (1 and 2) is not reversible is explained by their HOMOs which are not pure metallic 5f MOs, but predominantly ligand MOs, contrarily to the other complexes. As usual, a low lying HOMO characterizes a complex with a high IE and a low energy LUMO indicates an easily reducible complex. Moreover, the Nalewajski–Mrozek bond orders and the Hirshfeld charges analyses permit also to well rationalize the effect of the redox processes on structural properties. Finally, this work shows the complementarity between the experiment and the theory, and described how experimental electrochemistry and DFT computations can be coupled to relate the electronic structure of these uranium species to observable electrochemical data.
SUPPORTING INFORMATION:
S1: Captions of all Tables and Figures
SI.2: Atoms numbering for all studied complexes SI.3: Optimized structures of all complexes
SI.4: Geometrical parameters of the studied complexes in gas phase and in solution SI.5: Nalewajski–Mrozek Bond Order Analysis
SI.6: Full MO interaction diagram of the UV and UIV complexes in THF SI.7: Total Bonding Energies
SI.8: Mulliken Populations Analysis and Hirshfeld Charges
AUTHOR INFORMATION:
E-mail for A.B.: abdou.boucekkine@univ-rennes1.fr
for M.E.: michel.ephritkhine@cea.fr
for A.E.: elkechai_aziz@ummto.dz Notes
The authors declare no competing financial interests.
ACKNOWLEDGMENTS
The authors acknowledge the financial support from the Algerian Project CNEPRU n° B00L0 1501 20130025. Computing facilities were provided by ASELKAM Computer Center (UMMTO, Algeria). The authors are grateful to GENCI–IDRIS and GENCI–CINES for an allocation of computing time (Grant No. 2016–2017–080649). ME and DH thank Dr C. Clappe
28
and Y. Prat for their contributions to the electrochemical characterizations of the studied complexes. The COST CM-1006 action is also acknowledged.
REFERENCES
1. (a) Streitwieser, A.; Müller–Westerhoff, U. J. Am. Chem. Soc. 1968, 90, 7364–7364. (b) Streitwieser, A.; Yoshida, N. J. Am. Chem. Soc. 1969, 91, 7528–7530. (c) Streitwieser, A.; Müller–Westerhoff, U.; Sonnichsen, G.; Mares, F.; Morrell, D. G.; Hodgson, K. O.; Harmon, C. A. J. Am. Chem. Soc. 1973, 95, 8644–8649.
2. (a) Marks, T. J.; Streitwieser, A. Jr. In The Chemistry of the Actinide Elements, 2nd ed.; Katz, J. J.; Seaborg, G. T.; Morss, L. R.; Eds. Chapman and Hall: London, New York, 1986; Vol. 2, Chapter 22, pp 1547–1571. (b) Burns, C. J.; Eisen, M. S. In The Chemistry of the
Actinide and Transactinide Elements, 3rd ed.; Morss, L. R.; Edelstein, N.; Fuger, J.; Katz,
J. J., Eds.; Springer: Dordrecht, The Netherlands, 2006; Vol. 5, Chapter 25, pp 2799–2910. (c) Burns, C. J.; Bursten, B.E. Comments Inorg. Chem. 1989, 9, 61–93.
3. (a) Boussié, T. R.; Eisenberg, D. C.; Rigsbee, J.; Streitwieser, A.; Zalkin, A.
Organometallics 1991, 10, 1922–1928. (b) Edelstein, N. M.; Allen, P. G.; Bucher, J. J.;
Shuh, D. K.; Sofield, C. D. J. Am. Chem. Soc. 1996, 118, 13115–13116. (c) Liu, W. L.; Dolg, M.; Fulde, P. Inorg. Chem. 1998, 37, 1067–1072. (d) Parry, J. S.; Cloke, F. G. N.; Coles, S. J.; Hursthouse, M. B. J. Am. Chem. Soc. 1999, 121, 6867–6871.
4. (a) Seyferth, D. Organometallics 2004, 23, 3562–3583. (b) Walter, M.D.; Booth, C.H.; Lukens, W.W.; Andersen, R.A. Organometallics 2009, 28, 698–707.
5. (a) Boucekkine, A.; Belkhiri, L.; f–Element Complexes. In: Jan Reedijk and Kenneth Poeppelmeier, Editors. Comprehensive Inorganic Chemistry II, (Editor S. Alvarez). Oxford: Elsevier, 2013; Vol 9, p. 277–319. (b) Belkhiri, L. ; Arliguie T. ; Thuéry, P. ; Fourmigué, M. ; Boucekkine, A. ; Ephritikhine, M. Organometallics 2006, 25, 2782–2795. 6. (a) Rösch, N.; Streitwieser, A. J. Am. Chem. Soc. 1983, 105, 7237–7240. (b) Beach, D. B.; Bomben, K. D.; Edelstein, N. M.; Eisenberg, D. C.; Jolly, W. L.; Shinomoto, R.; Streitwieser, A. Inorg. Chem. 1986, 25, 1735–1737. (c) Brennan, J. G.; Green, J. C.; Redfern, C. M. J. Am. Chem. Soc. 1989, 111, 2373–-2377. (d) Moritz, A.; Dolg, M. Chem.
Phys. 2007, 337, 48-–4.
29
8. (a) Berthet, J. C.; Thuéry, P.; Garin, N.; Dognon, J. P.; Cantat, T.; Ephritikhine, M. J. Am.
Chem. Soc. 2013, 135, 10003–10006. (b) Hervé, A.; Thuéry, P.; Ephritikhine, M.; Berthet,
J. C. Organometallics 2014, 33, 2088–2098.
9. Berthet, J. C.; Thuéry, P.; Ephritikhine, M. Inorg. Chem. 2010, 49, 8173–8177.
10. (a) Gilbert, T.M.; Ryan, R. R.; Sattelberger, A.P. Organometallics, 1988, 7, 2514–2518. (b) Boussié, T.R.; Moore, R.M.; Streitwieser, A.; Zalkin, A.; Brennan, J.; Smith, K. A.
Organometallics 1990, 9, 2010–2016. (c) Arliguie, T.; Baudry, D.; Berthet, J. C.;
Ephritikhine, M.; Le Maréchal, J. F. New J. Chem. 1991, 15, 569–570. (d) Arliguie, T.; Baudry, D.; Ephritikhine, M.; Nierlich, M.; Lance, M.; Vigner, J. J. Chem. Soc. Dalton
Trans. 1992, 1019–1024. (e) Berthet, J. C.; Le Maréchal, J. F. ; Ephritikhine, M. J Organomet. Chem. 1994, 480, 155–161. (f) Berthet, J. C.; Boisson, C.; Lance, M.; Vigner,
J.; Nierlich, M.; Ephritikhine, M. J. Chem. Soc. Dalton Trans. 1995, 3027–3033. (g) Boisson, C.; Berthet, J. C.; Lance, M.; Vigner, J.; Nierlich, M.; Ephritikhine, M. J. Chem.
Soc., Dalton Trans. 1996, 947–953. (h) Boisson, C.; Berthet, J. C.; Ephritikhine, M. ; Lance,
M.; Nierlich, M. J. Organomet. Chem. 1996, 522, 249–257. (i) Boisson, C.; Berthet, J. C.; Lance, M.; Nierlich, M.; Vigner, J.; Ephritikhine, M. J. Chem. Soc., Chem. Commun. 1995, 543–544. (j) Berthet, J. C.; Ephritikhine, M. Coord. Chem. Rev. 1998, 178–180, 83–116. 11. (a) Ephritikhine, M. Dalton Trans. 2006, 2501–2516. (b) Ephritikhine, M. Organometallics
2013, 32, 2464–2488.
12. (a) Kiplinger, J. L.; Morris, D. E.; Scott, B. L.; Burns, C. J. Organometallics 2002, 21, 3073–3075. (b) Jantunen, K. C.; Burns, C. J.; Castro–Rodriguez, I.; Da Re, R. E.; Golden, J. T.; Morris, D. E.; Scott, B. L.; Taw, F. L.; Kiplinger, J. L. Organometallics 2004, 23, 4682– 4692. (c) Morris, D .E.; Da Re, R. E.; Jantunen, K. C.; Castro–Rodriguez, I.; Kiplinger, J .L.
Organometallics 2004, 23, 5142–5153. (d) Schelter, E. J.; Yang, P.; Scott, B. L.; Thompson,
J. D.; Martin, R. L.; Hay, P. J.; Morris, D. E.; Kiplinger, J. L. Inorg. Chem., 2007, 46, 7477– 7488. (e) Graves, C. R.; Yang, P.; Kozimor, S. A.; Vaughn, A. E.; Clark, D. L; Conradson, S. D.; Schelter, E. J.; Scott, B. L.; Thompson, J. D.; Hay, P. J.; Morris, D. E.; Kiplinger, J. L. J. Am. Chem. Soc. 2008, 130, 5272–5285. (f) Graves, C. R.; Vaughn, A. E.; Schelter, E. J.; Scott, B. L.; Thompson, J. D.; Morris, D. E.; Kiplinger, J. L. Inorg. Chem. 2008, 47, 11879–11891. (g) Thomson, R. K.; Scott, B. L.; Morris, D. E.; Kiplinger, J. L. C. R. Chimie 2010, 13, 790–802.
13. Finke, R. G.; Gaughan, G.; Voegeli, R. J. Organomet. Chem. 1982, 229, 179–184. 14. Mugnier, Y.; Dormond, A.; Laviron, E. J. Chem. Soc., Chem. Commun. 1982, 257–258. 15. Sonnenberger, D. C.; Gaudiello, J. G. Inorg. Chem.1988, 27, 2747–2748.
30
16. Ossola, F.; Zanella, P.; Ugo, P.; Seeber, R. Inorg. Chim. Acta 1988, 147, 123–126. 17. (a) Hauchard, D.; Cassir, M.; Chivot, J.; Ephritikhine, M. J. Electroanal. Chem.1991,
313, 227–241. (b) Hauchard, D.; Cassir, M.; Chivot, J.; Baudry, D.; Ephritikhine, M. J. Electroanal. Chem. 1993, 347, 399–407.
18. Clappe, C.; Leveugle, D.; Hauchard, D.; Durand, G. J. Electroanal. Chem. 1998, 44, 95– 103.
19. Schnabel, R. C.; Scott, B. L.; Smith, W. H.; Burns, C. J. J. Organomet. Chem. 1999, 591, 14–23.
20. Elkechai, A.; Boucekkine, A.; Belkhiri, L.; Hauchard, D.; Clappe, C.; Ephritikhine, M. C.
R. Chimie 2010, 13, 860–869.
21. (a) Hauchard, D. Thèse de Doctorat, Université Paris VI, 1990. (b) Clappe, C. Thèse de Doctorat, Université Paris VI, 1997.
22. (a) Tsoureas, N.; Summerscales, O. T.; Cloke, F. G. N.; Roe, S. M. Organometallics 2013,
32, 1353–1362. (b) Tsoureas, N.; Castro, L.; Kilpatrick, A. F. R.; Cloke, F. G. N.; Maron,
L. Chem. Sci., 2014, 5, 3777–3788. (c) Kahan, R. J.; Cloke, F. G. N.; Roe, S. M.; Nief, F.
New J. Chem. 2015, 39, 7602–7607.
23. Rienstra–Kiracofe, J. C.; Tschumper, G. S.; Schaefer, H. F; Nandi, S.; Ellison, G. B. Chem. Rev. 2002, 102, 231–282.
24. (a) Elkechai, A.; Boucekkine, A.; Belkhiri, L.; Amarouche, M.; Clappe, C.; Hauchard, D.; Ephritikhine, M. Dalton Trans, 2009, 2843–2849. (b) Elkechai, A.; Meskaldji, S.; Boucekkine, A.; Belkhiri, L.; Bouchet, D.; Amarouche, M.; Clappe, C.; Hauchard, D.; Ephritikhine, M. J. Mol. Struct. (Theochem) 2010, 954, 115–123. (c) Elkechai, A.; Mani, Y.; Boucekkine, A.; Ephritikhine, M. Inorg. Chem. 2012, 51, 6943–6952. (d) Elkechai, A.; Kias, F.; Talbi, F.; Boucekkine, A. J. Mol. Model. 2014, 20, 2294–2304.
25. Dormond, A. J. Organomet. Chem. 1983, 256, 47–56.
26. (a) Nalewajski, R. F.; Mrozek, J. Int. J. Quantum Chem. 1994, 51, 187–200. (b) Michalak, A.; DeKock, R. L.; Ziegler, T. J. Phys. Chem. A 2008, 112, 7256–7263.
27. Hirshfeld, F. L. Theoret. Chim. Acta 1977, 44, 129–138.
28. (a) Hohenberg, P.; Kohn, W. Phys. Rev.1964, 136, B864–B871. (b) Kohn, W.; Sham, L. J.
Phys. Rev. 1965, 140, A1133–A1138. (c) Parr, R. G.; Yang, W. Density functional theory of atoms and molecules 1989. Oxford University Press, UK.
29. (a) van Lenthe, E.; Baerends, E. J.; Snijders, J. G. J. Chem. Phys. 1993, 99, 4597–4610. (b) van Lenthe, E.; Baerends, E. J.; Snijders, J. G. J. Chem. Phys. 1994 , 101, 9783–9792. (c) van Lenthe, E.; Ehlers, A.; Baerends, E. J. J. Chem. Phys. 1999, 110, 8943–8953.
31
30. (a) Fonseca, G. C.; Snijders, J. G.; te Velde, G.; Baerends, E. J. Theor. Chem. Acc.1998, 99, 391–403. (b) te Velde, G.; Bickelhaupt, F. M.; van Gisbergen, S. A. J.; Fonseca, G. C.; Baerends, E. J.; Snijders, J. G.; Ziegler, T. J. Comput. Chem. 2001, 931–967. (c) ADF2014.01, SCM, Theoretical Chemistry. Vrije University, Amsterdam, the Netherlands. http://www.sm.com.
31. Vosko, S. D.; Wilk, L.; Nusair, M. Can. J. Chem. 1990, 58, 1200–1211.
32. (a) Becke, A. D. J. Chem. Phys. 1986, 84, 4524–4529. (b) Becke, A. D. Phys. Rev. A 1988,
38, 3098–3100. (c) Perdew, J. P. Phys. Rev. B 1986, 33, 8822–8824. (d) Perdew, J. P. Phys. Rev. B 1986, 34, 7406–7406. (e) Perdew, J. P.; Wang, Y. Phys. Rev. B 1992, 45, 13244–
13249.
33. Ricciardi, G.; Rosa, A.; Baerends, E. J.; van Gisbergen, S. A. J. J. Am. Chem. Soc. 2002, 124, 12319–12334.
34. (a) Kaltsoyannis, N. Chem. Soc. Rev. 2003, 32, 9–16. (b) Shamov, G.A.; Schreckenbach, G. J. Phys. Chem. A 2005, 109, 10961–10974.
35. (a) Belkhiri, L.; Lissilour, R.; Boucekkine, A. J. Mol. Struct. (THEOCHEM) 2005, 757, 155–164. (b) Zaiter, A.; Boudersa, A; Bouzidi, Y.; Belkhiri, L.; Boucekkine, A. Inorg.
Chem. 2014, 53, 4687–4697. (c) Teyar, B.; Belkhiri, L.; Costuas, K.; Boucekkine, A.;
Meyer, K. Inorg. Chem. 2016, 55, 2870–2881.
36. (a) Klamt, A.; Schürmann, G. J. Chem. Soc. Perkin Trans. 1993, 2, 799–805. (b) Klamt, A. J. Phys. Chem. 1995, 99, 2224–2235. (c) Klamt, A.; Jones, V. J. Chem. Phys. 1996, 105, 9972–9981. (d) Klamt, A.; Jones, V.; Bürger, T.; Lohrenz, J. C. J. Phys. Chem. A 1998, 102, 5074–5085. (e) Delley, B. Mol. Simul. 2006, 32, 117–123. (f) Klamt, A. 2005 COSMO-RS
from quantum chemistry to fluid phase thermodynamics and drug design. Elsevier,
Amsterdam, the Netherlands, ISBN 0-444–51994–7.
37. MOLEKEL4.3, Flükiger, P.; Lüthi, H. P.; Portmann, S.; Weber, J. Swiss Center for
Scientific 2002.
38. (a) van Lenthe, E.; Snijders, J. G.; Baerends, E. J. J. Chem. Phys. 1996, 105, 6505–6516. (b) van Wüllen, C. J. Comput. Chem. 2002, 23, 779–785.
39. Shannon, R. D. Acta Crystallogr. Sect. A 1976, 32, 751–767.
40. Moylan, H. M.; McDouall, J. J. W. Chem. Eur. J. 2017, 23, 7798–7808.
41. (a) Fox, R. A.; Cummins, C. C. J. Am. Chem. Soc. 2009, 131, 5716–5717. (b) Diaconescu, P. L.; Arnold, P. L.; Baker, T. A.; Mindiola, D. J.; Cummins, C. C. J. Am. Chem. Soc. 2009,
122, 6108–6109. (c) Patel, D.; King, D. M.; Gardner, B. M.; McMaster, J.; Lewis, W.; Blake,
32
42. Fonseca Guerra, C.; Handgraaf, J. W.; Baerends, E. J.; Bickelhaupt, F. M. J. Comput. Chem. 2004, 25,189–210.
43. Camire, N.; Mueller–Westerhoff, U. T.; Geiger, W. E. J. Organomet. Chem. 2001, 823, 637–639.
44. (a) Hammett, L. P. J. Am. Chem. Soc. 1937, 59, 96–103. (b) Laurence, C.; Wojtkowiak, B.
Ann. Chim. 1970, 5, 163–191. (c) Charlton, M. Prog. Phys. Org. Chem. 1981, 13, 119–
251. (d) Hansch, C.; Leo, A.; Taft, R. W. Chem. Rev. 1991, 91, 165–195. 45. Shamov, G.A.; Schreckenbach, G. J. Phys. Chem. A 2005, 109, 10961–10974.
46. Fonseca Guerra, C.; Handgraaf, J. W.; Baerends, E. J., Bickelhaupt, F. M. J. Comput. Chem.
2004, 25, 189–210.
![Figure 2. Structure and atom numbering of [(Cot)U(N{SiMe 3 } 2 ) 2 ]](https://thumb-eu.123doks.com/thumbv2/123doknet/13181894.391282/11.892.354.597.332.551/figure-structure-atom-numbering-cot-u-n-sime.webp)
![Figure 4. Reduction and oxidation of [(Cp*)U(NEt 2 ) 3 ] (6) 1.75 10 –3 mol.L –1 (a) in cyclic voltammetry at Pt 1mm microelectrode in THF + Bu 4 NPF 6 0.1 mol.L –1 or](https://thumb-eu.123doks.com/thumbv2/123doknet/13181894.391282/16.892.133.723.266.1082/figure-reduction-oxidation-net-cyclic-voltammetry-microelectrode-thf.webp)
![Figure 5. Oxidation and reduction of 1.6210 –3 mol.L –1 [(Cot)U(N{SiMe 3 } 2 ) 2 ] (4) on Pt disk microelectrode (d=1mm) in THF + Bu 4 NBPh 4 0.07 mol.L –1 ; v=0.05 V.s –1](https://thumb-eu.123doks.com/thumbv2/123doknet/13181894.391282/17.892.135.754.199.505/figure-oxidation-reduction-cot-sime-disk-microelectrode-nbph.webp)