HAL Id: cea-02386634
https://hal-cea.archives-ouvertes.fr/cea-02386634
Submitted on 29 Nov 2019HAL is a multi-disciplinary open access archive for the deposit and dissemination of sci-entific research documents, whether they are pub-lished or not. The documents may come from teaching and research institutions in France or abroad, or from public or private research centers.
L’archive ouverte pluridisciplinaire HAL, est destinée au dépôt et à la diffusion de documents scientifiques de niveau recherche, publiés ou non, émanant des établissements d’enseignement et de recherche français ou étrangers, des laboratoires publics ou privés.
Tritiated water detection in the 2.17 µm spectral region
by cavity ring down spectroscopy
Cédric Bray, Agnès Pailloux, S. Plumeri
To cite this version:
Cédric Bray, Agnès Pailloux, S. Plumeri. Tritiated water detection in the 2.17 µm spectral region by cavity ring down spectroscopy. Nuclear Instruments and Methods in Physics Research Section A: Accelerators, Spectrometers, Detectors and Associated Equipment, Elsevier, 2015, 789, pp.43-49. �10.1016/j.nima.2015.03.064�. �cea-02386634�
Tritiated water detection in the 2.17 µm spectral region by cavity
ring down spectroscopy
C. Bray a, A. Pailloux b, S. Plumeri c
a
CEA, DEN, DPC, F-91191 Gif-sur-Yvette, France.
b
CEA, DIF, DASE, F-91297 Arpajon, France
c
Andra, 1-7 rue Jean Monnet, F-92298 Chatenay-Malabry, France
Nuclear instruments and methods in physics research section A
Number of Figures: 8 Number of Tables: 2
Corresponding author: Pailloux Agnès Email: Agnes.Pailloux@cea.fr
Tel: (33) 1 69 26 56 90
Keywords: nuclear waste containers, infrared molecular spectroscopy, continuous wave
cavity ringdown spectroscopy (CRDS), radionuclide, HTO, tritium detection
Abstract
Nuclear waste containers are intended to be stored in dedicated disposals sites. For the inside and environmental safety of the disposals site, the tiny outgassing rates leaking out the containers are measured. The radioactive HT gas is actually measured by liquid scintillation, however an alternative method, cavity ring down spectroscopy, is currently developed for tritium measurement in its oxidized form HTO and evaluated. The HTO molecule concentration is determined by the measurement of spectroscopic parameters from transitions on its harmonic 21 (R) transitions between 4590 and 4600 cm-1. Two tritiated water standards are measured with a dedicated CRDS set-up. Compared to the theoretical database, the line positions are correct (-0.067 to -0.128 cm-1), their relative intensities is in agreement with the database, but their absolute intensities are 30% weaker. Among the seven intense lines, the 4596.485 cm-1 line (intensity 8.22 10-22 cm/molecule) and the 4592.407 cm-1 line (intensity 9.83 10-22 cm/molecule) are isolated and intense for a sensitive detection. The HTO detection limit with the present set-up is 3 kBq (10 min), equivalent to 1.8 1012 molecules in the 111 cm3 CRDS cell. This detection limit could improve by a factor 3 (at least) by reducing the detection noise.
1. Introduction
Nuclear wastes are classified according to the waste material, and their nuclear radiation type and activity. Various nuclear waste containers are designed to optimize the radionuclide confinement. Some groups of the air tight containers may release hydrogen or possibly small molecules or atoms (methane, carbon mono or dioxide, krypton) in scarce gas flow rate, below 10 liter/container/year [1]. These gaseous species may include a small percentage of their radioactive isotope (HT, 14CO2, 14CH4, 85Kr). In France, the medium activity long lived
waste containers are intended to be stored in disposals sites. In order to ensure the safety of the facility and its environment, the outgassing of each container is characterized during the entrance acceptation procedure. Highly sensitive and selective methods are selected to measure these radioactive species. However, novel techniques are particularly welcomed if their application reduces the sampling period, improves the measurement. This paper focuses on the measurement of tritium, the radioactive isotope of hydrogen. Tritium is created by nuclear ternary fissions in the combustible, then migrates in the cladding and further. Tritium is then initially present in the related waste containers. Tritium is usually measured by liquid scintillation, after trapping the leaking HT and HTO in water. However, the gas sampling may last a few weeks to be measurable. Water is a well-known greenhouse gas, which strongly absorbs infrared radiation. Thus this paper proposes a laser absorption method based on vibrational molecular spectroscopy to quantify tritium in its oxidized form HTO.
CRDS, cavity ring down spectroscopy, measures molecular absorption spectra with sensitivity and high spectral resolution [2]. This technique is isotopically selective, real time (few minutes), and do not need calibration, if the spectroscopic parameters of the molecule are well known. The sample volume is small (few tens of cubic centimeters) and below atmospheric pressure, so sample having a small number of molecules is needed. Furthermore, CRDS is compact and cost-effective. This absorption technique sensitively measures molecules having a strong dipole, which is not the case of HT. Thus HT is first oxidized into HTO (with 100% efficiency), which has a strong rotation-vibration dipole. This study is the first stage of HTO measurement by CRDS, namely the intense and isolated rotation-vibration line selection in the theoretical database, the CRDS measurement of tritiated standards to experimentally retrieve the spectroscopic parameters of the HTO lines in the laser spectral region. The forthcoming absolute and accurate CRDS measurement relies on these spectroscopic parameters. Therefore, the theoretical parameters, modeled for this study, need an
experimental assessment, and a comparison. The experiment also points out HTO lines interfered by isotopologues or pollutants; these lines may consequently be excluded for tritium detection. It also gives an evaluation the actual experimental set-up, then the directions for improvement.
2. Cavity ring down spectroscopy and HTO spectroscopy
The beam of a single-mode continuous wave diode laser is injected, at a fixed frequency, in a high finesse cavity. A piezoelectric transducer moves back and forth one of the cavity mirrors in order to sweep the cavity length over at least one free spectral range, with a triangle modulation (30 Hz). This guaranties at least one resonance between the laser beam and the high finesse cavity within one period. When resonance occurs, the laser photons are progressively trapped inside the resonant cavity, accordingly producing an increased signal on the photodetector. Above a user defined threshold on the photodetector, the laser beam is promptly cut off by an acousto-optical modulator (AOM). The trapped photons then slowly decrease inside the cavity, either by absorption or by cavity losses; the resulting signal on the photodetector is an exponential decay which is measured and processed to determine the cavity lifetime, the so-called ring down time τ. The ring down time represents the overall cavity losses, including the molecular absorption of the gas sample inside the cavity. Precisely at a laser frequency ν, the ring down time τ(ν) is a function of the gas sample molecular absorption coefficient (ν) (cm-1), considering that the cavity losses generate a ring down time τ0 :
The molar concentration of a target species [A] is classically derived from the absorption coefficient.
, [Eq.2]
where σ(ν) is the molecular transition absorption cross-section (cm²), N the molecular number density (cm-3), proportional to the total gas pressure P and inversely proportional to the gas temperature T through the ideal gas law, and c is the speed of light (cm/s). Each molecular
transition is characterized by its position ν0, its intensity S(T) in cm-1/(molecule.cm-2), and a
collisional broadening coefficient γ in cm-1
self-collisions) and a Doppler (or temperature) broadening. The transition normalized profile Φ(γ,ν-ν0), typically a Voigt function, is a function of the experimental conditions and the line
spectroscopic parameters. No instrumental function is convoluted to the line profile, considering the narrow laser line width and the high spectral resolution of the cavity.
By a step by step laser frequency scanning, a CRDS spectrum measures the molecular lines absorption α(ν); a few cm-1
wide spectrum is recorded within a few minutes.
If the spectroscopic parameters of the measured line are not well-known, standards are first measured to retrieve the spectroscopic parameters (intensities, positions and collisional broadening coefficients) from the absorption cross-section.
When the spectroscopic parameters (S, ν0 and γ) are well-known, and the experimental
parameters P and T are controlled, the molecular concentration of gas samples is derived from the measured absorption coefficient, which in turn is inversely proportional to the ring down time. As a consequence, no calibration is needed to measure the molecular concentration of a gas sample.
According to the literature, the rotation-vibration spectrum of HTO – line positions, intensities, broadening coefficients – is rarely studied. Helminger et al. [3] have obtained pure rotational parameters using high resolution microwave spectrometer. The references [4-7] have experimental data for the fundamental ν1, ν2 and ν3 bands, using Fourier Transform
Spectrometer or Tunable Diode Laser. More recently, Down et al. [8] theoritically analyzed the HTO transitions between 7200 and 7245 cm-1 using a spectra measured by Kobayashi et al. [9]. To our knowledge, the harmonic bands of HTO were not studied elsewhere.
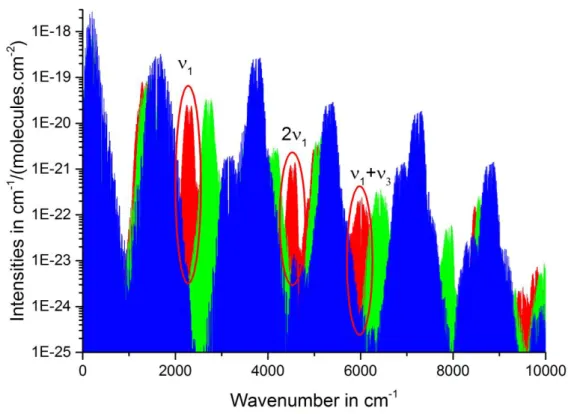
The spectral region scanned by CRDS is generally limited to 15 cm-1 with one diode laser. Then, it is important to carefully select the spectral region of the CRDS set-up dedicated to the HTO detection. An HTO transitions database is available via “spectra.iao.ru” [10]. The lines were calculated by S.A. Tashkun using PES [11] and DMS [12] and VTET computer code [13] with input parameters and basis adapted for this isotopologue. Figure 1 represents the intensities of isotopologues of water transitions (H2O, HDO and HTO) from 0 to 10 000
cm-1. Three high intensities bands show up in the 0-10 000 cm-1 region, in presence of water (H2O and HDO). The ν1 fundamental band, centered at 2300 cm-1, is the most intense band,
but due to the cost and availability of the CRDS components in the mid-infrared, the 2ν1,
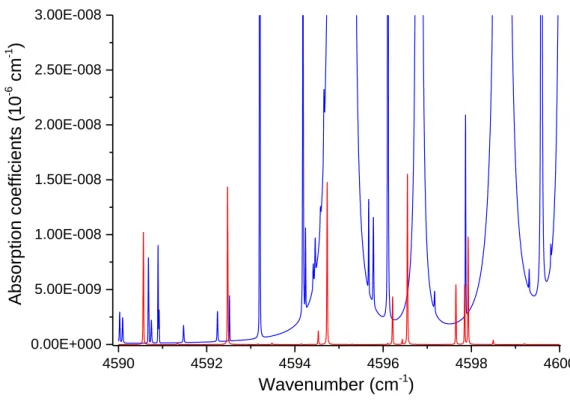
centered at 4500 cm-1, is preferred. This HTO band is strong and reasonably isolated from other isotopologues. Strong and isolated HTO transitions of the 2ν1 (R) band between 4590
theoretical spectrum between 4590 and 4600 cm-1 of isotopically natural water, containing 10-6 molar fraction of HTO, for a total pressure of 10 mbar.
3. Experimental set-up and measurement protocol
The experimental set-up is presented on Figure 3. A fibered Distrubuted Feed-Back diode laser, from Nanoplus®, centered at 2.172 µm (4592 cm-1), produces the narrow linewidth laser beam. This diode laser is frequency tuned over a 8 cm-1 range by varying the diode temperature from 15 to 30°C, the diode current being 100 mA, constant. The diode laser is control by the Newport 6100 controller, which has an accuracy of ±0.001 K° for temperature, and ±0.01 mA for the intensity. An > 30 dB optical isolator incorporated in the diode laser casing, suppresses the light reflexions toward the laser diode. The output power of the laser is about 3mW, and the spectral linewidth is about 10 MHz at 4592 cm-1. The laser beam propagates through the first order diffraction mode of an acousto-optical modulator (Isowave I-21-LM-SD-1.8-4), which abruptly (50 ns) interrupts the laser beam, with a 50 dB efficiency, when the laser is resonant with the cavity. The Gaussian laser beam is mode matched with the fundamental cavity mode TEM00 with a lens: the waist diameter (583 µm) is adjusted and its
position is centered between the 2 cavity mirrors. The laser beam is directed along the cavity axis by two flat mirrors. The cavity consists of two plano-concave high-reflectivity mirrors (Layertec ®), having a 1 m radius of curvature. The quoted reflectivity of the mirror is greater than 0.9995 at 2.172 µm. The optical cavity is the measuring cell, containing the gas sample. The mirrors are located inside mirror mounts (LGR®), equipped with micrometers adjustment screws. The mirrors are vacuum-sealed with silicone o-rings. The mirrors are heated (a few degrees) by heating patches on the rear side, to avoid dew formation. Besides the mirrors and mirror mounts, the measuring cell is a stainless steel tube of 11mm inner diameter; the total volume of the cell is 111±13 cm3. The cavity output is focused on a cooled InGaAs
photodiode (Hamamatsu G5853-103).A homemade transimpedance amplifier circuit converts
and amplifies the photodiode signal to a voltage signal. The signal is further amplified by a voltage amplifier (FEMTO DHPCA-100). The photodiode signal is connected to a fast (1.25 MHz) and 16 bit analogue acquisition card (PCI-6111, National Instruments). The ring down time τ – typically 90 to 20 µs depending on molecular absorption - is evaluated by fitting the
exponential laser decay, over a time range of seven lifetimes, by a Levenberg-Marquardt exponential fit.
The CRDS spectra are a succession of ring downs measured in a step by step mode, by changing the diode laser temperature with an equivalent wavenumber step of 1.8 10-3 cm-1. At each wavenumber, about 50 ring downs are averaged, leading to a noise equivalent absorption between 1.10-9 and 3.10-9 cm-1. The laser beam wavenumber is calibrated by a wavemeter (HIGHFINESSE Wavelength Meter WS7, Ser. No 1270), with a 0.4 10-4 cm-1 accuracy.
Prior to a sample measurement, the cavity volume is pumped down by a turbo-molecular pump to about 10-4 mbar. The liquid water sample (a few µL) is injected in the cell through a septum (ThermoGreen®) using a chromatography syringe. The liquid instantly vaporizes, until vapor pressure is reached eventually. The cell pressure is monitored by a capacitance gauge (model 628D from MKS Instruments, 100 mbar full range, 373 K stabilized temperature, 0.25% accuracy of reading). All spectra are measured at room temperature, 22±1°C. The water vapor pressure is then 26.45±0.16 mbar. Following the liquid sample injection, at least one hour is necessary to measure a stabilized gas pressure inside the cavity. For safety reasons, the sample activity is limited to 2 MBq, hence small sample volumes are manipulated and even note worthier, the gas sample is measured in static condition, without gas circulation and permanent purification. Consequently, gaseous pollutants, produced by any outgassing from the cell, may slowly build up in the cavity. Indeed, impurities having vibrational bands in the studied spectral region are measured by CRDS. These pollutants are continuously released by O-rings polymers, when the water sample fills the cavity. Various polymers (ERIKS®) were unsuccessfully tested. To reasonably prevent the water transitions to be spectrally interfered by impurity lines, the CRDS spectra of water samples are measured one hour after the liquid injection. This delay is the best compromise between a completely stabilized gas pressure and a small partial pressure of impurities.
4. Results
4.1 Preliminary study: spectroscopy of the water stable isotopologues
The complex rotation-vibration spectrum of the water molecule is intensely studied in the frame of climate change. Water has 9 stable isotopologues. Therefore a 10 cm-1 high
resolution and sensitive absorption spectrum of water may show tens of lines. On the other hand, the HTO concentration in the water sample is limited for safety reasons.
In order to identify unambiguously the HTO lines in a water sample, all the stable isotopologues lines showing in the 4590-4600 cm-1 region are first experimentally listed. To achieve this, a 97.1% H218O enriched standard, a 15% HDO enriched standard, and natural
distilled water (Table 1) are measured successively by CRDS (Figure 4) and compared theoretical spectra, modelled using the international molecular databases [10,14]. The experimentally derived positions and intensities of H216O, H218O and H217O, are in good
agreement with HITRAN database [14]. Compared to the “spectra.iao” database [10], the experimental HDO line positions are shifted between -0.13 and 0.05 cm-1.
4.2 Tritiated water (HTO) measurement
As previously mentioned, the present measuring cell includes two polymer o-rings. Water molecules diffuse inside polymers. During the propagation through the polymer, tritium atoms may isotopically exchange with local hydrogen belonging to the polymer matrix. This dual process was clearly observed when measuring small volume samples containing a low concentration of tritium. A measuring cell without polymer should be designed for tritium quantification [15]. Meanwhile, spectroscopic studies are carried on by maintaining a saturated vapor pressure inside the measuring cavity; a small water reservoir is filled with the liquid sample to keep the gas phase in equilibrium with the liquid phase.
A tritiated water standard with 340.1±4 MBq/g (Table 1) was bought from Perkin Elmer specifically for the HTO spectroscopic study. The HTO rotation-vibration spectrum is then measured by CRDS. The HTO experimental spectrum (Figure 5) is compared to the distilled water CRDS spectrum and to the HTO theoretical spectrum calculated using the “spectra” database [10]. Seven HTO transitions are unambiguously identified in this 4592-4598 cm-1 spectral region. The CRDS spectrum is fitted using a MATLAB dedicated program to retrieve the intensity, position and broadening coefficient of each identified HTO line. Then the experimental HTO transitions are fitted (Figure 6) with an easily computed Voigt profile. The experimental accuracy of the line position is 10-3 cm-1. The accuracy of the measured intensity is estimated to 15% with the following contributions: standard concentration 1.2%, influence of temperature in the determination of intensities 1%, pressure 5% (stabilization and air leak), fit 1 % and experimental noise 5% (signal to noise ratio of 20). Traditionally, the broadening coefficient is accurately measured by varying the pressure. But the present set-up fixes the
sample pressure to the vapor pressure; the resulting accuracy of the self-broadening coefficient is therefore estimated to 30%. The spectroscopic parameters of the HTO transitions measured in the 4592-4598 cm-1 spectral region are summarized in table 2. The experimental position of the HTO lines is shifted between -0.067 and -0.128 cm-1 from the theoretical position. The relative line intensities are in agreement with the theory. However, the measured intensities are 30% weaker than the theoretical. This intensity discrepancy is further investigated by measuring another HTO standard: 72.21±0.21 MBq/g, provided by the “Laboratoire national de métrologie et d'essais“ (LNE). The intense and isolated 4596.485 cm -1
HTO line is measured (Figure 7) successively in the vapor pressure of the 340±4 MBq/g Perkin Elmer and the 72.21±0.21 MBq/g LNE standards. The ratio of the measured line amplitudes is 4.7, consistent with the HTO concentration ratio in the standards. This additional result tends to confirm an overestimation of the theoretical intensities.
4.3 Evaluation of the HTO limit of detection
Two intense and isolated HTO transitions, studied previously, are selected for tritium detection: (514 21(R) 413) 4592.407 cm-1, and (606 21(R) 505) 4596.485 cm-1. An
Allan-plot [16] was measured (Figure 8) to determine the detection limit of the present experimental set-up, i.e. the optimized averaging N. The standard deviation of the noise decreases as up to N=600 indicating a normal distribution of the noise. Considering an acquisition rate of 30 Hz, the limit of stability of the set-up is reach after 20 sec. The Allan plot shows that the detection limit of the current CRDS set-up is 1.2 10-10 cm-1, when averaging 600 ring downs for each spectral data point. When averaging 50 ring downs (present experimental conditions), the CRDS detection limit is 5.5±0.8 1012 HTO molecules filled in a 111 cm3 CRDS cell – or 9.8±1.5 kBq -, the laser beam being tuned to the 4596.485 cm-1 transition. The CDRS measurement is completed within at 1 min.
5. Conclusion and Perspective
This spectroscopy work of HTO is also a preliminary demonstration of tritium evaluation by CRDS, a laser absorption technique. The theoretically intense and isolated harmonic band 21
isotopologues H216O, H218O and H217O have very weak lines in this spectral region, their
position and intensity [14] are found in good agreement with the CRDS measurement. This was expected for this well studied molecule. The experimentally measured positions of the HDO lines are slightly shifted from -0.13 to +0.05 cm-1 with respect to the Spectra database [10]. The seven HTO lines unambiguously identified in the spectral range covered by the laser diode are all negatively shifted between -0.067 and -0.128 cm-1 with respect to the theory [10]. Their relative intensities are similar to the database, but their absolute intensities are all about 30% weaker. These results show that the water molecular spectroscopy model is able to precisely predict the rotation-vibration spectra of water isotopologues.
According to this work, the CRDS techniques could measure HTO by scanning one or two intense and isolated HTO transitions: line 1, position 4592.407 cm-1, intensity of 9.83 10-22 cm-1/molecule.cm-2, or line 2, position 4596.485 cm-1, intensity of 8.22 10-22 cm
-1
/molecule.cm-2. Scanning the line 2, the actual set-up measures 9 kBq within 1 min, and the detection limit is 3 kBq, measured within 10 minutes, which corresponds to an optimized averaging of 600 per spectral data. By reducing the excess noise of this CRDS set-up, a 1 kBq detection limit is expected. This measurement capability matches the objective of this study; characterizing the tritium outgassing rate of a nuclear waste container, below 1 MBq/year, within a sampling period of a few days. Nevertheless, the key change to further quantify tritium applies on the CRDS measuring cell; polymers should be strictly prohibited, to prevent isotope exchange and the resultant tritium loss in the gas phase. These modifications are the identified next step of the present study.
Acknowledgments
The authors thank Philippe Cassette from LNE for the fruitful discussions about tritium measurement and to supply the HTO standard, Daniele Romanini, Alain Campargue and Samir Kassir from LIPhy (UMR 5588) for their constant support in developing CRDS technique and for the useful help concerning water molecular spectroscopy. They are also greatly thankful to CEA, DSV for giving access to the tritium laboratory in the frame a collaboration with CEA, DEN, DPC. This experimental study could start thanks to Guillaume Aoust’s work on the CRDS set-up. This work was funded by the “Agence nationale pour la gestion des déchets radioactifs” (ANDRA).
References :
[1] : Synthesis report, National inventory of radioactive materials and waste, report number : 467VA, 2012, www.andra.fr/.
[2] : G. Berden and R. Engeln. Cavity Ring-Down Spectroscopy, Techniques and Applications. Hoboken, NJ, USA: Wiley, 2009.
[3] : P. Helminger, F.C. De Lucia, W. Gordy, P.A. Staats, H.W. Morgan, Phys. Rev. A 10 (1974) 1072.
[4] : S.D. Cope, D.K. Russell, H.A. Fry, L.H. Jones, J.E. Barefield, J. Mol. Spectrosc. 127 (1988) 464. [5] : P.P. Cherrier, P.H. Beckwith, J.J. Reid, Mol. Spectrosc. 103 (1984) 41.
[6] : G. Fayt, P.H. Steenbeckeliers, A. Kastler, Proc. Acad. Sci. Paris. Ser. B 275 (1972) 459. [7] O. N. Ulenikov. V.N. Cherepanov, A.B. Malikova, J. Mol. Spectrosc. 146 (1991) 97.
[8] : M.J. Down, J. Tennyson, H. Masanori, Y. Hatano, K. Kobayashi, J. Mol. Spectrosc. 289 (2013) 35.
[9] : K. Kobayashi, T. Enokida , D. Iio, Y. Yamada, M. Hara, Y. Hatano, Fusion Sci. Technol. 60 (2011) 941.
[10] http://spectra.iao.ru/
[11] : H. Partridge and D.W. Schwenke, J. Chem. Phys. 106 (1997) 4618. [12] : D.W. Schwenke and H. Partridge, J. Chem. Phys. 113 (2000) 6592. [13] : D.W. Schwenke, J. Phys. Chem. 100 (1996) 2867.
[14] : L.S. Rothman, I.E. Gordon, Y. Babikov, A. Barbe, D. Chris Benner, P.F. Bernath, M. Birk, L. Bizzocchi, V. Boudon, L.R. Brown, A. Campargue, K. Chance, L. Coudert, M.V. Devi, B.J. Drouin, A. Fayt, J-M. Flaud, R.R. Gamache, J. Harrison, J-M. Hartmann, C. Hill, J.T. Hodges, D. Jacquemart, A. Jolly, J. Lamouroux, R.J. LeRoy, G. Li, D. Long, C.J. Mackie, S.T. Massie, S. Mikhailenko, H.S.P. Müller, O.V. Naumenko, A.V. Nikitin, J. Orphal, V. Perevalov, A. Perrin, E.R. Polovtseva, C. Richard, M.A.H. Smith, E. Starikova, K. Sung, S. Tashkun, J. Tennyson, G.C. Toon, Vl.G. Tyuterev , J. Vander Auwera, G. Wagner, J. Quant. Spectrosc. Radiat. Transfer. 130 (2013) 4.
[15] Y. Tang, S.L. Yang, K.K. Lehmann, Rev. Sci. Instrum. 83 (2012) 043115. [16] : P. Werle, R. Mücke, F. Slerm, Appl. Phys. B. 57 (1993) 131.
Table 1 :
Name of the water standards, isotope composition and experimental condition for the spectra recorded in this work.
Standard name Composition Temperature in K Pressure in mbar
distilled water H216O : 99.73%, H218O : 0.20%, H217O : 0.037%, HDO : 0.031% 256±1 25.02±1.2 H218O enriched standard H216O : 2%, H218O : 97.1%, H217O : 0.9% 296±1 26.21±1.3 HDO enriched standard H2O : 85%, HDO : 15% 296±1 26.94±1.3 Perkin Elmer 340±4 MBq/g tritiated water standard H216O : 99.73%, H218O : 0.20%, H217O : 0.037%, HDO : 0.031%, HTO : 5.4 10-6 297±1 28.35±1.4 LNE 72±0.21 MBq/g triated water standard
H216O : 99.73%, H218O : 0.20%,
H217O : 0.037%, HDO : 0.031%,
HTO : 1.14 10-6
Table 2 :
Spectroscopic parameters of HTO transitions between 4592 and 4598 cm-1. First column reports the transitions assignement. “Upper” stands for upper state of the transition, “band” for the vibrational band of the transition, and “Lower” for the lower state of the transition. Second column represents the experimental positions of the transitions given in cm-1. Third column represents the theoretical positions of the transitions given in cm-1 from Schwenke/Partridge database [10]. Experimental (S) and theoretical (St) intensities are given
in cm-1/(molecule.cm-2) at 296K. γ represents the self-broadening coefficients in cm-1/atm.
Assignment Position a Position (theoretical)
S b St γ c
Upper Band Lower
5 1 4 2v1 4 1 3 4592.407 4592.475 9.83 10-22* 1.159 10-21 0.41 6 1 6 2v1 5 1 5 4594.658 4594.731 8.72 10-22 1.191 10-21 0.43 6 4 3 2v1 5 4 2 4596.083 4596.211 2.38 10-22 1.851 10-22 0.29 6 4 3 2v1 5 4 1 4596.216 1.851 10-22 6 0 6 2v1 5 0 5 4596.485 4596.550 8.28 10-22 1.253 10-21 0.40 6 3 4 2v1 5 3 3 4597.552 4597.649 3.46 10-22 4.403 10-22 0.39 6 3 3 2v1 5 3 2 4597.750 4597.848 2.77 10-22 4.398 10-22 0.31 6 2 5 2v1 5 2 4 4597.824 4597.927 4.50 10-22* 7.896 10-22 0.28 a
Line positions are estimated to be accurate to 0.001 cm-1.
b Absolute linestrengths are estimated to be accurate to 15%,
c Self-broadening coefficients are estimated to be accurate to 30%
* Small transition from impurities downgrades the accuracy of the measurement (20% for intensities and 35% for self-broadening coefficients).
Figure 1: Rotation-vibration transitions of water isotopologues, in the 0 and 10 000 cm-1 spectral region; H216O, H217O, H218O (blue), HDO (green) and HTO (red). All these
Figure 2: theoretical absorption spectra of 10 mbar pressure water stable isotopes H216O,
H217O, H218 and HDO (blue), with natural isotopy. The red line is the absorption spectra of
10-6 molar fraction of HTO [10].
4590 4592 4594 4596 4598 4600 0.00E+000 5.00E-009 1.00E-008 1.50E-008 2.00E-008 2.50E-008 3.00E-008 Absor ptio n co eff icients (1 0 -6 cm -1 ) Wavenumber (cm-1)
Figure 3 :
CRDS experimental set-up for HTO measurement. The infrared laser beam is the red continuous line and the red dotted line is the red alignment laser beam. AOM stands for acousto-optical modulator, “RM” for removable mirror, “HM” for high reflectivity mirror, “PT” for piezoelectric transducer, “IF” for interferential filter, “L” for lens.
collimator
diode laser with optical isolator AOM
InGas photo-diode with current amplifier
voltage amplifier
Analog I/O board
Piezo modulation Pressure Gauge Septum for injection Gaz outlet
Red diode laser
HM on PT HM
IF
RM L
17
Figure 4 :
Experimental (black dotted line) and theoretical (continuous red line) absorption spectra of a) distilled water, b) H218O enriched standard and c) HDO enriched standard (table 1). The
theoretical spectra of H216O, H217O and H218 are calculated using the HITRAN database
[Hit12], whereas the HDO and HTO spectra are calculated with the Spectra database [10].
4592 4593 4594 4595 4596 4597 4598 0,0 0,1 0,2 0,3 0,4 0,5 0,6 0,7 0,8 0,9 1,0 Wavenumber (cm-1) Absor ptio n co eff icients (1 0 -6 cm -1 ) 4592 4593 4594 4595 4596 4597 4598 0,0 0,1 0,2 0,3 0,4 0,5 0,6 0,7 0,8 0,9 1,0 Absor ptio n co eff icients (1 0 -6 cm -1 ) Wavenumber (cm-1) a) b)
18 4592 4593 4594 4595 4596 4597 4598 0,0 0,1 0,2 0,3 0,4 0,5 0,6 0,7 0,8 0,9 1,0 Absor ptio n co eff icients (1 0 -6 cm -1 ) Wavenumber (cm-1) c)
19
Figure 5 :
Experimental (red dotted line) absorption spectra of the HTO enriched standard, with the theoretical (red continuous line) absorption spectra of HTO lines [10], and with the experimental (black dotted line) absorption spectra of distilled water.
4595.9 4596.0 4596.1 4596.2 4596.3 4596.4 4596.5 4596.6 -0.02 0.00 0.02 0.04 0.06 0.08 0.10 0.12 0.14 Abs orption c oeffi c ients ( 10 -6 c m -1 ) Wavenumber (cm-1) 4597.5 4597.6 4597.7 4597.8 4597.9 4598.0 0.00 0.02 0.04 0.06 0.08 0.10 Absor ptio n co eff icients (1 0 -6 cm -1 ) Wavenumber (cm-1)
20
Figure 6 :
Theoretical fit (red line) and residue (below) of 4 experimental (black dotted line) rotation-vibration transitions, measured with the Perkin Elmer HTO standard and a water vapor pressure of 28.35 mbar inside the CRDS cell. The 4596.083 and 4596.485 cm-1 transitions are two HTO transitions, the 4596.150 cm-1 line belongs to H216O. Impurity lines rise around
4596.178 cm-1 and 4596.35 cm-1. 4596.0 4596.1 4596.2 4596.3 4596.4 4596.5 4596.6 -0.02 0.00 0.02 0.00 0.02 0.04 0.06 0.08 0.10 Wavenumber (cm-1) obs - c alc 10 -6 cm -1 Abs orption c oeffi c ients ( 10 -6 c m -1 )
21
Figure 7:
Experimental absorption spectra of 3 water samples: the Perkin Elmer tritiated water standard, 340 MBq/g (red dotted line), the LNE tritiated water standard, 72.21 MBq/g (blue doted line), and distilled water (black dotted line). An impurity line shows at 4596.54 cm-1 on the distilled water spectrum. 4596.35 4596.40 4596.45 4596.50 4596.55 4596.60 0.00 0.02 0.04 0.06 0.08 0.10 Absor ptio n co eff icients (1 0 -6 cm -1 ) Wavenumber (cm-1)
22
Figure 8 :
Allan plot or the evaluation of the optimal ring down averaging using the present CRDS set-up. 1 10 100 1000 10000 1E-11 1E-10 1E-9 Stand ar d a llan d eviat ion (cm -1 ) Average Number