HAL Id: cea-01854072
https://hal-cea.archives-ouvertes.fr/cea-01854072v2
Submitted on 14 Dec 2018
HAL is a multi-disciplinary open access
archive for the deposit and dissemination of
sci-entific research documents, whether they are
pub-lished or not. The documents may come from
teaching and research institutions in France or
abroad, or from public or private research centers.
L’archive ouverte pluridisciplinaire HAL, est
destinée au dépôt et à la diffusion de documents
scientifiques de niveau recherche, publiés ou non,
émanant des établissements d’enseignement et de
recherche français ou étrangers, des laboratoires
publics ou privés.
NumaMMA: NUMA MeMory Analyzer
François Trahay, Manuel Selva, Lionel Morel, Kevin Marquet
To cite this version:
François Trahay, Manuel Selva, Lionel Morel, Kevin Marquet. NumaMMA: NUMA MeMory Analyzer.
ICPP 2018 - 47th International Conference on Parallel Processing, Aug 2018, Eugene, United States.
pp.1-10, �10.1145/3225058.3225094�. �cea-01854072v2�
NumaMMA: NUMA MeMory Analyzer
François Trahay
SAMOVAR, CNRS, Télécom SudParis, Université Paris-Saclay
Evry, France
Manuel Selva
Univ. Grenoble Alpes, CNRS, Inria, Grenoble INP, LIG Grenoble, France
Lionel Morel
Univ Grenoble Alpes, CEA, List Grenoble, France [email protected]
Kevin Marquet
Univ Lyon,INSA Lyon, Inria, CITI Villeurbanne, France [email protected]
ABSTRACT
Non Uniform Memory Access (NUMA) architectures are nowa-days common for running High-Performance Computing (HPC) applications. In such architectures, several distinct physical memories are assembled to create a single shared memory. Nevertheless, because there are several physical memories, access times to these memories are not uniform depending on the location of the core performing the memory request and on the location of the target memory. Hence, threads and data placement are crucial to efficiently exploit such architectures. To help in taking decision about this placement, profiling tools are needed. In this work, we propose NUMA MeMory Ana-lyzer (NumaMMA), a new profiling tool for understanding the memory access patterns of HPC applications. NumaMMA combines efficient collection of memory traces using hardware mechanisms with original visualization means allowing to see how memory access patterns evolve over time. The informa-tion reported by NumaMMA allows to understand the nature of these access patterns inside each object allocated by the ap-plication. We show how NumaMMA can help understanding the memory patterns of several HPC applications in order to optimize them and get speedups up to 28% over the standard non optimized version.
CCS CONCEPTS
• General and reference → Performance; • Software and its
engineering → Software performance;
KEYWORDS
Performance analysis, NUMA architectures, Data and threads placement, Memory sampling
1
INTRODUCTION
Because symmetric memory architectures do not scale up with the number of cores, modern multicore architectures have non-uniform memory access (NUMA) properties: a given core ac-cesses some memory banks faster than other banks. Typically, one finds two levels of addressable memory: one core may access a local memory really fast, or access a remote memory via an interconnect at some extra cost in time. A set of cores together with its local memory is named a NUMA node.
From the programs’ perspective, this type of hardware re-quires to decide the locality of data and threads. Clearly, as many memory accesses as possible should be local to decrease there latency. But applications may comprise a large num-ber of threads and many data dependencies between these threads. This is particularly true for High-Performance Com-puting (HPC) applications. It is then often not possible to avoid remote memory accesses when threads are sharing data as it would be highly inefficient to execute all threads on the same core, or even on cores on the same NUMA node.
As the number of threads and the amount of shared data increase, deciding the placement of data and threads also re-quires to take into account contentions that may appear on shared resources. When such contentions occur, it has been shown that interleaving memory pages on all the NUMA nodes is an efficient solution [16].
Recent results also show that NUMA architectures are asym-metric [21]: accesses from a core on a node A to a bank on node B may have performances completely different from accesses from a core on node B to a bank on node A. Moreover, the doc-umentation of processors actually lacks details about this kind of characteristics and the programmer is thus left with trying out different combinations and infer system-level performance characteristics for application.
NUMA architectures are very complex indeed and they dif-fer very much from one another. They have difdif-ferent numbers of nodes, different memory latencies, bandwidths and sizes, different symmetry models. As programmers are not likely to know those architectural details, we cannot expect them to port applications from one architecture to another and take the full benefits of the new architecture in terms of performance. On the other hand, hardware platforms are generic and cannot be expected to take specific applications needs into account. Hence, tools should be provided to help the programmer de-cide the locality of data and threads.
In the context of HPC, most applications have similar mem-ory access patterns from one execution to another. Thus, by analyzing the memory access pattern of an application, a de-veloper can figure out how data and threads should be placed on a given NUMA system in order to maximize local memory access and to reduce the memory contention on the NUMA
nodes. Determining the memory access pattern of an applica-tion can be done by analyzing its source code. However, this task may be tedious for large applications, and it is hard to grasp the impact of each memory object on the performance: some objects are rarely accessed and improving their locality is worthless, while some objects are accessed often and their placement have a significant impact on the overall performance of an application. Thus, memory profiling tools are needed to help understanding these pattern, and to guide the decision of locality of data and threads.
In this paper, we propose NUMA MeMory Analyzer (Nu-maMMA), a tool allowing to understand in details the memory access patterns of an application. NumaMMA first uses hard-ware capabilities to gather a memory trace. This trace is then processed offline in order to assess the cost of memory accesses to every object of the application and to know how threads access different parts of these objects. Understanding memory access patterns inside objects is crucial in the context of HPC applications because they often only access to few very large objects a huge number of time. We then make the following contributions:
• we propose an open-source tool1
able to report how memory access patterns inside objects evolve over time;
• we combine this reporting with an efficient trace collec-tion mechanism based on hardware sampling;
• we provide developers with original visualization means of these memory access patterns;
• we show that this information can be used for defining a placement strategy that improves the performance of applications by up to 28%.
The remainder of the paper is organized as follows. Section 2 details related work. Section 3 then explains the contributions we make. Section 4 evaluates experimentally NumaMMA. Sec-tion 5 concludes and gives perspectives on this work.
2
RELATED WORK
With the increasing number and complexity of NUMA ma-chines, the placement of thread and data in these machines has gained strong focus in the last decades. When targeting NUMA machines, threads and data placement must first limit the number of remote memory accesses. Second, it must en-sure there is no contention on shared resources such as the interconnect network allowing any core to access any memory bank. Threads and data placement is generally handled either explicitly by the programmer at the application level or auto-matically at runtime by the operating system potentially with help from the compiler. To help the programmer understand the memory access patterns of applications and then optimize them, many profiling tools have been proposed.
We now quickly review runtime approaches before present-ing in details existpresent-ing NUMA profilpresent-ing tools. For a complete survey of solutions that have been proposed for the threads and data placement problem, the reader should refer to the recent work of Diener et al. [14].
1https://github.com/numamma/numamma
2.1
Runtime Placement
Runtime mechanisms for placing threads and data are required in contexts where applications are not known. In this case, the operating system [3, 9, 11, 12, 15, 18], or the runtime system between the operating system and applications [7, 8], is re-sponsible for deciding where to allocate data in memory and on which core to execute which thread.
General purpose operating systems provides two main global policies regarding memory allocation. By default, Linux allo-cates all the memory pages of an application in the NUMA node where the first thread accessing it is running. This is the first-touch policy. Linux also offers the interleaved policy, where all the pages of an application are allocated in a round-robin fashion among all NUMA nodes. While being effective in some situations, these two global policies are not efficient at all for applications having complex memory access patterns. In particular, the memory access patterns of an application may not be the same for different objects and thus a global policy cannot be efficient. Also, these memory access patterns may evolve over time. As a result, the placement of a memory page may become misfit. The Solaris operating system offers the next-touch policy [3] that takes a memory page already allocated and migrates it in order to improve its locality with the thread that uses it. Integration of this next-touch policy into the Linux kernel has also been proposed [18, 20]. Start-ing from version 3.8 released in 2013, the Linux kernel also provides NUMA memory balancing [1]. This feature relies on periodically unmapping pages and later trapping a page fault to detect which thread access which memory.
Solutions have been proposed to improve the basic policies provided by standard operating systems. Several of the pro-posed solutions rely on hardware performance counters [8, 11, 15], or on custom hardware extensions [9] that are used to sample memory accesses. This sampling provides an insight about memory access patterns of the application. Based on this profiling information, pages and threads are then moved to increase memory locality and to avoid contention on the interconnect. Other solutions rely on the compiler providing information that can be used to infer memory access patterns before deciding where the data should be allocated [12]. Fi-nally, some solutions rely on the knowledge of the affinity between OpenMP threads to improve the locality of threads and data: the threads that belong to the same OpenMP team are likely to access the same memory regions, and grouping them improves the locality [7].
All these solutions rely on runtime heuristics. The quantity of information that can be processed is thus limited so as to limit the overhead on the application’s performance. This is a major difference with our approach where profiling is per-formed offline: we can build much more precise performance metrics that can be used to take better placement decisions.
2.2
Offline Placement
Over the years, many works have focused on collecting mem-ory traces in order to analyze them offline. These solutions differ in the way they collect memory access information, in
the way they process this information and in the way they use it ultimately.
2.2.1 Collecting Memory Traces. Multiple solutions have been proposed for collecting memory traces. Memory accesses can be captured by simulating the execution of an applica-tion [10]. However, the simulating time is prohibitive, which prevents from using this approach on most applications.
Another solution consists in instrumenting the application binary with tools like Pin [24] so that each instruction that reads or writes data is recorded [5, 13, 28, 30]. While the over-head caused by the instrumentation is reduced compared to the simulation approach, it still causes the application to run up to 20 times slower than the non-instrumented version. This prevents from using this solution on large applications.
A third approach is to leverage the memory sampling ca-pabilities provided by the hardware. Modern processors im-plement hardware-based monitoring systems (such as Intel PEBS, or AMD IBS) that periodically save information about the instruction being executed. This mechanism can be used for collecting the memory addresses that are accessed [17, 19, 22, 23, 25–27, 31]. Since only some of the instructions are col-lected, this approach is less precise than instrumentation but more efficient. Also, the collection of a single sample is more efficient than instrumentation because it is done by the hard-ware. Collecting a sample with Intel PEBS only requires 200 to 300 nanoseconds [2]. The impact on the application perfor-mance is thus small. This approach is thus applicable on large applications. Also, compared to the approach based on binary instrumentation, hardware-based sampling allows to record the the level in the memory hierarchy (L1, L2, ...) that served an access along with the latency of the access.
2.2.2 Existing Tools for Thread and Data Placement. Mo-lina da Cruz et al. propose an automatic placement tool [10]. This tool relies on simulation to trace all memory accesses. It then builds a complete graph representing the amount of communication between threads. A partitioning algorithm is then applied on the graph to know which threads should be put close together.
Song et al. proposed an automatic solution, for thread place-ment only, using binary instruplace-mentation to collect traces [30]. Their solution also builds a graph representing the amount of communication between threads. It then applies a partitioning algorithm on this graph to decide where threads should be placed. Numalize [13] also relies on binary instrumentation to perform automatic threads and data placement. For threads placement, Numalize uses a graph representing the amount of communication between threads. Partitioning is done us-ing that graph. For data placement, Numalize computes high level metrics at application level. Compared to other solutions, Numalize is the only one taking the time dimension into ac-count. Said differently, Numalize computes threads and data placement for different execution phases of the application. Tabarnac [5] is another tool relying on binary instrumentation. Tabarnac offers visual representations allowing to inspect how threads access internal pages of large objects. These represen-tations are global to the entire execution of the application,
they do not include time information. RTHMS [28] uses bi-nary instrumentation for collecting memory access patterns on objects on a machine whose memory is heterogeneous such as the Intel Knight Landing architecture. In such machines, objects are either allocated on the fast but small memory, or on the slow but large memory. RTHMS then analyzes the col-lected data in order to decide where to allocate the objects, based on their expected impact on performance computed from the number of accesses, the life span and the read/write frequency.
Because simulation and binary instrumentation have a huge impact on performance, many tools have been proposed that rely on hardware sampling mechanisms [17, 19, 22, 23, 25– 27, 31]. The work by Marathe et al. [25, 26], targeting Intel Itanium architectures, proposes an automatic page placement that allocates pages on the NUMA node where they are most used or on the node that will minimize the total cost of all its accesses. Memphis [27] and MemProf [19], both targeting AMD processors, provide NUMA related information to the programmer in a data-centric view, that is using objects of the application. For each object in the application, they re-port the total number and costs of remote memory accesses. No information about the distribution of accesses inside an object is reported. MemAxes [17], one of the most advanced visualization tool for pinpointing NUMA effects, focuses on providing information related to the application along with standard metrics on memory accesses. This is done with the help of the programmer who must instrument her application to give information to the tool. Also, similarly to Memphis and MemProf, MemAxes does not provide any visual information about the dsitribution of accesses inside large objects. Finally, HPCToolkit [22, 23] also reports information about NUMA effects over the application. Its main contributions are global metrics allowing to identify whether or not changing the data placement could lead to performance benefits along with a data-centric reporting of memory accesses. HPCToolkit also reports some information about memory accesses inside large objects. Nevertheless, this information only contains the mini-mum and maximini-mum addresses inside the object accessed by each thread.
3
NUMAMMA
In this section, we present NumaMMA, a memory profiler that captures the memory access pattern of threads on objects in memory. The approach consists in executing an application offline, retrieving useful information about memory accesses, and providing this information to the application developer. She can then use this information to optimize the placement of threads and data.
During the profiled execution of the application, NumaMMA collects information on the dynamic allocations as well as on global variables. NumaMMA uses the sampling features provided by the hardware to collect samples of the memory accesses performed by the application threads. Relying on hardware memory sampling allows to capture the application behavior without prohibitive overhead.
After the execution of the application, NumaMMA searches for the memory object accessed by each collected sample and computes statistics on each object. Once all the samples are pro-cessed, NumaMMA reports statistics on the memory objects most accessed by the application. These statistics can be used by the application developer in order to tune the placement of the threads and data.
In this section, we first describe how memory access sam-ples are gathered. Second, we describe how information on memory objects is collected. Then, we describe how samples are matched with memory objects and which statistics are computed. Finally, we describe how NumaMMA reports infor-mation about memory accesses to the user.
3.1
Collecting Samples
Modern processors implement sampling mechanisms able to collect information on executed instructions with a low overhead. Intel provides Precise Event-Based Sampling (PEBS) while AMD provides Instruction Based Sampling (IBS). When sampling, the CPU periodically records information on the instruction that is being executed in a dedicated memory lo-cation and notifies the software through an interrupt. With PEBS, it is possible to configure the hardware to only sample memory reads and/or memory writes. To limit the overhead of the sampling, it is also possible with PEBS to collect several samples before notifying the software.
During the profiled execution of the application, NumaMMA uses numap [29] for collecting memory samples. Note that numap currently only supports Intel PEBS, but it could be ex-tended to other sampling mechanisms such as AMD IBS. Also note that Intel micro architectures prior to Sandy Bridge (2011) only support the sampling of read accesses. The precision of the information gathered through sampling will thus depend on the profiling capabilities offered by the hardware platform used. Each memory sample is composed of:
• the type of the access, that is read or write; • the identifier of the thread that executes the access; • the time at which the sample has been taken;
• the address accessed by the instruction;
• which part of the memory hierarchy was accessed, that is L1/L2/L3 cache or local memory or memory located on a remote NUMA node;
• the cost of the memory access, that is the latency.
numap records samples in a dedicated memory buffer. When this buffer is full, the recording of samples is stopped. Thus, NumaMMA needs to collect and flush the sample buffer reg-ularly so as not to lose samples. To that end, when the appli-cation calls an alloappli-cation function (such as malloc or free), NumaMMA stops recording samples, copies the collected sam-ples to an other location that will be analyzed post-mortem, and resumes recording samples. However, samples may still be lost if the application does not call allocation functions regularly. To mitigate the loss of samples, NumaMMA can also set an alarm to periodically collect samples. The usage and impact of this parameter is discussed in Section 4.
3.2
Identifying Memory Objects
In order to find the memory object accessed by a sample, Nu-maMMA collects information on dynamic allocations as well as on static objects, that is global variables. For each memory object, NumaMMA stores the base address of the object and its size, the allocation timestamp, and the de-allocation times-tamp. Memory objects are stored in a binary tree ordered by the object address.
Dynamic allocations are tracked by overloading the main memory allocation functions: malloc(), realloc(), calloc and free(). When the application allocates an object, Nu-maMMA intercepts the function call using the LD_PRELOAD mechanism, and stores information on the allocated objects. For dynamic objects, NumaMMA also collects information on the allocation call sites, that is the function and the line at which the object was allocated.
NumaMMA collects information on static objects at the application start up. It reads the list of symbols in the ELF file, and searches for global variables and the corresponding size and offset. NumaMMA then determines at which address the ELF file is loaded in order to compute the address of the variable in the current address space. This computing step is required for code compiled in a position independent way.
3.3
Processing Samples
After the execution of the application, the collected samples are processed in order to identify the memory object corre-sponding to each sample. To do so, NumaMMA browses the binary tree that contains the memory objects and searches for an object whose address range includes the address reported in the sample.
Because of the dynamic allocation, several memory objects may match an address. This happens when the application al-locates with malloc an object o1, free it, and allocates another object o2. In this case, malloc may allocate o2at the same address addr as o1. Thus, when searching for the object that corresponds to address addr, NumaMMA will identify both o1
and o2. Thus, NumaMMA also compares the timestamp of the sample with the allocation and free dates for o1and o2. Also, this implies that nodes of the binary tree recording memory objects are lists of objects (all allocated at the same address) and not a single object.
Once the memory object that matches a sample is identified, NumaMMA updates the following counters associated to the object:
• the number of read/write accesses;
• the number of read/write accesses to/from a remote NUMA node;
• the total read/write accesses cost.
These counters are computed both globally and in a per-thread basis. Since multiple threads may access different portions of a single object, and we are particularly interested in understand-ing how, NumaMMA also computes these counters for each memory page, 4 KiB by default or 2 MiB when using huge pages.
3.4
Reporting Memory Access Information
After all the samples are processed, NumaMMA outputs sev-eral results. All the outputs of NumaMMA can be either global, that is including read and write accesses, or specific to read or to write accesses. First, NumaMMA prints the list of memory objects along with their accumulated counters. By default, the list is sorted by the total number of accesses, but this can be changed to sort by the total memory cost. Also, NumaMMA groups in this list the objects that have been allocated at the same call site. There counters are summed and they are re-ported as a single object. This choice is motivated by the fact that changing the allocation at the callsite line will change the placement of all the objects allocated at this callsite. This list of objects provides application developers with useful in-formation on which objects are the most likely to affect the performance of the application.
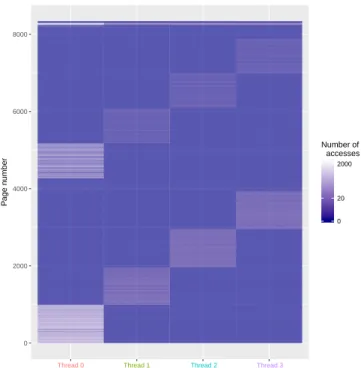
For each object, NumaMMA textually reports the number of detected memory accesses per page and per thread. This information can also be reported in a graphical way using a communication matrix, as shown in Figure 1. This matrix shows which thread accesses to which memory page. The color indicates the number of accesses. In this example, thread #0 mainly accesses pages from 0 to 1000 and from 4200 to 5100, while thread #1 mostly access pages 1000 to 1800 and from 5100 to 6000. From this graph it is clear that threads only access specific sub-parts of the main_flt_mem object. Using this information, we may decide to place the threads that work on the same memory pages on the same NUMA node. Memory pages could also be bound to NUMA nodes according to the thread access pattern.
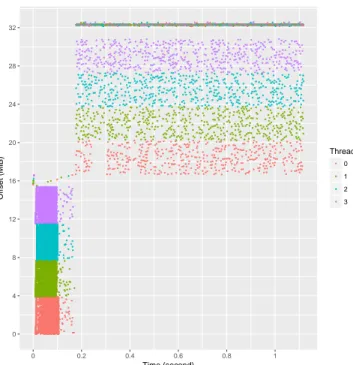
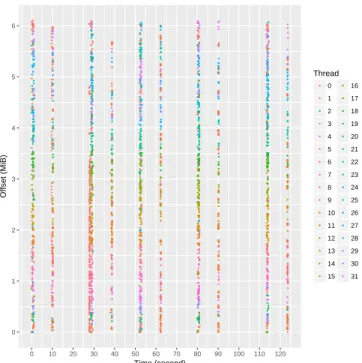
NumaMMA also textually reports, for each object, the list of samples that were matched with the object. This provides more detailed information on an object, including the time dimension. Figure 2 shows how NumaMMA can report this information graphically. This plot shows the memory accesses of the threads during the execution of the application. The horizontal axis represents the time and the vertical one repre-sents the offset in the memory object. Each point corresponds to a single memory access sample, and the color represents the thread accessing the object. By adding a temporal dimen-sion, this view completes the information provided by the one shown in Figure 1. We clearly see that the two different sub-parts of the main_flt_mem object accessed by each thread are accessed in different stages of the application. If for any reason, the upper part of the data is allocated on a different NUMA node that the lower part, then we can use the timing information to migrate the four threads on the node where the upper part is just before starting the second execution stage.
4
EVALUATION
In this section, we evaluate and show how NumaMMA can help understanding memory access patterns to improve per-formance. We demonstrate this on applications from the NAS Parallel Benchmarks and on Streamcluster from PARSEC. We used two NUMA machines:
0 2000 4000 6000 8000
Thread 0 Thread 1 Thread 2 Thread 3
P age n umber 0 20 2000 Number of accesses
Figure 1: Number of, per thread, memory accesses to the pages of the main_flt_mem object in NPB CG, class A, 4 threads. Threads access different sub-parts of the object.
• Intel32 has 2 Intel Xeon E5-2630 v3 processors with 8
cores/16 threads in each (total: 16 cores/32 threads), running at 2.4GHz. The machine is equipped with 2 NUMA nodes connected through QPI and 32GB of RAM. It runs Linux 4.11, glibc version 2.24, and GCC 6.3;
• Amd48 has 4 AMD Opteron 6174 processors with 12 cores in each (total: 48 cores) running at 2.2GHz. The machine is equipped with 8 NUMA nodes (2 nodes per processor) connected through HyperTransport 3.0, and 128GB of RAM. It runs Linux 4.10, glibc version 2.25, and GCC 6.3.
The applications were compiled with the -O3 flag and were not stripped so that NumaMMA can find the list of global variables in the application. The NAS Parallel Benchmarks use the GNU OpenMP shipped with GCC 6.3. Streamcluster was compiled with the -g flag so that NumaMMA can identify the file and line of each memory object using the debugging information.
4.1
NAS Parallel Benchmarks
The NAS Parallel Benchmarks (NPB) [4] is a suite of HPC kernels. We run the OpenMP implementation of NPB 3.3, class C, on the Intel32 machine.
4.1.1 NumaMMA Overhead. We first run NPB kernels with and without NumaMMA in order to assess the overhead of NumaMMA. The NAS kernels are executed with 32 threads