HAL Id: hal-02292093
https://hal.archives-ouvertes.fr/hal-02292093
Submitted on 20 Sep 2019HAL is a multi-disciplinary open access
archive for the deposit and dissemination of sci-entific research documents, whether they are pub-lished or not. The documents may come from teaching and research institutions in France or abroad, or from public or private research centers.
L’archive ouverte pluridisciplinaire HAL, est destinée au dépôt et à la diffusion de documents scientifiques de niveau recherche, publiés ou non, émanant des établissements d’enseignement et de recherche français ou étrangers, des laboratoires publics ou privés.
Enhancement of a dynamic porous model considering
compression-release hysteresis behavior: Application to
graphite
Benjamin Jodar, Gabriel Seisson, David Hébert, Isabelle Bertron, Michel
Boustié, Laurent Berthe
To cite this version:
Benjamin Jodar, Gabriel Seisson, David Hébert, Isabelle Bertron, Michel Boustié, et al.. Enhance-ment of a dynamic porous model considering compression-release hysteresis behavior: Application to graphite. Journal of Physics D: Applied Physics, IOP Publishing, 2016, 49 (32), pp.Article number 325301. �10.1088/0022-3727/49/32/325301�. �hal-02292093�
Science Arts & Métiers (SAM)
is an open access repository that collects the work of Arts et Métiers ParisTech researchers and makes it freely available over the web where possible.
This is an author-deposited version published in: https://sam.ensam.eu Handle ID: .http://hdl.handle.net/10985/16790
To cite this version :
Benjamin JODAR, Gabriel SEISSON, David HÉBERT, Isabelle BERTRON, Michel BOUSTIE, Laurent BERTHE - Enhancement of a dynamic porous model considering compression-release hysteresis behavior: Application to graphite - Journal of Physics D: Applied Physics - Vol. Volume 49, Issue 32, p.Article number 325301 - 2016
Any correspondence concerning this service should be sent to the repository Administrator : archiveouverte@ensam.eu
1. Introduction
The shock wave attenuation capability of foams and porous materials is one of the main research topics in preventing damage caused by the propagation of shock waves. The mech anisms responsible for the shock wave attenuation in such materials are not yet completely understood nor described. For instance, a porous graphite similar to those used in the aerospace industry as a constitutive element of C/C composite materials, revealed no residual compaction after static confined compression (see figure 1 and [1]). In biomedical engineering, polyurethane (PU) foams, used as a specimen to understand shock interaction with complex media, showed a similar behavior during uniaxialstrain experiments (see figure 1(b) and [2]). This particular behavior is also expected during shock wave propagation. The concern of this paper is to pave the way
for developing a numerical model able to correctly reproduce such complex mechanisms under shockandrelease loading.
To describe the dynamic behavior of porous materials, sev eral numerical models have been developed during the last decades. Among them, the simplest one is the 1D model of Thouvenin [3]. It can be called a geometric model since it consists in describing a porous material as an assembly of parallel slabs of dense matter. The ratio between the slab thickness and the empty spaces between them is related to the macroscopic density of the material. It originally gave good results for sustained shocks onto porous metals but was also tested for laserinduced shocks onto aluminum [4] and porous graphite [5]. Nevertheless, its validity is limited to a range of pressures where compaction is complete and where materials do not undergo phase transition since it assumes the symmetry of the Hugoniot and the release isentrope.
Enhancement of a dynamic porous model
considering compression-release hysteresis
behavior: application to graphite
B Jodar1, G Seisson2, D Hébert1, I Bertron1, M Boustie3 and L Berthe4
1 CEA CESTA, 15 avenue des Sablières CS60001, 33116 Le Barp Cedex, France 2 CEA DIF, BruyèresleChâtel, 91297 Arpajon Cedex, France
3 Institut P’ UPR3346 CNRSENSMAUniversité de Poitiers, 1 avenue Clément Ader,
86961 Futuroscope Cedex, France
4 Laboratoire PIMM UPR8006 CNRSArts et Métiers ParisTech, 151 boulevard de l’Hôpital,
75013 Paris, France
Email: gabriel.seisson@cea.fr (G. Seisson)
Abstract
Because of their shock wave attenuation properties, porous materials and foams are increasingly used for various applications such as graphite in the aerospace industry and polyurethane (PU) foams in biomedical engineering. For these two materials, the absence of residual compaction after compression and release cycles limits the efficiency of the usual numerical dynamic porous models such as Pα and POREQST. In this paper, we suggest a simple enhancement of the latter in order to take into account the compressionrelease hysteresis behavior experimentally observed for the considered materials. The new model, named HPOREQST, was implemented into a Lagrangian hydrocode and tested for simulating plate impact experiments at moderate pressure onto a commercial grade of porous graphite (EDM3). It proved to be in far better agreement with experimental data than the original model which encourages us to pursue numerical tests and developments.
Keywords: POREQST, Pα, carbon, foam, constitutive relation (Some figures may appear in colour only in the online journal) B Jodar et al
Enhancement of a dynamic porous model considering compression-release hysteresis behavior: application to graphite
Printed in the UK 325301 JPAPBE © 2016 IOP Publishing Ltd 2016 49
J. Phys. D: Appl. Phys.
JPD
0022-3727
10.1088/0022-3727/49/32/325301
Paper
32
Journal of Physics D: Applied Physics IOP
Conversely, nongeometric models such as those expressed by Zel’dovich and Raizer [6], McQueen et al [7] and Charakhch’yan [8–10] allow 2D and 3D computations. They suppose an almost instantaneous density transition between the initial porous state and the solid state. Hence, they have the property to correctly deal with highpressure phase trans itions but cannot properly manage lowpressure ranges where compaction is uncomplete.
The Pα model, firstly introduced by Herrmann [11], is certainly the most known and used porous model in the litera ture. It is also able to deal with phase transition and palliates the lacuna of the models of Thouvenin, Zel’dovich, McQueen and Charakhch’yan when compaction is uncomplete. It uses a plastic compaction curve that manages the gap between the initial porous state to the dense one. The totally compacted material is modeled by the original dense equation of state (EOS). After a partial compaction, the return to a zero pres sure state is performed following elastic surfaces. Several developments of this model were then proposed, e.g. [12, 13], but none of them accounted for a potential hysteresis behavior.
The POREQST model expressed by Seaman et al [14] is based on fundamentals similar to Pα but the compac tion curve is easier to fit on experimental data. Moreover, the elastic surfaces are defined by a Mie–Grüneisen EOS that allows computing time to be saved since the porosity is ana lytically calculated instead of with an algorithm like for Pα. It is also able to deal with negative pressures introducing a pore reopening curve and all of its parameters have a physical meaning, most of them being obtainable at the first order by quasistatic tests. Extensive investigations have already been conducted by the present authors [1, 5, 15–17] on this model in order to shape a set of parameters adapted to the commer cial grade of porous graphite evoked in figure 1. Therefore POREQST has been chosen for being enhanced in order to reproduce a compressionrelease hysteresis behavior.
The next section recalls the main features of the original POREQST model before proposing a substantial modification for the representation of the compressionrelease hysteresis behavior. The third section will adjust the new model, called
HPOREQST, for a commercial grade of graphite (EDM3) and discuss its limitations and benefits.
2. Enhancement of POREQST
2.1. Original model
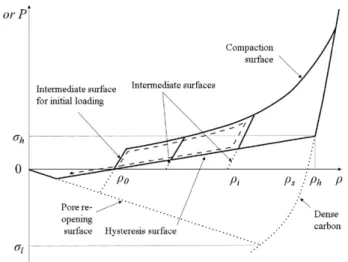
The original POREQST model [14] is implemented into Hésione, a Lagrangian–Eulerian hydrocode developed at CEA. It supplies constitutive relations for porous materials submitted to dynamic loading. Figure 2 presents an overview of its features in the zero internal energy plane.
2.1.1. Dense material. Let ρs be the initial density of the dense (or solid) material at zero pressure P and internal energy e. The EOS of the solid can be any tabulated EOS such as a SESAME or a Mie–Grüneisen expressed as follows:
( ) ⎛ ⎝ ⎜ ⎞ ⎠ ⎟⎛ ⎝ ⎜⎜ ⎛⎝⎜ ⎞ ⎠ ⎟⎞ ⎠ ⎟⎟ ρ ρ ρ ρ ρ ρ = − −Γ − + Γ P ,e K 1 1 e 2 1 s s s s (1) Figure 1. Highlighting of the compressionrelease hysteresis phenomenon for polycrystalline porous graphite and polyurethane foam. For both materials, no residual compaction exists after compression (at least up to 1.1 GPa for EDM3 and 0.26 MPa for PU foam). (a) Uniaxial strain tests in compression (dashed) and cycled compression and release (solid) onto an isotropic porous grade of graphite. Adapted from [1]. (b) Uniaxial strain test in compression and release onto a PU foam. Extracted with permission from [2]. Copyright 2006 SpringerVerlag.
Figure 2. Schematic of the original POREQST model adapted from [14] in the zero internal energy plane. The dashed arrow depicts a typical compressiontension path (without damage model).
with ρ the current density, Ks the dense compressibility modulus and Γ the Grüneisen coefficient of the solid which is assumed to be constant. The two parameters of the elasticplastic behavior law are tabulated and depend on P and e:
•Y P es( , )=Y P f es( ) ( )1 : the elastic limit of the solid; •G P es( , )=G P f es( ) ( )2 : its shear modulus.
f1 and f2 are tabulated softening functions varying between 0
for the melting internal energy and 1 for a zero energy.
2.1.2. Porous material. The porous material is represented as a succession of intermediate elastic surfaces that are delimited by two other surfaces, one accounting for its compaction and the other modeling the pore reopening.
Intermediate surfaces. The first of the intermediate sur faces i is the elastic surface of the porous material. Their density at zero pressure and energy, called intermedi ate density, is denominated ρi. Along these intermediate surfaces, the pres sure is also expressed thanks to a Mie– Grüneisen EOS: ( ) ⎛ ⎝ ⎜ ⎞ ⎠ ⎟ ρ ρ ρ ρ = − Pi , ,e i Ki T 1 i f (2) with T e K K K f e L L K K 1 , 1 , 1 f s s i s i i s 3 1 1 0 0 0 ρ α α α α = + Γ = + − = − − ( ) ( ) / (3) where Tf is a term of thermal dilatation which is constant what ever the intermediate surface. f3 (as the following functions
fi of the model) is a tabulated softening function similar to f1 and f2. Moreover, we define αi=ρ ρs/ i as the material disten sion of the porous material at the intermediate density ρi. In the specific case of the first intermediate surface, i.e. the initial elastic surface of the porous material, we have Ki=K0, ρi=ρ0 and then αi=α0=ρ ρs/ 0. Note that the hidden hypothesis is that the dilatation coefficient at zero pressure is the same whatever the intermediate surface. It means that the volume V is written as: ( α ) α ρ = + ∆ = Γ V V T C K 1 with . i t t s p s (4) As regards the deviatoric stress, the elastic limit and the shear modulus progress according to the intermediate density and the internal energy in the same way as the compressibility modulus: Y Y f e L L Y Y 1 with 1 i s i i s 4 2 2 0 0 0 α α α α = + − = − − ( ) ( ) / (5) α α α α = + − = − − ( ) ( ) / G G f e L L G G 1 with 1 . i s i i s 5 3 3 0 0 0 (6) Thereby, when αi=α0 we obtain the initial values Y0 and G0
corresponding to the initial porous material; when α = 1i , we have the values of the solid material Ys and Gs.
Delimitation of the intermediate surfaces. Assuming a posi tive stress in compression, it follows that:
¯¯ ¯¯ ¯¯ ( ¯¯)
σ =PI−S with trS =0.
(7) In the principal system, let the extrem deviatoric stresses be:
( ) ( )
= = = =
Smax maxSi i 1,3 and Smin minSi i 1,3.
(8) In compression, the limitation of the intermediate surfaces is fulfilled by a compaction surface described by:
( ) ( ) ( )
σ ρc ,e = Σc ρf e6
(9) where Σc( )ρ results from experimental data of a static uniaxial strain test in compression of the healthy porous material such as displayed in figure 2 (dashed line).
In traction, the limitation is undertaken by a pore re opening curve whose intersect at zero energy with the dense material surface occurs at (ρl; σl):
( ) ( ) ( ) ( ) σ ρ ρ ρ ρσ ρ = Σ Σ = e f e T , with o o f o l l 7 (10) σl being the main parameter of this surface. Note that in prac tice, f e3( )=f e6( )=f e7( ).
2.1.3. General algorithm. Then, it is necessary to perform a series of tests (see algorithm 1) in order to establish what value of the pressure the code must use. For that purpose, we note ID the index caracterizing the behavior pattern:
• ID = 0: no change of intermediate surface; • ID = 1: pore reopening;
• ID = 2: compaction;
• ID = 3: complete densification.
2.1.4. Damage criterion and treatment. The typical compres siontension path drawn in figure 2 (dashed arrow) indicates that, without failure model, tension may lead to very low and inconsistent local densities. Therefore, let a failure criterion be defined as follows: α ρ ρ α = ⩽ = ID If 1, s . i i lim (11) It means that damage is activated when both of the following conditions are met: (1) the matter in a Lagrangian cell has a negative pressure located on the pore reopening surface of the POREQST model (i.e. ID = 1); (2) the intermediary distension in this cell is higher than the critical value αlim. In that case, pressure and deviatoric stress are relaxed to zero, and a damage variable D is set to 1. Then in each cell, σl is maintained to its original value if D = 0 or set to 0 if D = 1, which is equivalent to withdrawing the local tension strength of the damaged material.
2.2. New model: H-POREQST
The original POREQST (just as the Pα model and its deriva tives) obviously predicts a residual compaction after compres sion. As written in the introduction, this is not realistic regarding the available data for such materials as graphite and polyurethane foams which present compressionrelease hysteresis cycles.
This work suggests an enhancement of the original POREQST model adapted to materials that experience com pressionrelease hysteresis cycles and calls it HPOREQST (i.e. hysteresisPOREQST). For consistency with the phe nomenological framework of the original model, we intro duce a simple plane surface denominated hysteresis surface as shown in figure 3. It is only defined by the parameter σh which refers to its intersection with the dense EOS in the zero internal energy plane and its equation is given by:
σ ρ ρ ρ σ ρ ρ ρ ρ = Σ Σ = − − ( ) ( ) ( ) ( ) ⎛ ⎝ ⎜ ⎞ ⎠ ⎟ e f e T , h with h h f h hys 8 0 0 (12) where ρh is the density of the intersection point and Tf the same thermal dilatation coefficient defined by equation (3). A numerical adjustment of the parameter σh will be required to reproduce the experiments. Henceforth, pressure relaxation follows successively the intermediary and the hysteresis sur faces that involves two distinct ranges of release wave velocity. Tension is only permitted when the current density is smaller than the initial one, i.e. as long as the distension is greater than α0=ρ ρs/ 0. In that case, the pressure evolution
will follow the negative part of the hysteresis surface. This behavior is not wellsuited for a tensile initial loading but might be appropriate for tension after a compressionrelease cycle during which the microstructure of the material may have changed. Hence, HPOREQST must be considered rele vant only for computations without initial tension. Algorithm 2 gives the series of tests necessary to implement the new model (the dissimilarities with the original POREQST are in blue) thanks to a new index of behavior pattern defined as:
• ID = 4: hysteresis.
Finally, just as POREQST, our new model will encounter density anomalies in tension. To avoid this phenomenon, the damage criterion and treatment enunciated in section 2.1.4 are also used with HPOREQST. Hence, αlim is set to 1, meaning that pore reopening is never authorized.
3. Application to graphite and discussion
The EDM3, a polycrystalline graphite produced by sintering, is manufactured by the compagny POCO [18, 19]. Its porosity Algorithm 1. General algorithm of POREQST, where emelt is the assumedconstant melting energy by volume unit.
begin
←
ID 0;
If e e⩾ melt then
/* Use the dense EOS */
← (ρ )
P Ps ,e
←
ID 3 else
/* Research of the correct pressure expression */
If Pi(ρ,e)−Smax<σ ρo( ,e) and Ps(ρ,e)−Smax<σ ρo( ,e) then ← (σ ρ )+ P o ,e Smax; ← ID 1; end If Ps(ρ,e)>Pi(ρ,e) and ID = 0 then ← (ρ ) P Ps ,e; ← ID 3; end
If Ps(ρ,e)−Smin>σ ρc( ,e) and ID = 0 then
← (ρ )
P Ps ,e;
←
ID 3; end
If Pi(ρ,e)−Smin>σ ρc( ,e) and ID = 0 then ← (σ ρ )+
P c ,e Smin;
←
ID 2; end
If Pi(ρ,e)−Smin<σ ρc( ,e) and ID = 0 then ← (ρ ) P Pi ,e; ← ID 0; end end If ID = 1 or ID = 2 then
/* Deduce the new intermediate surface */
K f e T P 1 L K f e PL
i s 1 f s 1 s1 1
ρ← ( ( )ρ − ρ( + ))/( ( )− ); end
(i.e. 1−ρ ρ0/ s) is about 20% and it is macroscopically homo geneous and isotropic. Characterization tests were conducted by the present authors [1, 5, 16] in order to investigate its behavior under quasistatic and dynamic loading. Quasistatic confined compressionrelease cycles revealed a hysteresis behavior, as displayed in figure 1(a). In the case of dynamic loadings, the release waves are expected to be governed by this phenomenon inducing two distinct ranges of velocities. Furthermore, the experiment tends to show that the density of EDM3 returns to its initial value after compression, i.e. EDM3 does not experience residual compaction.
3.1. EDM3 modeling
The main parameters used for modeling EDM3 with POREQST and HPOREQST are given in table 1. The dense EOS is the tabulated SESAME 7832 of carbon, the compaction
curve is adapted from the dashed line of figure 1(a), and the intermediate surfaces are defined through the elastic moduli K and G. The deviatoric stress is constrained by the VonMises criterion and the elastic limit Y. Note that Gs and Ys are tabu lated piecewiselinear functions of the pressure. The value of the parameter σl is set to −95 MPa in order to make the intersect between the pore reopening surface and the initial intermediate surface at zero energy to be equal to −70 MPa, which is the tension strength of healthy EDM3 [1]. The limit distension αlim is set to 1, i.e. the condition of equation (11) is always fulfilled. Thus, the use of the pore reopening surface is totally prohibited, thereby transcribing the brittleness of the material (fracture toughness of about 1 MPa · m1/2[20–25]).
Last, the unique parameter of the hysteresis surface σh is equal to 200 MPa (see section 3.2).
As shown in figure 4, this set of parameters allows a satis fying match between the test from figure 1(a) and its simulation Algorithm 2. General algorithm of HPOREQST, where emelt is the assumedconstant melting energy by volume unit. In blue are the
dissimilarities with the original POREQST.
begin
←
ID 0; If e e⩾ melt then
/* Use the dense EOS */
← (ρ )
P Ps ,e
←
ID 3 else
/* Research of the correct pressure expression */
if Pi(ρ,e)−Smax<σ ρo( ,e) and Ps(ρ,e)−Smax<σ ρo( ,e) then ← (σ ρ )+
P o ,e Smax;
←
ID 1; end
if Pi(ρ, e) − Smax < σhys(ρ, e) and σo(ρ, e) < σhys(ρ, e)then P ← σhys(ρ, e) + Smax; ID ← 4; end if Ps(ρ,e)>Pi(ρ,e) and ID = 0 then ← (ρ ) P Ps ,e; ← ID 3; end
if Ps(ρ,e)−Smin>σ ρc( ,e) and ID = 0 then ← (ρ )
P Ps ,e;
←
ID 3; end
if Pi(ρ,e)−Smin>σ ρc( ,e) and ID = 0 then ← (σ ρ )+
P c ,e Smin;
←
ID 2; end
if Pi(ρ,e)−Smin<σ ρc( ,e) and ID = 0 then ← (ρ ) P Pi ,e; ← ID 0; end end If ID = 1 or ID = 2 or ID = 4 then
/* Deduce the new intermediate surface */
K f e T P 1 L K f e PL
i s1 f s 1 s1 1
ρ← ( ( )ρ − ρ( + ))/( ( )− ); end
up to 1 GPa with HPOREQST and the hydrocode Hésione. It was a prerequisite prior to simulating dynamic experiments.
3.2. Plate impact test
In order to appraise HPOREQST, two experiments with EDM3 samples have been performed. Both consisted in a 2 mmthickness copper plate launched at 330 m s−1 by a mono
stage lightgas gun onto a 3 mmthickness plate of graphite. A PDV probe [27–29] recorded the rear free surface velocity of the latter. Since the experiments were perfectly repeatable only one velocity is displayed in figure 5(a) (circles).
Numerical simulations were performed with Hésione in a planar 1D Lagrangian configuration. The maximum generated stress onto the graphite target rear face was around 400 MPa. It allowed the model to be tested in the middle range of the static uniaxial compression data of figure 1.
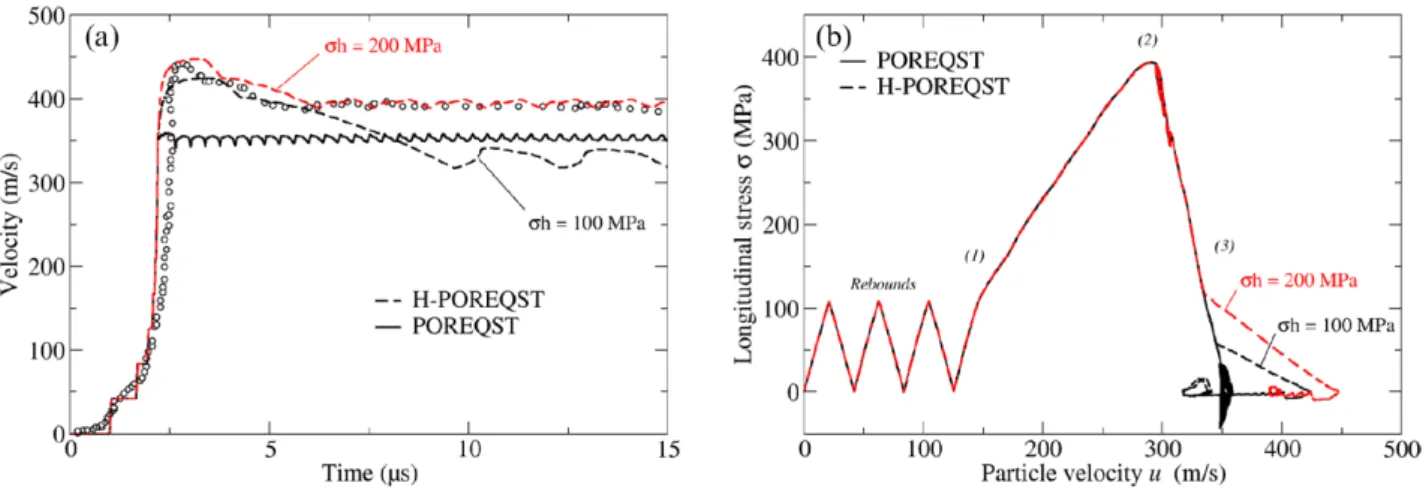
Results are given in figure 5(a). The continuous line gives the rear surface velocity of EDM3 obtained with the original model of POREQST associated to the damage model pre sented in section 2.1.4, whilst the dotted lines display sig nals computed with the model HPOREQST with the same damage model. In both case, the curve foot is squared due to the successive rebounds of the shock elastic precursor on the rear surface of the target corresponding to the elastic initial surface of the models. Throughout an adjustment of the value of σh was set to 200 MPa, the new model clearly improves the first peak of the freesurface velocity. Furthermore, the pullback phenomenon is well reproduced and the spall ejec tion velocity satisfactorily oscillates around the experimental signal.
3.3. Discussion
The increase of the maximum free surface velocity up to the experimental level induced by HPOREQST confirms that hysteresis behavior also occurs in the dynamic regime. It is well understood thanks to figure 5(b) which gives the numer ical σu diagram of the target recorded close to the back face, u being the particle velocity and σ the longitudinal stress. The target undergoes a nonmonotonic compression (because of the rebounds of the elastic precursor on the back face) (1) up to a maximum stress of about 400 MPa (2). The shock break out on the rear surface involves a stress decrease (3) whose shape depends on the model. Original POREQST implies a straightlike pressure decay (plain) due to the intermediate sur faces generating a low free surface velocity around 360 m s−1.
Whereas HPOREQST implies an upper free surface velocity around 450 m s−1 coming from the twostraightpart pressure
Figure 4. Comparison between the quasistatic cycled test from figure 1 and its simulation with HPOREQST and Hésione using the parameters of EDM3 from table 1. As an illustration of the discussion of section 3.3, both simulations with σ = 100h MPa (black rounds) and with σ = 200h MPa (red squares) are given. Discontinuities in the slope of the intermediate surfaces are logically due to the elastoplastic modeling.
Table 1. Main parameters used for computations with POREQST and HPOREQST performed in section 3.2.
Dense graphite EOS SESAME 7832
Compaction curve figure 1a
Pore reopening parameter σl (MPa) −95 a Hysteresis parameter σh (MPa) 200
Softening function fi(e) Linear
Initial densities (kg m−3) Porous ρ
0 1754a Dense ρs 2250c Compressibility modulus (GPa) KKs0 8.58 a 34.05c
Shear modulus (GPa) G0 5.01a
Gs(P = 0) 20a
Gs(P = 18 GPa) 50a
Gs(P = 27.5 GPa) 280a
Elastic limit (GPa) Y0 0.1b
Ys(P = 0) 0.1b
Ys(P = 25 GPa) 5b
Limit distension αlim 1
a Data extracted from [1]. b Data from [26].
c Values deduced from the SESAME 7832 table.
Figure 3. Schematic of the new HPOREQST model in the zero internal energy plane. The dashed arrow depicts a typical compressiontension path (without damage model). Dotted lines are unusable surface parts.
decrease (dashed) related to the intermediate and hysteresis surfaces.
According to the hysteresis cycle of figure 1 reaching 400 MPa (i.e. the maximum stress endured by the target back face during the plate impact experiment), the adjusted value of σh (200 MPa) should be more around 100–150 MPa, a value more or less confirmed by the simulation of the quasistatic test displayed in figure 4. Nonetheless, it does not give the best result for the dynamic experiment as shown in figure 5(a). There are three hypotheses that may explain this discrepancy: (1) the material has been softened by the first cycles of the static test; (2) a dynamic hardening of the target occurs during the plate impact experiment; (3) the linear modeling of the lower part of the hysteresis (intermediate and hysteresis sur faces) is not representative enough.
However, despite the simplicity of the modeling, the overall agreement between the experiment and the computa tion with HPOREQST is very satisfactory which paves the way for potential further improvements, when more various experimental results will be available.
4. Conclusion
The purpose of this paper was to enhance the POREQST model in order to be able to numerically reproduce the assumed density recovery after shock compression of certain porous materials and foams.
Hence, we introduced a new constitutive surface beside the original ones and called it the hysteresis surface that is defined through a single parameter. This simple modeling was tested for plate impact experiments on EDM3, a commercial porous graphite. It clearly improved the target free surface velocity first peak as well as the spall phenomenon and its flight average velocity, thereby confirming the existence of the hysteresis behavior under dynamic shockandrelease loading.
Finally, testing this model on more different loading cases (unsustained shock, compression up to higher pressures and release, etc) might be relevant for its improvement and vali dation. Then, the new HPOREQST model should be tested
for computing hypervelocity impacts of steel spheres into graphite [26, 31] where it may help to simulate the crater refill phenomenon observed experimentally.
Acknowledgments
The authors express their gratitude to the team of the Complexe 500 at CEA CESTA for having performed the plate impact experiments.
References
[1] Seisson G 2014 Experimental and theoretical study of the damaging of graphite under dynamic loading—application
to hypervelocity impacts PhD Thesis ISAEENSMA École
Nationale Supérieure de Mécanique et d’Aérotechnique— Poitiers https://tel.archivesouvertes.fr/tel01127342
[2] Kitagawa K, Yasuhara M and Takayama K 2006 Attenuation of shock waves propagating in polyurethane foams Shock Waves15 437–45
[3] Thouvenin J 1966 Action d’une onde de choc sur un solide poreux J. Phys. 27 183–9
[4] Zagouri D, Romain J P, Dubrujeaud B and Jeandin M 1991 Laser shock compaction of porous materials J. Phys. IV France 01 47–50
[5] Hébert D, Seisson G, Bertron I, Chevalier J M, Thessieux C, Quessada J H and Tastet S 2014 Plate impact experiments and simulation on porous graphite J. Phys.: Conf. Ser. 500182016
[6] Zel’dovich Y B and Raizer Y P 1967 Physics of Shock Waves and High-Temperature Hydrodynamic Phenomena vol 2 (New York: Academic)
[7] McQueen R G, Marsh S P, Taylor J W, Fritz J N and
Carter W J 1970 The equation of state of solids from shock wave studies High Velocity Impact Phenom. 293293–417
[8] Khishchenko K V, Charakhch’yan A A, Fortov V E, Frolova A A, Milyavskiy V V, Shurshalov L V 2011 Hydrodynamic simulation of converging shock waves in porous conical samples enclosed within solid targets J. Appl. Phys.110 053501
[9] Charakhch’yan A A, Khishchenko K V, Fortov V E, Frolova A A, Milyavskiy V V and Shurshalov L V 2011 Shock compression of some porous media in conical targets: numerical study Shock Waves 21 35–42
Figure 5. Comparison between the original model and the enhanced one in the case of a plate impact experiment on EDM3 with spallation. (a) Experimental free surface velocity of the EDM3 target compared to the simulations results with POREQST and HPOREQST. (b) σu diagram of the experiment extracted from numerical simulations (with artifical viscosity [30]). Comparison between POREQST and HPOREQST.
[10] Charakhch’yan A A et al 2011 Converging shock waves in porous media Tech. Phys. Lett. 30 33–5
[11] Herrmann W 1969 Constitutive equation for the dynamic compaction of ductile porous materials J. Appl. Phys. 40 2490–9
[12] Carroll M M and Holt A C 1972 Static and dynamic pore collapse relations for ductile porous materials J. Appl. Phys. 43 1626–36
[13] Wünnemann K, Collins G S and Melosh H J 2006 A strain based porosity model for use in hydrocode simulations of impacts and implications for transient crater growth in porous targets Icarus 180 514–27
[14] Seaman L, Tokheim R E and Curran D R 1974 Computational representation of constitutive relations for porous materials Technical Report No. DNA3412F Stanford Research Institute
[15] Seisson G et al 2013 Dynamic behavior of a porous brittle material: experiments and modeling Procedia Eng. 58 715–23
[16] Seisson G et al 2014 Modeling of laserdriven waterconfined shocks into porous graphite J. Phys.: Conf. Ser. 500112057
[17] Seisson G et al 2014 Dynamic cratering of graphite: experimental results and simulations Int. J. Impact Eng. 63 18–28
[18] Poco 2016 www.poco.com
[19] Sheppard R G, Morgan D, Mathes D M and Bray D J (ed) 2002 Properties and Characteristics of Graphite for the EDM Industry 5th edn (Decatur, TX: Poco Graphite) [20] Takahashi S, Aoki S and Oku T 1993 Impact fracture
toughness of a nuclear graphite measured by the onepoint bending method Carbon 31 315–23
[21] Ayatollahi M R, Berto F and Lazzarin P 2011 Mixed mode brittle fracture of sharp and blunt vnotches in polycrystalline graphite Carbon 49 2465–74
[22] Burchell D 1996 A microstructurally based fracture model for polygranular graphites Carbon 34 297–316
[23] Salazar A, Pastor J Y and Llorca J 2002 In situ observation of damage nucleation in graphite and carbon/carbon composites Carbon 40 609–16
[24] Latella B A and Liu T 2006 The initiation and
propagation of thermal shock cracks in graphite Carbon 44 3043–8
[25] Mirhabibi A R and Rand B 2007 Graphite flakecarbon composites. II: fracture behaviour, toughness, notch insensitivity and Weibull modulus Carbon 45 991–7
[26] Hébert D et al 2015 Simulations of hypervelocity impacts into graphite Procedia Eng. 103 159–64
[27] Strand O T and Whitworth T L 2007 Using the heterodyne method to measure velocities on shock physics experiments AIP Conf. Proc. 955 1143–6
[28] Mercier P et al 2009 PDV measurements of ns and fs laser driven shock experiments on solid targets AIP Conf. Proc.
1195 581–4
[29] Hébert D et al 2011 A KDP equation of state
for laserinduced damage applications J. Appl. Phys. 109 123527
[30] Wilkins M L 1980 Use of artificial viscosity in
multidimensional fluid dynamic calculations J. Comput. Phys.36 281–303
[31] Seisson G et al 2014 Penetration and cratering experiments of graphite by 0.5 mm diameter steel spheres at various impact velocities Int. J. Impact Eng. 70 14–20