HAL Id: halshs-00765931
https://halshs.archives-ouvertes.fr/halshs-00765931
Preprint submitted on 17 Dec 2012
HAL is a multi-disciplinary open access archive for the deposit and dissemination of sci-entific research documents, whether they are pub-lished or not. The documents may come from teaching and research institutions in France or abroad, or from public or private research centers.
L’archive ouverte pluridisciplinaire HAL, est destinée au dépôt et à la diffusion de documents scientifiques de niveau recherche, publiés ou non, émanant des établissements d’enseignement et de recherche français ou étrangers, des laboratoires publics ou privés.
The impact of the catering theory and financial firms’
characteristics on dividend decisions: the case of the
French market
Kamal Anouar
To cite this version:
Kamal Anouar. The impact of the catering theory and financial firms’ characteristics on dividend decisions: the case of the French market. 2012. �halshs-00765931�
1
The impact of the catering theory and financial
firms’ characteristics on dividend decisions: the case
of the French market
Kamal ANOUAR∗
GRM (EA 4711), Sud Toulon-Var University anouar@univ-tln.fr
Abstract:
This article investigates the impact that prevailing investor demand for dividend payers and financial firm’s characteristics have on the probability of starting or continuing to pay dividends. To test this prediction, we use probit regressions on panel data. The major finding that emerges from our analyses is: in large companies characterized by high profitability and low debt levels, investors’ demand for dividend payers has a positive and significant impact on the probability that a manager will decide to pay positive dividends.
Key words: behavioral corporate finance, dividend, econometric of panel data, investor’s irrationality.
JEL code: G02, G35
2 Introduction
The decision to pay created value out to shareholders is considered as strategic for two reasons. First, the market is responsive to the choices that affect this decision, which relate to other financial and investment decisions. For example, Allen and Michaely (2003, p.3-4) argue that studying payout policies may result in a better understanding of investments and financial decisions. Second, this decision is considered as strategic because the empirical observations show that the managers of French listed companies distribute a high amount of free cash flows as dividends to shareholders each year. For example, in 2009 the managers of the SBF250 companies paid about 40 billion euro in dividends.
Due to the importance of this decision, many theoretical developments have been proposed. However, the results of these studies lack coherence. Moreover, although this issue is an ongoing concern, it appears that the problem is not new to the field and has been widely studied for a long time. In 1961, Miller and Modigliani found that no value is created through a simple financial decision in a perfect capital market: a company must pay dividends to shareholders if the return on investment projects it undertakes is less than the weighted average cost of capital.
This simplistic approach does not explain companies’ behavior concerning dividend policy. In fact, and in an imperfect capital market, many researchers consider that imperfections can make dividend policy relevant. These anomalies are fiscal (see Brennan, 1970; Elton et Gruber, 1970; Poterba et Summers (1984); Hamon et Jacquillat, 1992; etc.), informational (see Bhattacharya, 1979, 1980; John et Williams, 1985; Miller et Rock, 1985; Rozeff, 1982; Easterbrook, 1984; Jensen, 1986; etc.) and behavioral (see Shefrin et Statman, 1984). The latter, unlike other imperfections, has not been greatly used for resolving the « dividend puzzle ».
3
As a result, we will take this imperfection seriously in order to reach a better understanding of the dividend policy using « the catering theory of dividends » developed by Baker and Wurgler (2004a). The basic idea of this theory is that when dividend payers are overpriced in comparison with non-payers, managers have an incentive to initiate or continue to pay dividends and are, in general, reluctant to stop it. On the contrary, when the market prefers non-payers, managers have an incentive to cut paying a dividend or are reluctant to initiate paying one.
This article applies this theory to the French market using econometric regressions on panel data. We use the behavioral imperfection in order to attain a better understanding of the dividend decision made by the managers of the largest listed companies in France. More precisely, we verify empirically the impact that prevailing investor demand for dividend payers and financial firm’s characteristics have on the probability of starting or continuing to pay dividends.
The remainder of this paper is organized as follows: in the first section we give a literature review discussing the importance of the theoretical frame. Secondly, we describe our methodology in order to provide our main hypothesis. In the third part, we define the sample and the data used for this study. Finally, the obtained results are presented and discussed in the last two sections.
4 1. Literature review
The relaxation of investor’s perfect rationality assumption in corporate finance has led to emergence of the « behavioral corporate finance » approach (Shefrin, 2001). In an interesting article highlighting state of the art of the research in behavioral corporate finance, Baker et al. (2004) distinguish two approaches depending on whether irrationality lies with managers (internal approach) or with investors (external approach).
On the one hand, in the first approach, rational investors coexist with overconfident managers whose decisions may be suboptimal and may cause a decline in the company value.
On the other hand, in the second approach, investors are irrational and imply mispricing of securities market that can last in time because of the limits to arbitration. The managers who are able to perceive mispricing will intervene to remove this misevaluation through the investment and financial decisions.
Many theoretical frameworks based on this external approach have been proposed to better explain some questions in corporate finance including the dividend decision. In fact, the mispricing caused by irrational investors may affect the decision of paying dividends to shareholders.
Shefrin and Statman (1984) were the first to introduce the behavioral arguments to explain the dividends decision. Twenty years later, the studies of Baker and Wurgler (2004a&b) have given new impulsion to the behavioral argument by developing the « catering theory of dividends ». The mean idea of this theory is that when dividend payers are overpriced, managers will have an incentive to pay dividends and will be, in general, reluctant to stop it. To test this prediction, Baker and Wurgler (2004a) have used the «dividend premium» as an ex ante measure of mispricing. This latter measure is defined as the difference between the average market-to-book ratio of dividend payers and non-payer’s.
5
In addition, they have showed that the time-varying propensity of firms paying dividends is explained by the investors’ demand for payers. The higher the demand is, the higher is the propensity to pay.
To confirm their results, Baker and Wurgler (2004a) have constructed a second an ex post measure of misevaluation consisting on the observation of stocks’ future returns. They have established that when the rate of dividend initiation increases, the future performances of payers are lower compared to those of non-payers. This is consistent with the idea that firms initiate a dividend when the prices of existing payers are overvalued.
Thereafter, some studies analyze and apply this theory in different capital market using several methodologies.
Denis and Osobov (2005) have tested the « catering theory » by using time series data for six developed financial markets between 1982 and 2002. They showed that among the « common law » countries (Canada and United Kingdom) – where shareholders exercise strong pressure on managers- catering theory is verified but with very little significance, while among the « civil law » countries (Germany, France and Japan) -where shareholders are putting low pressure on managers- catering theory is rejected.
In the UK market, Ferris et al. (2006) have explored and validated the catering theory of dividends; they have found that the dividend has disappeared after 1990 and that this disappearance is related to the lowest levels of dividend premium.
For Neves et Torre (2006), firms in the Euro zone satisfy the sentiments of their investors. They study and validate the relationship between the rate of dividend payment and the catering theory.
6
Li et Lie (2006) have extended the model of Baker and Wurgler (2004a) by focusing on the increases and decreases in dividend payments. The results obtained show that the decision to change the rate of dividends payment and the extent of this change depends on the dividend premium put by the market.
Ferris et al. (2009) have proved the results of Osobov and Denis (2005) on a sample including twenty-three countries. Managers rationally respond to the dividend investor’s demand in « common law » countries. In contrast, in « civil law » countries, companies do not follow the investor’s preference to dividend.
In a recent paper, Albouy et al. (2010) validates the catering theory by a survey of seventy-five managers of French listed companies. It points out that 64% of managers responded positively, while only 18% answered negatively to the question « should the managers take into account the shareholders preferences when they take the dividend decisions? ».
By this literature review, it is clear that the « catering theory of dividends » is confirmed on the American, Canadian and also British markets. Regarding the French market, the results are more mixed, since this theory is rejected by two studies (Denis et Osobov, 2005; Ferris et al., 2009) and accepted once (Albouy et al., 2010). This is why we decide to test this theory to contribute on understanding the French particularities.
2. Methodologies
As it was mentioned above, we investigate whether the persistence of the SBF250 managers to pay dividends is related to the prevailing investor’s preference for dividend payers. Our intuition is as follows: since the majority of managers pay dividends to their shareholders, the market should puts high prices on dividend’s payers compared to the non-payers.
7
The managers that do not satisfy the prevailing investor’s preference must be punished by the market.
We use quantitative methodology type Probit regressions for testing this theory. We describe this methodology in the following points.
In our binary model, on the one hand, the dependent variable is the decision to pay dividends « Ybin ». This is a binary variable taking the value « 1 » in case of dividend payers and « 0 » otherwise.
On the other hand, the explanatory variable is the investors demand for payers; it is measured by the market-to-book ratio in t-1 « M/B ». The intuition behind is: the probability that a company pays dividend to shareholders is positively linked to a high market-to-book ratio. In addition, and as in Fama and French (2001), we introduce in the model some variables related to financial firms’ characteristics, in particular investment opportunities, profitability and size. The objectives are to ensure that the decision to pay dividends is related to the prevailing investor’s demand and to measure the importance of these characteristics in explaining dynamics of the dividend decision.
To model the investment opportunities, we use the variable « variation in book assets »
1 1 1 − − − − = ∆ = ∆ t t t t t A A A A
Assets . We add the variable « variation in total debts »
1 1 1 − − − − = ∆ = ∆ t t t t t D D D D
Debts in the sense that a positive growth in debt (to finance a large
investment opportunities) is in general accompanied by an abstention to pay dividend. The expected relations are: Firstly, the large are the investment opportunities the less the companies are incentive to pay dividend. Secondly, the greater the growth in debt, the lesser the firms are incentive to be payers.
8
We use the variable « dividend yield » (DY) in t-1 and « dividend payout ratio » (POR) in t-1 to measure the influence of profitability on the dividend decision. The expected relations imply a positive impact of dividend yield and dividend payout ratio on the dividend decision.
Finally, the size can also play a crucial role in the payment decision. We introduce the « logarithm of market capitalization » in t (Log MV) to model size. The expected relationship implies a positive association between firm size and the dividend payment probability.
Table 1 summarizes all the variables used for Probit regressions.
Table 1: Variables description
Dimensions Variables Description
Dividend payment
decision Ybin
Decision to pay dividends, binary variable taking the value 1 in case of dividend payers and 0 otherwise. Prevaling
M/B Market-to-book ratio in t-1. investors demand
Investment ∆Assets Variation in book assets between t and t-1. Opportunities ∆Debts Variation in total debts between t and t-1.
Profitability DY Dividend yield in t-1.
POR Dividend payout ratio in t-1.
Size Log MV Logarithm of market capitalization in t .
The hypothesis tested is: the prevailing investors demand for payers, measured by the market-to-book ratio, influences positively the probability that a manager will initiate or continue to pay positive dividends to shareholders of an SBF250 company characterized by low investment opportunities, low debt, big profits and large size.
Our hypothesis tests are conducted on three steps: first, we test four bivariate models with one explanatory variable at time to make sure that each of these variables influences the decision of dividend payment in the same direction as predicted.
9
Second, we test three partial models where we associate respectively to our mean variable « prevailing investors demand » each of the others explanatory variable « investment opportunities », « profitability » and « size » to verify how each couple of explanatory variable combination varies together.
Third, we test the full model with all the retained variables to compare the changes in signs and the significance of the coefficients obtained for each dimension.
3. Samples and data
Sample firms was drawn from the « Société des Bourses Françaises » Index (SBF 250) as at December 31, 2010.
For each of the firms, we collected all the data available between 1990 and 2010 via DATASTREAM. We also removed the companies presenting outliers or missing values for a given year. This results in a sample of 2041 firm-year observations.
Table 2 displays the sample and summary statistics regarding the independent variables (mean and standard deviation (SD)):
• The principal independent variable « M/B » varies on average between 1.47 to 2.85 during the period 1992-2000, and its standard deviation reaches its maximum in 2000 because of the internet bubble event;
• The highest change (37%) in the variable « ∆Assets » is achieved in 2005 while the lower one (1.88%) is reached in 2009 due to the effects of the financial crisis. This variable also deviates significantly from the average over all the period;
• The lowest change (3.31%) in the variable « ∆Debts » is reached in 2004 while the highest one (108.43%) is achieved in 2004. The standard deviation of this variable varies from 50% in 2004 to more than 470% in 1998. This reflects a relative difference between the debt policies of the SBF250 companies;
10
• The « dividend yield » is most of time higher than 3% over all periods. This means that for each 100 euro invested in a security, the investor receives 3 euro as dividends. In addition, the « dividend yield » doesn’t deviate significantly from the average;
• Themanagers of SBF250 distribute on average more than 30% of earning as dividends for shareholders. The standard deviation of this variable is about 20%.
Table 2: descriptive statistics of independent variables
Year Sample MB ∆Assets ∆Debts DY POR LogMV Mean SD Mean SD Mean SD Mean SD Mean SD Mean SD 1992 74 1.47 0.96 29.67 99.36 53.09 174.77 4.44 3.6 35.71 20.61 19.67 1.89 1993 75 1.82 1.22 6.27 15.1 18.72 94.87 5.04 4.15 38.2 24.41 19.9 1.9 1994 76 1.89 1.2 10.62 28.83 15.97 68.71 3.75 2.59 35.69 25.51 20.09 1.78 1995 80 1.71 1.07 10.53 30.5 32.98 102 3.47 2.76 37.29 24.5 20.02 1.83 1996 86 1.84 1.27 7.05 13.41 26.14 110.1 4.3 4.21 37.28 25.04 20.13 1.86 1997 87 2.12 1.34 23.51 37.34 86.41 332.28 4.84 6.09 34.95 23.06 20.38 1.86 1998 92 2.31 1.53 22.99 80.49 108.43 471.39 3.45 3.27 34.8 21.82 20.45 2 1999 102 2.29 1.43 27.41 36.26 44.56 97.69 3.1 2.39 34.53 22.63 20.45 2.07 2000 112 2.85 2.33 23.93 31.69 55.13 126.21 2.87 2.41 34.53 22.63 20.45 2.07 2001 122 1.76 1.2 18.73 33.88 63.41 151.23 2.8 2.47 29.19 19.12 20.32 2.05 2002 127 1.67 1.08 6.51 32.54 8.98 67.77 3.77 3.01 29.37 20.81 20.28 2 2003 130 1.7 0.95 7.88 34.5 65.18 528.34 3.56 2.6 32.86 22.33 20.39 1.95 2004 130 1.99 0.98 13.83 74.2 3.31 50.51 3.44 2.79 34.06 22.93 20.66 1.86 2005 135 2.3 1.32 37.03 112.39 82.55 294.47 2.86 2 36.74 24.3 20.99 1.75 2006 140 2.33 1.21 19.24 39.14 63.27 391.6 1.79 1.19 33.71 20.64 21.16 1.75 2007 151 2.47 1.45 18.59 29.96 39.03 140.38 1.88 1.21 33.17 19.19 21.35 1.74 2008 160 1.93 1.58 8.94 25.38 35.76 129.02 2.04 1.69 34.79 21.05 20.97 1.8 2009 162 1.62 1.11 1.88 14.14 18.27 162.11 3.34 2.49 32.73 22.56 20.9 1.8 This table reveals the sample, present mean and standard deviation values for the variables included in the probit regressions. Variable definitions: ܯ ܤ = ݉ܽݎ݇݁ݐ − ݐ − ܾ݇ ݎܽݐ݅; ∆ܣݏݏ݁ݐݏ = ݒܽݎ݅ܽݐ݅݊ ݅݊ ܾ݇ ܽݏݏ݁ݐݏ; ∆ܦܾ݁ݐݏ = ݒܽݎ݅ܽݐ݅݊ ݅݊ ܾ݀݁ݐݏ; ܦܻ = ݀݅ݒ݅݀݁݊݀ ݕ݈݅݁݀; ܱܴܲ = ܽݕ ݑݐ ݎܽݐ݅; ܮ݃ ܯܸ = ݈݃ܽݎ݅ݐℎ݉ ݂ ݉ܽݎ݇݁ݐ ܿܽ݅ݐ݈ܽ݅ݖܽݐ݅݊
11
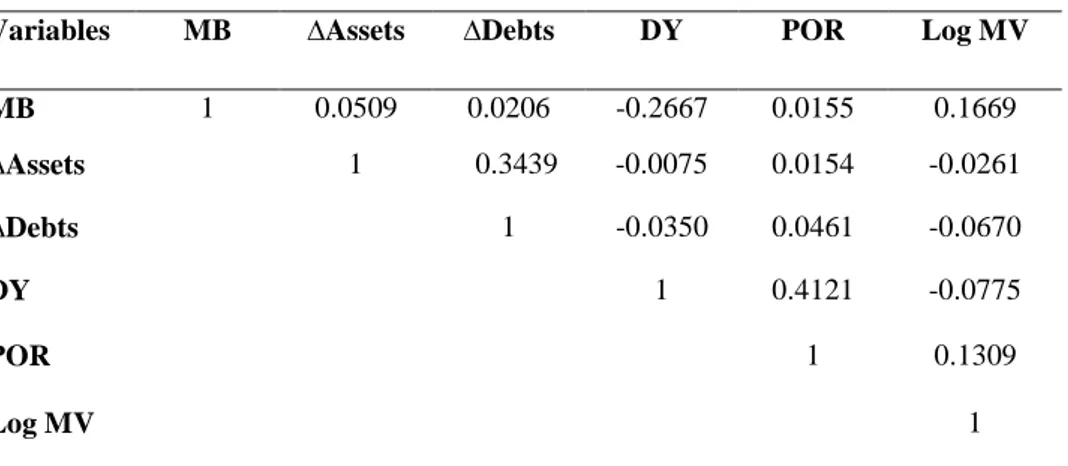
Once descriptive statistics of the independent variables have been done, their non-correlation should be ensured through the calculation of Pearson coefficients.
The results obtained (Table 3) show that there is no significant relationship between the explanatory variables in the model. Only the correlation between dividend yield and payout ratio exceeds 40% but remains below 60%.
Table 3: Pearson correlation between explanatory variables
Variables MB ∆Assets ∆Debts DY POR Log MV
MB 1 0.0509 0.0206 -0.2667 0.0155 0.1669 ∆Assets 1 0.3439 -0.0075 0.0154 -0.0261 ∆Debts 1 -0.0350 0.0461 -0.0670 DY 1 0.4121 -0.0775 POR 1 0.1309 Log MV 1
This table presents pairwise correlations between independent variables included in the Probit regressions. Variable definitions: ܯ ܤ = ݉ܽݎ݇݁ݐ − ݐ − ܾ݇ ݎܽݐ݅; ∆ܣݏݏ݁ݐݏ = ݒܽݎ݅ܽݐ݅݊ ݅݊ ܾ݇ ܽݏݏ݁ݐݏ; ∆ܦܾ݁ݐݏ = ݒܽݎ݅ܽݐ݅݊ ݅݊ ܾ݀݁ݐݏ; ܦܻ = ݀݅ݒ݅݀݁݊݀ ݕ݈݅݁݀; ܱܴܲ = ܽݕ ݑݐ ݎܽݐ݅; ܮ݃ ܯܸ = ݈݃ܽݎ݅ݐℎ݉ ݂ ݉ܽݎ݇݁ݐ ܿܽ݅ݐ݈ܽ݅ݖܽݐ݅݊ 4. Empirical results
The following Probit model is used to examine the impact that prevailing investor demand for dividend payers and financial firm’s characteristics have on the probability of starting or continuing to pay dividends:
ܲݎሺܻܾ݅݊௧ = 1ሻ = ܲݎܾ݅ݐሺܽ௧ିଵܯܤ௧ିଵ+ ܾ௧ܸܽݎܣݏݏ݁ݐݏ௧+ ܿ௧ܸܽݎܦܾ݁ݐݏ௧+
12 Where: ݁௧ = ܽݎ݁ ݐℎ݁ ݎܽ݊݀݉ ݂݂݁݁ܿݐݏ ݂ ݐℎ݁ ݈݉݀݁; ߇௧௬ = 1 ݂݅ ݐ = ݕ݁ܽݎ ܽ݊݀ ߇௧௬ = 0 ݐℎ݁ݎݓ݅ݏ݁; ܻܾ݅݊ = 1 ݂݅ ݐℎ݁ ݂݅ݎ݉ ݅ݏ ܽ ݀݅ݒ݅݀݁݊݀ ܽݕ݁ݎ, 0 ݐℎ݁ݎݓℎ݅ݏ݁; ܯ ܤ = ݉ܽݎ݇݁ݐ − ݐ − ܾ݇ ݎܽݐ݅; ∆ܣݏݏ݁ݐݏ = ݒܽݎ݅ܽݐ݅݊ ݅݊ ܾ݇ ܽݏݏ݁ݐݏ; ∆ܦܾ݁ݐݏ = ݒܽݎ݅ܽݐ݅݊ ݅݊ ܾ݀݁ݐݏ; ܦܻ = ݀݅ݒ݅݀݁݊݀ ݕ݈݅݁݀; ܱܴܲ = ܽݕ ݑݐ ݎܽݐ݅; ܮ݃ ܯܸ = ݈݃ܽݎ݅ݐℎ݉ ݂ ݉ܽݎ݇݁ݐ ܿܽ݅ݐ݈ܽ݅ݖܽݐ݅݊.
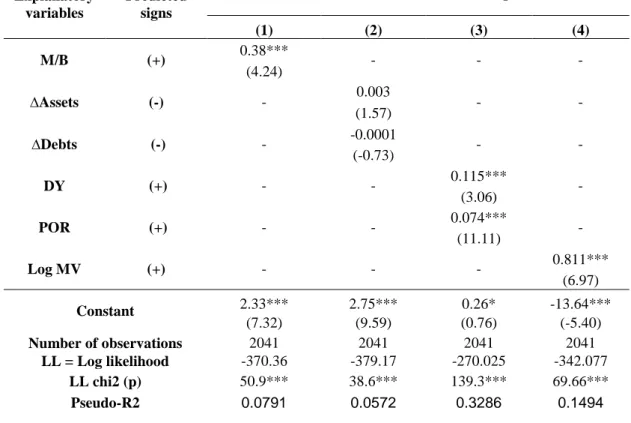
As we mentioned above, we compare and interpret the results (table 5&6) obtained in three ways: one dimension at time, « prevailing investors demand » + one another dimension, and finally the full model.
First, in the bivariate Probit models (table 5), we test each variable individually. Model (1) includes the variable « M/B », model (2) contains the variables « ∆Assets » and « ∆Debts », model (3) regroups the variables « DY » and « POR » and finally the model (4) includes the variable « size ».
According to the model (1), the probability of a positive dividend payment is positively and significantly (0.38; 0.01) influenced by the market valuation. The high is the market-to-book ratio, the greater is the probability that firms initiate (or continue) to pay dividend.
13
As predicted, the coefficient on «∆ܦܾ݁ݐݏ» is negative (-0.0001) but not significant. The
results of the second model show also that the level of investment is not associated negatively with the probability of a positive dividend payment. This indicates that the impact of investment opportunities on dividend decision is not significant.
The model (3) is significant with a pseudo-R2 of 33.86%. Consistent with the prediction, the probability to pay dividends to shareholders is positively and significantly associated to the variables characterizing the profitability in the case of an SBF250 company. The coefficients on « DY » and on « POR » are positive (0.115; 0.074) and significant (p < 0.01).
The model (4) is better than the trivial model with a pseudo-R2 of 14.94 percent. As predicted, the coefficient on « Log MV » is positive and significant (0.811; p < 0.01). This suggests that company size impacts positively the probability of a positive dividends payment; the small is the size the low is the probability that firms pay dividends
14
Table 5: Results of individual’s Probit models –with random and temporal effects-
Explanatory variables
Predicted signs
Probit models –with individual and temporal effects-
(1) (2) (3) (4) M/B (+) 0.38*** - - - (4.24) ∆Assets (-) - 0.003 - - (1.57) ∆Debts (-) - -0.0001 - - (-0.73) DY (+) - - 0.115*** - (3.06) POR (+) - - 0.074*** - (11.11) Log MV (+) - - - 0.811*** (6.97) Constant 2.33*** 2.75*** 0.26* -13.64*** (7.32) (9.59) (0.76) (-5.40) Number of observations 2041 2041 2041 2041 LL = Log likelihood -370.36 -379.17 -270.025 -342.077 LL chi2 (p) 50.9*** 38.6*** 139.3*** 69.66*** Pseudo-R2 0.0791 0.0572 0.3286 0.1494
This table presents the results of the individual probit models examining the impact of the prevailing investors demand for payers on the probability that a manager initiates or continues to pay dividends. Parameter estimates are based on the following model:
ܲݎሺܻܾ݅݊௧= 1ሻ = ܲݎܾ݅ݐሺܽ௧ିଵܯܤ௧ିଵ+ ܾ௧ܸܽݎܣݏݏ݁ݐݏ௧+ ܿ௧ܸܽݎܦܾ݁ݐݏ௧+ ݀௧ିଵܦܻ௧ିଵ+ ݁௧ିଵܱܴܲ௧ିଵ+
݂௧݈݃ܯܸ௧+ ݃௧ଵଽଽଶΙଵଽଽଶ୧୲ + ⋯ + g୧୲ଶ଼Ι୧୲ଶ଼+ e୧୲ሻ.
where: e୧୲ = are the random effects of the model and Ι୧୲ ୷ୣୟ୰
= 1 if t = year and Ι୧୲୷ୣୟ୰= 0 otherwise;
Variable definitions:
Ybin = 1 if the ϐirm is a dividend payer, 0 otherwhise; M
B = market − to − book ratio; ∆Assets = variation in book assets; ∆Debts = variation in debts; DY = dividend yield; POR = pay out ratio;
Log MV = logarithm of market capitalization.
For each variable, the coefficient value is followed in brackets by the value of Wald (z) with the significance levels: *** (p<0,01), ** (p<0,05) and * (p<0,10).
15
Second, in the partial Probit models (table 6), we have associated with our main independent variable « market-to-book ratio » each of the other independent variables. We then test simultaneously in:
Model (P1) the variables « M/B », « ∆Assets » and « ∆Debts »; Model (P2) the variables « M/B », « DY » and « POR »; Model (P3) the variables « M/B » and « Log MV ».
The model (P1) is significant with a pseudo-R2 of 8.06%. The probability that a manager of an SBF250 company pay a dividend is significantly positive (0.357; p < 0.01) and high when the market put a better price on payers. However, no significant relationship was found between the «investment opportunities» variables and the dividend decision;
The results of the model (P2) confirm the positive and significant associations found on bivariate models (1) and (3). This suggests that companies with higher levels of profitability are more likely to respond positively to shareholders demand for dividends;
The results obtained from the model (P3) also confirm the positive and significant impact exerted by the « size » on the probability to pay dividends (0.753; p < 0.01). The big is the size of the company; the high is the faculty that managers satisfy the investor demand for a positive dividend payment.
16
Table 6: Results of partials and full probit models –with random and temporal effects-
Explanatory variables
Predicted signs
Probit models –with individual and temporal
effects- Full probit model with random and temporal effects (P1) (P2) (P3) M/B (+) 0.357*** 0.322*** 0.220*** 0.2205** (4.00) (3.14) (2.35) (2.01) ∆Assets (-) 0.0016 - - 0.0008 (0.83) (0.34) ∆Debts (-) -0.00007 - - -0.0006*** (-0.39) (-3.41) DY (+) - 0.128*** - 0.115*** (3.32) (2.93) POR (+) - 0.074*** - 0.0796*** (10.74) (10.10) Log MV (+) - - 0.753*** 0.5552*** (6.60) (4.48) Constant 2.20*** -0.31 -12.87*** -11.348*** (6.98) (-0.79) (-5.75) (-4.62) Number of observations 2041 2041 2041 2041 LL = Log likelihood -369.76 -263.82 -339.02 -241.40 LL chi2 (p) 55.66*** 135.44*** 73.33*** 127.84*** Pseudo-R2 0.0806 0.3440 0.1570 0.3998
This table presents the results of the individual probit models examining the impact of the prevailing investors demand for payers on the probability that a manager initiates or continues to pay dividends. Parameter estimates are based on the following model:
PrሺYbin୧୲ = 1ሻ = Probitሺa୧୲ିଵMB୧୲ିଵ+ b୧୲VarAssets୧୲+ c୧୲VarDebts୧୲+ d୧୲ିଵDY୧୲ିଵ+ e୧୲ିଵPOR୧୲ିଵ+
f୧୲logMV୧୲+ g୧୲ଵଽଽଶΙଵଽଽଶ୧୲ + ⋯ + g୧୲ଶ଼Ι୧୲ଶ଼+ e୧୲ሻ.
where: e୧୲ = are the random effects of the model and Ι୧୲ ୷ୣୟ୰
= 1 if t = year and Ι୧୲୷ୣୟ୰= 0 otherwise;
Variable definitions:
Ybin = 1 if the ϐirm is a dividend payer, 0 otherwhise; M
B = market − to − book ratio; ∆Assets = variation in book assets; ∆Debts = variation in debts; DY = dividend yield; POR = pay out ratio;
Log MV = logarithm of market capitalization.
For each variable, the coefficient value is followed in brackets by the value of Wald (z) with the significance levels: *** (p<0,01), ** (p<0,05) and * (p<0,10).
17
Third, in the full model we test simultaneously all the independent variables and we find that (table 6):
Our full Probit model is significant with a pseudo-R2 of 39.98% compared to the constrained model. The probability that a manager starts or continue to pay dividends for shareholders is positively and significantly associated with the good valuation that the market assigns to companies with a positive dividend payment and characterized by big realized and/or accumulated profits, large size and low debt levels;
The significance and signs of the association between the profitability and size variables remain unchanged (p < 0.01). This shows that levels of « profits » and « size » influence positively the probability that firms become payers or continue to be payers.
The coefficient of the principal independent variable « market-to-book ratio » is positive but less significant (0.2205, p < 0.05) in the full model as in all other tested models. However, the coefficient of the variable « ∆Debts » is very significant in the full model unlike models (2) and (P2) where it wasn’t. The association is negative, which means that the level of debts affects negatively the probability of dividends payment;
Finally, only the coefficient of the variable « growth in assets » is not significant in all tested models.
18 5. Results discussing
The results of different Probit models are consistent with the hypothesis tested. The coefficients of the independent variables are significant (the significance varies between 0.01 and 0.10) and there signs are conform to those predicted. Only the coefficients on « ∆Assets » variable are not significant.
It appears that the decision to pay dividend is driven by prevailing investor demand for dividend payers and that manager’s start or continue to pay dividends for shareholders in the case of firms characterized by big realized and/or accumulated profits, large size and low debt levels.
In the French market, our findings are in part consistent with those obtained by Albouy et al. (2010). Conversely, our results are not consistent with those of Denis and Osobov (2005) and Ferris et al. (2009).
Thus, understanding our results need to keep in mind that our model is tested through Probit regressions on panel data taking into account some financials firms characteristics. By doing so, we test simultaneously the impact on dividend decision of « the catering theory » of Baker and Wurgler (2004a) and the financials firms characteristics as in Fama and French (2001).
Conclusion
The purpose of this paper is to test the « catering theory of dividend » and the effect of some financial firms’ characteristics on the dividend decision.
After collecting the data of French largest listed companies over the period 1990-2010, panel data analyses were conducted using Probit models. Regarding the obtained results, we are able to provide some concluding remarks:
19
On the results of the tested Probit models, it appears that the coefficients of most independent variables are highly significant (the significance level vary from 0.01 to 0.10).
The signs of these significant coefficients are consistent with those predicted for the majority of tested models (individual, partial and full Probit models).
In addition, only the coefficients of the investment opportunities variables are not significant, except for the coefficient on « growth in debts» which becomes significant in the full model.
By using a significant sample over a long period, we contribute to the literature on the determinants of dividend decision by studying simultaneously the « catering theory of dividend » of Baker and Wurgler (2004a) while taking into account some financial firms’ characteristics as in Fama and French (2001).
The findings confirm the significant impact exerted by investor demand for dividend payers on the probability that a manager decides to pay dividends for shareholders in the case of an SBF250 companies with large sizes and characterized by big profitability and low debt levels. The results are in part consistent with those related by Albouy et al. (2010) but not with those presented by Denis and Osobov (2005) and Ferris et al. (2009).
This area still remains underexplored in the French market and further researches are needed to provide additional support for the behavioral dimension -by proposing others significant proxies of mispricing- and to take more financial firms’ characteristics into account in a single model.
20 References
Albouy et al. (2010), « The Perception Of Dividends By French Managers: An International Comparison », Working paper, Université de Grenoble 2.
Allen F. Et Michaely R. (2003), « Payout Policy », Handbook of the Economics of Finance 1: 337-429.
Baker et al. (2004), « Behavioral Corporate Finance: A Survey », National Bureau of Economic Research Cambridge, Mass., USA.
Baker M. et Wurgler J. (2002), « Market Timing And Capital Structure », The Journal of Finance 57(1): 1-32.
Baker M. et Wurgler J. (2004a), « A Catering Theory Of Dividends », The Journal of Finance 59(3): 1125-1165.
Baker M. et Wurgler J. (2004b), « Appearing And Disappearing Dividends: The link to Catering incentives », Journal of financial economics 73(2): 271-288.
Bhattacharya S. (1979), « Imperfect Information, Dividend Policy, And The Bird In The Hand Fallacy », The Bell Journal of Economics 10(1): 259-270.
Bhattacharya S. (1980), « Nondissipative Signaling Structures And Dividend Policy », The quarterly journal of economics 95(1): 1.
Brennan M.J. (1970), « Taxes, Market Valuation And Corporate Financial Policy », National Tax Journal 23(4): 417-427.
Denis D.J. et Osobov I. (2005), « Disappearing Dividends, Catering Incentives and Agency Costs: International Evidence », Working paper.
Easterbrook F.H. (1984), « Two Agency-Cost Explanations Of Dividends », The American Economic Review 74(4): 650-659.
Elton J. et Gruber M. (1970), « Marginal Stockholder Tax Rates And The Clientele Effect », The Review of Economics and Statistics 52(1): 68-74.
21
Fama E.F. et French K.R. (2001), « Disappearing Dividends: Changing Firm Characteristics Or Lower Propensity To Pay? », Journal of financial economics 60(1): 3-43.
Ferris et al. (2006), « God Save The Queen And Her Dividends: Corporate Payouts In The UK », Journal of Business 79, 1149–1173.
Ferris et al. (2009), « Catering Effects In Corporate Dividend Policy: The International Evidence », Journal of Banking & Finance 33(9): 1730-1738.
Hamon J. et Jacquillat B. (1992), « Le marché français des actions: études empiriques
1977-1991 », Presses universitaires de France.
Hausman J.A. (1978), « Specification Tests In Econometrics », Econometrica: Journal of the Econometric Society: 1251-1271.
Jensen M. (1986), « Agency Costs Of Free Cash Flow, Corporate Finance, And Takeovers » The American Economic Review 76(2): 323-329.
John K. et Williams J. (1985), « Dividends, Dilution, And Taxes: A Signalling Equilibrium », the Journal of Finance 40(4): 1053-1070.
Li W. et Lie E. (2006), « Dividend Changes And Catering Incentives », Journal of financial economics 80(2): 293-308.
Miller H. Et Modigliani F. (1961), « Dividend Policy, Growth, and the Valuation of Shares », The Journal of Business, Vol. 34, No. 4 (Oct., 1961), pp. 411-433.
Miller M. et Rock K. (1985), « Dividend Policy Under Asymmetric Information », The Journal of Finance 40(4): 1031-1051.
Neves E. et Torre C. (2006), « Dividends: New Evidence On The Catering Theory », Working paper.
Poterba J.M. et Summers L.H (1985), « New Evidence That Taxes Affect The Valuation Of
22
Rozeff M.S. (1982), « Growth, Beta And Agency Costs As Determinants Of Dividend Payout Ratios », Journal of Financial Research 5(3): 249-259.
Shefrin H. (2001), « Behavioral Corporate Finance », Journal of Applied Corporate Finance 14(3): 113-126.
Shefrin H.M. et Statman M. (1984), « Explaining Investor Preference For Cash Dividends , Journal of financial economics 13(2): 253-282.