HAL Id: hal-01088439
https://hal.inria.fr/hal-01088439
Submitted on 21 Apr 2019HAL is a multi-disciplinary open access
archive for the deposit and dissemination of sci-entific research documents, whether they are pub-lished or not. The documents may come from teaching and research institutions in France or abroad, or from public or private research centers.
L’archive ouverte pluridisciplinaire HAL, est destinée au dépôt et à la diffusion de documents scientifiques de niveau recherche, publiés ou non, émanant des établissements d’enseignement et de recherche français ou étrangers, des laboratoires publics ou privés.
Modeling
Michel Bourdelles, Shuai Li, Imran Rafiq Quadri, Etienne Brosse, Andrey
Sadovykh, Emmanuel Gaudin, Frédéric Mallet, Arda Goknil, David George,
Jari Kreku
To cite this version:
Michel Bourdelles, Shuai Li, Imran Rafiq Quadri, Etienne Brosse, Andrey Sadovykh, et al.. Fostering Analysis from Industrial Embedded Systems Modeling. Alessandra Bagnato; Leandro Soares Indru-siak; Imran Rafiq Quadri; Matteo Rossi. Handbook of Research on Embedded Systems Design, IGI Global, pp.283–300, 2014, 9781466661943. �10.4018/978-1-4666-6194-3.ch011�. �hal-01088439�
embedded systems modeling
Michel Bourdellès, Shuai Li *, Imran Quadri**, Etienne Brosse**, Andrey Sadovykh**,
Emmanuel Gaudin***, Frédéric Mallet****, Arda Goknil****, David George*****, Jari
Kreku******
* Thales Communications & Security, ** Softeam, *** PragmaDev,
**** INRIA,***** Rapita,****** VTT Technical Research Centre of Finland
ABSTRACT
In most industrial embedded systems development projects, the software and the hardware development parts are separated, and the constraint requirements/capabilities are informally exchanged in the system development phase of the process. To prevent failures due to the violation of timing constraints, hardware components of the platform are typically over dimensioned for the capabilities needed. This increases both cost and power consumption. Performance analysis is not done sufficiently at early stages of the development process to optimize the system. This chapter presents results of the integration of tools and extra modelling to offer new performance analysis capabilities in the early stages of the development process. These results are based on trace generation from code instrumentation. A number of enhancements were made, spanning the system modelling stage down to the execution stage (based on an ARM dual core Cortex A9 based target board). Final results taken from a software based radio case study (including the analysis and validation stages) are presented.
INTRODUCTION
An industrial embedded systems development project comes within a global context including the respect of quality requirements, configuration management requirements and strong reporting and communications efforts with the system team, other parts of the system equipment development teams, and customers. A precise development process is defined to respect all these aspects. This process is, in the industrial domains concerned, driven by tests and based on system requirements validation.
Due to increases in system complexity, requirements validation has also become more complex. For example, the radio protocol domain faces new challenges and requirements due to increased execution platform component complexity. With the lack of proper tool support it is the responsibility of skilled architects to perform the complex and tedious task of validation. Consequently, the use of hardware platform modeling and enhanced performance verification is an identified issue in embedded system design environments.
The overall concept developed in this chapter is the ability to validate non-functional properties (such as performance) at an early stage in the development process. If an improvement in this area is achievable, a better fit of the software components to the execution platform is expected. To achieve this goal, new tools are introduced to existing ones. In this chapter, the project tools are defined, combined and integrated to create new design-space exploration techniques in the existing validation process. This allows the developer to better evaluate and test different allocation strategies of software components to the execution platform.
The addition of new tools to the development process must conform to the validation done by manual tests derived from requirements. It must not take too much extra development team effort in terms of time and the need for expertise.
The analysis must make the best use of existing validation environments. The methodology presented here will be based on traces already collected by test harnesses. These traces will be used to feed both functional and non-functional analysis tools. By reusing an existing validation environment, new tools and methods can be easily integrated into the current development process. As a complement, performance simulation is also studied.
We present in this chapter the results of the ARTEMIS collaborative project PRESTOError: Reference source not found. We illustrate how custom solutions from PRESTO (implemented in tools such as Modelio) were used to achieve trace generation and a verification flow that explores:
Modelling of a TDMA radio protocol.
Annotation of elements in a high level model for instrumented wrapper code generation. Functional and non-functional properties specification.
Verification of properties based on traces coming from the generated instrumented code. Performance simulation and evaluation with respect to execution on the target platform.
BACKGROUND
The PRESTO project aims to improve the software tools used in the recovery of information and extended specification data during the software development life cycle. The main information recovered from the software development process is a description of the software application as a set of interconnected components with their interface specified as input of the MARTE [2] profile, or specific domain-specific languages supporting software/hardware allocation. Also recovered are test traces from “classical” software test integrations on functional behaviors.
Software modeling, e.g. part of the MARTE profile, or any other similar language extension, supporting software and hardware allocation: the software component modeling specification will be done at the same time as the software design specification (Software Requirements Specification, Interface Requirements Specification). The definition of the components and their interface should be sufficient for performance modeling. This will require in particular a correlation between inputs and outputs on a trace-by-trace basis. Particular constraints, for example well-known timing constraints on components communication could be defined at this stage, to eliminate hardware platform candidates at the software/hardware allocation step. These constraints can also be specified outside of the software components modeling using test traces. Apart from the OMG MARTE profile, Domain specific languages such as SDLError: Reference source not found, EAST-ADL2 [4] and AADL [4] give a more precise semantic to timing constraints applied to components and communication between them. Specific modeling elements have been defined for timing requirements expression and their relationships with the system modeling elements.
Position with respect to the background: The design process adaptation presented hereafter is
based on the MARTE modeling specification, but may be adapted to any other Software/Hardware allocation modeling notation.
Formal modeling of properties: Requirements are specified on system specification documents, but they are described in natural language (functional or timing constraints requirements) and validated only in platform execution. We propose to specify the timing constraints formally to be used by the timing analysis tools in addition to the model of the software/hardware allocation modeling and of a model of the application, more precisely execution scenarios describing the application actions on the platform components. The format and expressiveness of these timing properties are defined in the project jointly with timing tools analysis providers. Since timing
constraints are closely related to sequences of actions defined in the functional requirements and behavioral models, formal models of properties will link both functional and non-functional properties. This is consistent with the MARTE approach to modeling.
Position with respect to the background: The notation for the modeling of properties leads to
find the better trade-off between the power of properties expressiveness from analysis tools, and industrial requirements in the variety of notations and easiness of understanding.
Timing Constraints: the timing constraints will be present in the scenarios description specification, and be formally described in the test scenarios as timing constraints between two or more actions of the scenarios. These constraints will be specified in a correct formal notation and may include constraints on rate, latency, jitter, synchronization etc. A mixed notation of timing and temporal logic will be studied in the project. This may include the derivation of timing constraints from temporal logic.
Position with respect to the background: Full exploitation of the accurate information that may
be cached in the traces is expected to be potentially used for the analysis.
Test trace generation: different levels of expressiveness can be generated depending of the kind of properties to be verified: Message exchange, Function calls, Host timing results, Variables assignments, Time tags etcetera. A set of information will be defined in respect with the kind of property being analysedanalyzed and the capabilities of the analysis tools.
Open Trace Format [6] is a trace definition format for high-performance computing platforms. OTF addresses three objectives: openness, flexibility and performance. From the traces, specific libraries and tools (e.g. VAMPIR, VITE, etc…) allows for visualizing or searching through the traces, with OTF file generated after code instrumentation. The Program Database Toolkit (PDT) [7] may be used to analyse the code for automatic instrumentation by the Tuning and Analysis Utilities (TAU) tools.
Position with respect to the background: The process flow adaptation presented hereafter
presents results with the PragmaTracer and RapiTrace tools, but is independent of a specific code instrumentation and trace generation toolset.
In a similar manner, the main information recovery of the hardware development flow process includes: Hardware modeling: the description of the hardware platform and its modeling using the DRM
(Detailed Resource Modeling) sub-profile of the MARTE profile. This modeling should be smoothly integrated to the hardware design flow. At this stage several architectures may be specified and modeled by the prototyping tool and compared with software components and architecture.
Comparison between timings analysis and execution: To validate the timing analysis results, they have to be compared with real platform execution analysis. To this aim the proposed solution is to compare timing results with the execution (or simulation) of the application on the platform at different levels of granularity (e.g.: single function, full trace…).
The results will allow the adaptation of the parameters needed for predicting performance using timing analysis. The transition between functional simulation and execution is typically gradual; the verification of those parts where design has proceeded further should be possible quickly. Therefore, mixed situations have to be taken into account.
Fast platform prototyping tool definition : To this aim, we propose in this project to define a -as- fast -as possible- platform prototyping tool, based on the MARTE UML profile for embedded systems, or using existing hardware and software architecture modeling languages. This will be
used to describe the allocation of the software components on the annotated platform to provide performance verification, such as timing analysis in respect with specific software/hardware allocation, scheduling analysis, performance dependence on hardware parameters and the best proportion of the hardware components to respect the performance constraints given.
Use of the test traces as entry point of the property and performance analysis environment to
design: The sequences of actions in traces are exploited as the behavioral representation of the
system. The objective of this project is to benefit from these sequences of actions and to use them as an entry point to performance analysis tools. Actually, test scenario specifications consist of a first level of sequences of actions that are validated in the integration phase from message receipts of the external interface of the whole system to verify. The test framework may generate more accurate information, such as message passing between components, function calls, host execution timing information and variables assignments. This information is generally used to help the debug of the system but is not fully interpreted. As these traces contain huge functional information, we propose in the project to exploit them for functional as well as non-functional property verification through two directions: from explicit property specification, as available from the formal modeling of requirements and by inferring properties or sequence patterns from traces.
Simulation results confrontation with the real platform execution: As the modeling of the platform is not supposed to be designed by a hardware expert and should be as fast as possible, one key of top-down analysis from the application to the platform execution is the level of confidence in the fast prototyping tool performance predictions. The solution to validate this modelling is to compare the predicted performance with the real execution on the platform for different classes of systems used as benchmarks, in order to identify the dominant parameters for suitable platform modeling.
RATIONALE OF THE APPROACH
1. New analysis needed
Evolutions in industrial Real Time Embedded Systems (RTES) led to new challenges in their design process. By nature, RTES are constrained by the limited amount of resources available (e.g. computing time, power, and memory size). These constraints need to be taken into account in the engineering process. Requirements on such systems led to the need to adapt the current design process in order to analyze both functional and non-functional (F&NF) properties in the mapping of an application to a specific platform.
2. Status of industrial flow in the verification of RTES
Current analysis applied in the industry is mostly based on intensive testing of the system. Much development time is allocated to design of test scenarios and implementation of such tests. On the other hand, although wrapper code is currently generated from component based modeling of the application, abundant analysis techniques based on a Model-Driven Engineering approaches are usually not used in the design process. In the current situation, functional assessment is processed on host, and performance evaluation is processed only at the real integration on the hardware platform.
3. Requirements on Industrial Integration of analysis tools
a) No change in the methodology (waterfall cycle, iterative development): Regarding the global requirements of a project, due to technical, management, quality and customer requirements, a development methodology is defined for the development process. The new tools have to fit these methodology choices.
b) No design environment, test tools, and specific languages required by the tools: the choice of the design and test environment is also the result of a trade-off and can't be imposed due to purely technical aspects (formalization capability in regards with the license cost of a design environment, habits of a development team or a specific embedded systems design environment). It may also be imposed by the customer. The tools developed in PRESTO must refer to standards and be modular, with no impact on the global development environment.
c) Easy use of the new tools to formalize, press button usage, weak need of experts to specify the
platform: The complexity of the analysis tools reduces their use by the product development team.
Particular attention must be paid to the smooth use of the tools to formally specify requirements at the specification phase and in the detailed conception phase. Extra analysis of test trace exploitation must be done with a simple and effective interface.
d) No loss of time, gain and loss evaluation by the use of the new design framework: Time is one of the most critical criteria in industrial development projects when guiding choices in which design environment and analysis tools to use. The time for extra specification must be as small as possible. e) No specification effort without being analyzed: Precedent use of UML profiles for embedded
systems failed in industrial development because the analysis capability was considered weak in comparison to the modeling effort. We propose to specify in MARTE only what is needed for the non-functional requirements analysis and can be analyzed by the available or to-be-developed tools. f) Gain and loss evaluation, in particular result analysis evaluation with real platform execution:
to be accepted, new tools in the development process must have the impact of their use evaluated. These tools will be compared to the current process of software integration. The specific time to specify the hardware architecture and the efficiency of performance optimization and verification will be evaluated.
4. Fostering analysis based on traces: the PRESTO approach
To foster analysis for functional & non-functional analysis based on a smooth adaptation of the current flow, code instrumentation, execution trace generation and extra modelling are added. For modelling, structural models of systems, platform models (e.g. operating system, hardware), properties specification and behavior information as sequence diagrams are integrated into existing models used by engineers. Instrumented code is then generated from the model. Existing test scenarios are run with the instrumented code so execution traces can be generated. Execution traces and models are finally checked by the analysis.
SOLUTIONS AND RECOMMENDATIONS
1. The PRESTO method
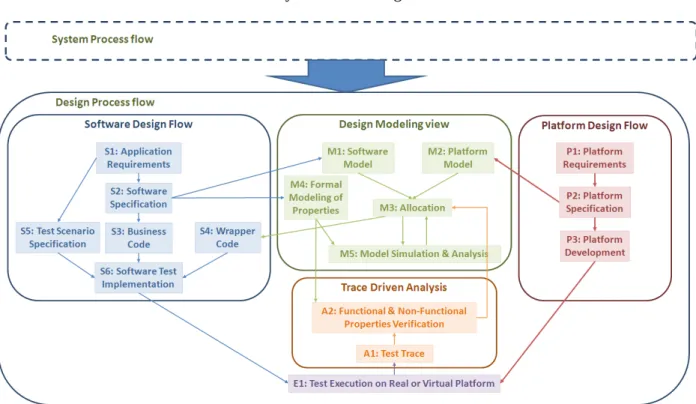
The PRESTO method can be summarized by the flows in Figure 1.
Figure 1 PRESTO Method
The general idea behind this method is to re-use existing elements in a product’s development cycle, while appending analysis possibilities coming from the project. The goal is to integrate the new possibilities into the development cycle without breaking existing engineering processes. For example the software and platform (e.g. hardware and OS) design flows are ones that are already part of the development cycle, while the project adds the ability to explore designs at system level and exploit execution traces that are obtained by using existing software and platform elements. The PRESTO method is thus applicable to an industrial development cycle, if it follows the software and platform design flows described in Figure 1.
a. Software Design Flow
The software design flow is the process used to develop the specific software (or application) for the system (i.e. business code). In this process, the application’s requirements are first defined (S1). From the requirements, software specification documents are created (S2). These specifications lead to the development of the business code (S3) which is specific to the application. Parallel to the process leading to the business code development, software test scenarios are specified (S5) according to the application’s requirements. The test scenarios are then implemented (S6) using the business code (S3) and wrapper code (S4), which is generated separately.
b. Platform Design Flow
Much like the software design flow, the platform design flow is the process of developing a specific platform for the system. In this process, the platform’s requirements (P1) are defined at first. This leads to platform specification (P2) documents being elaborated, from which a new hardware platform is developed (P3) or an existing one is chosen (which conforms to the specification).
c. System Design Modeling
The system design modeling parts (M1) and (M2) are, in the PRESTO process, the place in which the allocation (M3) of software application components to platform modeling is captured. This information is mandatory for any early stage performance analysis of the application. This modeling does not prerequisite deep modeling of the application as full behavior specification. The exploitation of this modeling is mainly used for wrapper code generation on different target platforms. The advantages of this code generation are manifold: ease of portability and full exploitation of the structural view information in the model in addition with software/hardware allocation information.
The system design modeling phase is also the place in which behavioral information from the system level design may be captured and mixed with performance information as sequence diagrams with timing constraints to express requirements (M4). This information uses the component interfaces access actions as atomic elements of this specification. This information is exploited to verify the requirements in the final implementation from trace generation as expressed in the following section.
d. Test Execution and Trace Driven Analysis
Capturing a system’s behavior through traces and analyzing the traces to verify properties are the heart of the PRESTO project. Once software tests have been implemented on a platform (that can be virtual at first), they are executed (E1), outputting execution traces (A1). These traces are used to analyze both functional and non-function properties (A2) that have been modelled formally previously.
The following section will show some examples of tools in the PRESTO project that are used in the system level exploration and trace driven analysis.
2. Tools used in the PRESTO Method
The different steps in the PRESTO flow uses tools from the project’s partners. Let us describe here some examples of these tools, focusing on the ones that we used for a THALES case-study that will be presented later in this chapter.
Tool Name Type Used in step Description
Modelio Modeller Software Model, Platform Model, Wrapper
Code Generation, Properties formal modeling Modelio is a CASE tool including a UML modeler. Modelio has the capacity to create viewpoints with specific meta-models created using MARTE sub-profiles. A viewpoint corresponds to a diagram where commands only allow specific elements to be created (e.g. hardware components in a hardware model diagram). The goal behind this is to filter MARTE and help the designer use the profile.
TimeSquare & CCSL
Formal modeling of properties and analysis tool
Formal modeling of properties and early stage analysis
TimeSquare is an MDK (Model Development Kit) provided as a set of Eclipse plugins that can be downloaded or installed into an existing Eclipse installation. TimeSquare is based on the formal Clock Constraint Specification Language (CCSL), which allows the manipulation of logical time. Logical time is a relaxed form of time where any events can be taken as a reference for counting (e.g. do something every 30 openings of the door). It can be used for specifying classical and multiform real-time requirements as well as formally specifying constraints on the behavior of a model (either UML-based or a DSL model). These constraints are solved and a simulation is conducted at the model level.
PragmaDev Tracer Properties specification, trace generation and analysis tool
Functional and non-function analysis and test trace generation
PragmaDev Tracer is a tool for requirements, properties, and traces specification, using a graphical Message-Sequence Chart (MSC) representation. Requirements and properties can be expressed in MSC and traces can be obtained online or offline with the tool. Analysis is done by exploiting both the properties expressed in MSC and the traces.
RVS Timing analysis, constraints checking and execution tracing tools
Functional/non-functional analysis and performance evaluation
RVS (Rapita Verification Suite) consists of a suite of tools supporting instrumentation, tracing and analysis of time constrained embedded software. RVS analyses traces taken from on-target execution, based on instrumentation points inserted into software at the source code level (supporting C, C++ and Ada). Traces are then collected from an on-target execution, allowing analysis of multiple execution properties. Timing constraints can be checked using RapiTime, while code coverage and execution tracing can be covered using the RapiCover and RapiTrace tools respectively. In the PRESTO project, Rapita have also developed a constraints checking tool called RapiCheck, allowing developers to verify high level constraints (such as function ordering and execution times) against an execution trace performed on target.
ABSOLUT Early-phase performance
estimation tool
Software Model, Platform Model, Allocation, Model simulation and analysis
ABSOLUT is a system-level performance and power consumption simulation approach which
follows the Y-chart model. It is based on the virtual system approach, where abstract models of
both applications and platforms are used and thus it is intended for early evaluation. Applications
are modelled as workload models consisting of processes, functions, basic blocks and,
ultimately, abstract instructions read, write, and execute. The workload models are allocated on a
platform model, which consists of computation, communication and storage resources organised
as subsystems. The allocated system model is simulated using transaction-level SystemC and
performance and power data is extracted using probes incorporated into the workload and/or
platform models. The probes are able to extract information about e.g. resource utilisation,
execution time, latencies, etc.
EXPERIMENTS ON APPLYING THE PRESTO METHOD
The PRESTO method was applied on an industrial case-study from THALES. The following sections describe this experiment’s case-study, the experimental results and lessons learnt from applying the PRESTO method.
1. Radio Protocol Case Study
Pieces of application description:
The case-study used for the experiment is a TDMA radio protocol. A radio protocol is embedded in communicating stations as part of a mobile ad-hoc wireless network. The use case proposed for the
PRESTO validation features is a static TDMA application, implementing generic services, as
initialization, emission, reception and synchronization provided by a TDMA service.
The TDMA service handles protocol specific functionalities while the control of its state
(transmission, reception, idle) or its configuration is managed by a dedicated Network Controller
(NC). The latter orders the TDMA service to send or receive data through the physical layer,
which is managed by another specific component. Data gathered by the NC is transmitted to
applicative layers if necessary. Error: Reference source not foundError: Reference source not
found
Pieces of platform description:
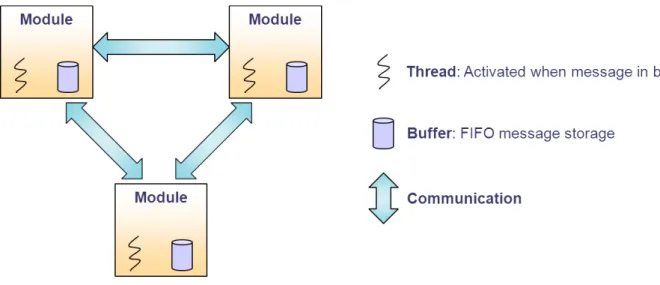
Figure 2 shows the system’s architecture from a software point of view.
Figure 2 TDMA Radio Protocol Case-Study
The application is divided into several modules. Each module is implemented as a thread and a buffer. Threads communicate with each other by sending messages to each other. The messages are stored in the buffers when they arrive.
All the tools took this application as a case study, except for performance simulation (ABSOLUT tools set) on which an inner component’s (Medium Access Control) single task processes were simulated with performance requirements within an order of a few milliseconds (around 5 milliseconds).
2. Application of the PRESTO Method
a. Modeling
The PRESTO method was applied on this application to verify its properties. To apply the method’s concept, we developed a specific solution. First the application had to be ,modeled; then instrumented code was generated from the model. Afterwards instrumented code was executed and execution traces were generated. Traces were finally exploited by analysis tools to verify properties.
The radio protocol case-study is well suited for a component-based modeling. Indeed each module can be modeled as a component. Modeling was done in Modelio using specific viewpoints developed for the PRESTO project. Some examples of the viewpoints are the following:
Application Diagram: Component-based model with functional components connected by ports. Interface Definition Diagram: Definition of interfaces and operations implemented by the
functional components’ ports.
Type Definition Diagram: Definition of data types, enumerations typing a interface’s operation’s parameters.
Hardware Diagram: Hardware components, e.g. processors and cores.
Allocation Diagram: Shows how components in the application are allocated onto components in the hardware.
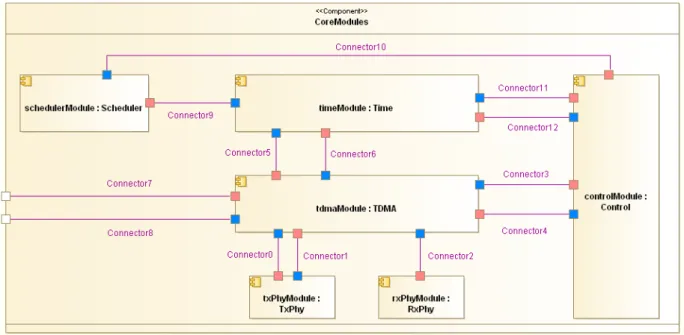
Figure 3 shows an example of an Application Diagram in Modelio. In this figure, we see how the radio protocol’s modules have been modeled as UML components inter-connected through ports.
b. Instrumentation code selection and generation
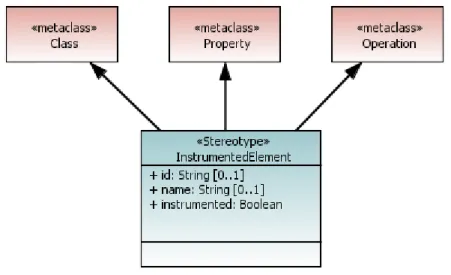
To generate instrumented code from the model, a new UML profile was created. This profile is shown in Figure 4.
Figure 4 Instrumentation UML Profile
The <<InstrumentedElement>> stereotype is applied to a class, a property or an operation. It can thus be applied to a component, port and an interface’s operation. When applied to a component, the user can choose if instrumented code will be generated for the whole component. When applied to a port, the user can choose if instrumented code will be generated for all operations of the port. Finally when applied to an operation, the user is able to choose if a specific operation is instrumented.
The <<InstrumentedElement>> stereotype has three attributes:
id: Indicates the element’s real identifier in the real application (if model names differ from the real application).
name: Indicates a user-friendly name different from the element’s name in the model. This can be displayed during trace visualization.
instrumented: Boolean that indicates if the element is instrumented or not.
A Modelio plug-in was developed to explore the model and generate instrumented code from elements stereotyped <<InstrumentedElement>>. The plug-in generates wrapper code for the application’s modules (components). Generated instrumentation points were PragmaDev Tracer macros.
c. Trace generation and analysis:
Once the instrumented wrapper code had been generated, along with the business code, the application was run. During execution, whenever an instrumentation points is hit, data is sent to the PragmaDev Tracer, which can then display the application’s execution trace.
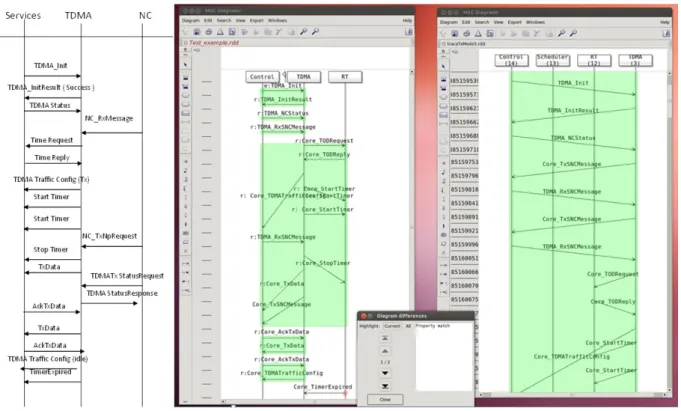
Once the application has finished, PragmaDev Tracer can export the trace and then analyze it by comparing it with message sequence charts specified in the tool. The specified MSCs represent properties to be verified. Figure 5 shows an example of comparing an MSC specified in the tool and an MSC generated from an execution trace. The initial scenario to be validated from preliminary design specification is presented in the left part of the figure, with its translation as a property in the
PragmaTracer tool in the middle of the figure. Trace generation of message sequences are presented in the right part of the figure. Property matching analysis helped to validate the initial scenario is verified. (The Services and NC initial lifelines are groups in the Control lifeline (activator). Timing accesses of the services are separated.
Figure 5 PragmaDev Tracer MSC Comparison
Instrumentation is also a critical part of analyzing code using Rapita’s RVS toolkit. However, the
RVS instrumentation approach utilizes source code which has previously been written or
generated, rather than attempting to add instrumentation at code generation time.
To facilitate this, RVS is integrated with the users build system and existing code base. This
involves running the RVS instrumentation and structural analysis tools as part of the build
process for the user’s application. This allows calls to an instrumentation library to be added to
the source code of the application. These calls will generate a trace when the instrumented code
is built and executed on the intended target. Instrumentation libraries often differ based on the
specific platform they are targeting, as the method for generating a trace is often platform
specific and may use memory, IO ports or writes to disk depending on available hardware
resources. Structural information is also generated to give context to the trace at analysis time.
Once RVS has been integrated into the user’s build system, binaries can be generated containing
calls to the instrumentation library. When these binaries are run on the target platform, traces are
collected. The method of trace collection varies based on the specifics of the integration library,
but may involve simply copying trace files or, for more resource constrained targets, collecting
trace files from a debugger or logic analyzer.
The generated trace is then analyzed using a suite of GUI tools. In the PRESTO project, much of
the analysis of traces has been performed using RapiTrace, a new prototype developed for the
PRESTO project. RapiTrace allows the user to visualize the on-target execution of their code at
function and task level, providing detailed information on observed timings and task/function
execution patterns.
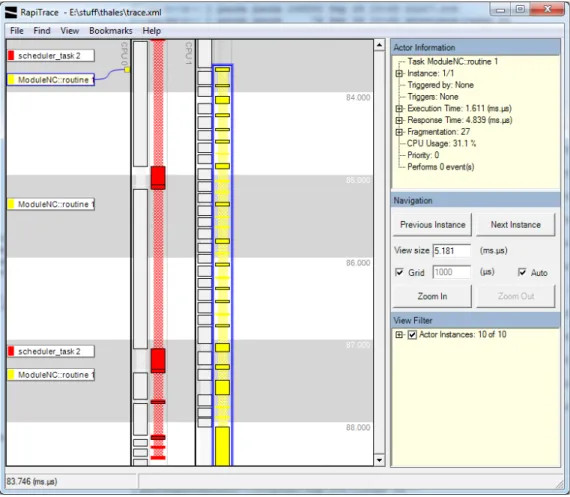
Figure 6 RapiTrace Viewer showing ‘task view’ in the TDMA radio case study.
Figure 6 shows RapiTrace displaying an on-target execution of the TDMA radio case study. In
this instance, two threads are displayed in ‘thread view’, showing only when two high level tasks
were executing and when they were idle.
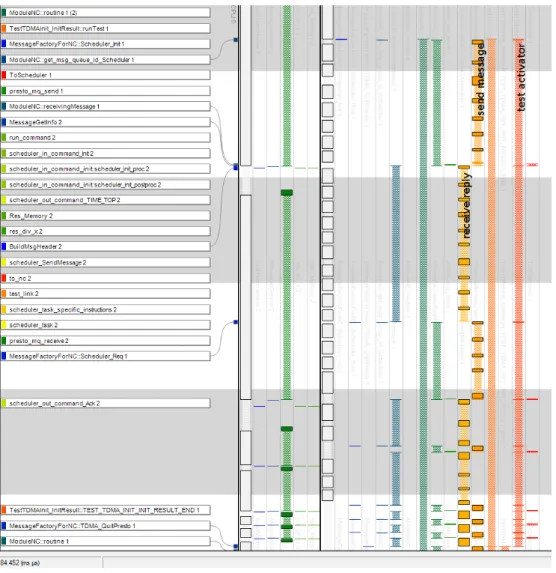
Figure 7 illustrates the same execution but in ‘function view’, showing all functions which
executed on the target and the amount of time they were observed to execute for. Rather than
segregating functions into their respective tasks, all functions are shown in this view, allowing
for detailed analysis of execution on-target as it occurred. Detailed information on execution
timings and patterns taken from real execution on-target allows developers to better troubleshoot
execution timing issues and verify performance criteria from high-level models.
d. Functional and Non-Functional Analysis
PRESTO methodology combines several technologies and tools. For instance, it combines UML/MARTE models with MSC diagrams. It also supports several formats of traces. This interoperability is achieved through the use of standards (MSC, UML/MARTE) and through the use of common notations. Only a subset of UML/MARTE has been selected to ensure that analyses are possible. Aside the component model (shown in Figure 4), UML interactions and activities can be used to capture functional and non-functional properties to be checked. These models are adorned with MARTE stereotypes when temporal references are needed.
Figure 7 RapiTrace Viewer showing ‘function view’ in the TDMA radio case study.
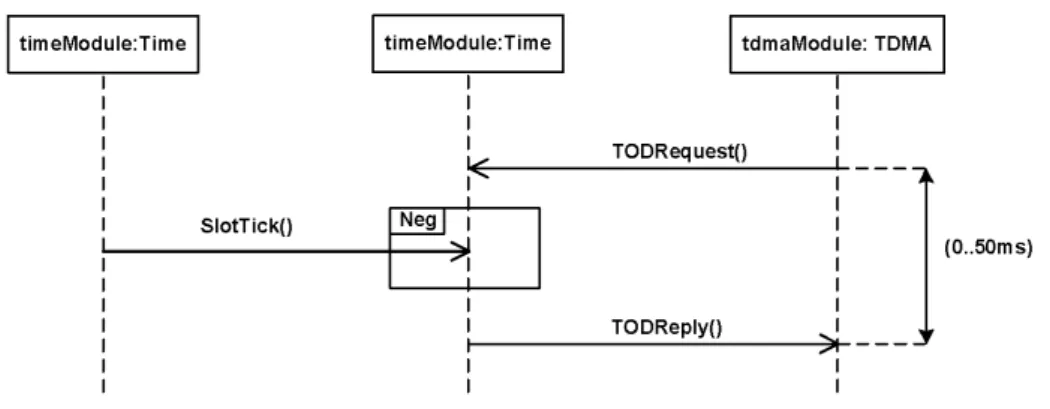
Figure 8 gives a simple example of functional and non-functional properties to be checked.The functional property part concerns the component Time and demands that no SlotTick be received between the reception of a request (TimeOfDay Request) and the emission of the corresponding reply. This functional property is captured through a negative combined fragment denoted Neg.
The non-functional property part focuses on what happens on component TDMA. It requires that there is a maximum duration of 50 ms between the sending of a TODRequest message and the reception of the reply message. This is captured through a duration constraint. Note that, the unit (here ms) is one of the
important construct provided by MARTE in its Non-Functional Property sub-profile and that was not supported by the standard UML notation.
Figure 8 – PRESTO property notation: example validated on traces
TimeSquare can be used to verify that a given trace satisfies these two properties. Within PRESTO, on this particular case study, around 29 properties (functional or non-functional) have been identified, which may be merged or split on diagrams using the property notation defined within the project.
The process is complementary from the verification performed in 2.c. It can support uniformly both functional and non-functional properties. TimeSquare transforms through a high-order transformation the UML/MARTE interaction into a CCSL specification. The Clock Constraint Specification Language (CCSL) [7] has been defined in an annex of MARTE as a language dedicated to the specification of functional and non-functional properties and is designed around the notion of logical clock [9] borrowed from synchronous languages [10]. A CCSL specification can be used to generate Java observers [11]. An observer [12] is a simple automaton usually generated to perform model-checking but it can also be used in simulation. In our case, the observer browses the trace and emits a violation message when the trace violates the property. Here, there are two cases of violations. Either a SlotTick is received between a request and a reply, or the reply is received from TDMA more than 50 ms after the request was sent. In PRESTO, several trace formats are supported. The observer can used PragmaDev traces, but can also use other formats. This can prove handy when running the code on targets with only limited resources, in which cases, specific target-specific formats should be used. To be agnostic of the trace format actually used, PRESTO methodology recommends using a common Trace API. The observers generated by TimeSquare uses this common API rather that depending on a specific trace format.
e. Performance estimation:
During this step, the performance of the application on an OMAP4-based target platform was estimated using the ABSOLUT [13] approach. A capacity model of the OMAP4 platform model was created utilising the publicly available information about the platform. The model contains component models of the two ARM Cortex A9 processors, crossbar interconnect and SDRAM memory. These component models were instantiated from the ABSOLUT model library. The hardware accelerators of the OMAP4 platform were not included in the models since the aforementioned documentation did not cover the capabilities of those components in enough detail. Thus, the application was utilising only the ARM processors of the platform and was not hardware accelerated.
ABSOLUT uses abstract workload models of applications during simulation. For this case study, the workload models were automatically generated from the application source code using ABSINTH2 [14], a GCC-based workload model generator, on an Intel x86_64 workstation. Since ABSINTH2 does not yet support code optimisations, the effect of optimisations was taken into account by scaling the workload models down with a correction factor C = Iopt/I, where Iopt and I are the number of instructions in the
optimised and un-optimized application, respectively. The capacity model of the platform in ABSOLUT uses statistical models of instruction and data caches. The values for the hit probability parameters of the caches were obtained with Cachegrind.[15]
f. Host and target code execution:
Results and Discussion
After conducting the experiment, several lessons were learnt. The following section evaluates the described solution.
Integration in the Development Cycle
The developed solution integrates well into the THALES development cycle. First of all the model uses a component-based approach which is common practice in radio protocol development. The UML profile for instrumentation adds stereotypes to be applied on existing elements in the model so it does not ask for model structural or behavioral modification. Finally the strategy to instrument only the wrapper code does not interfere with business code development.
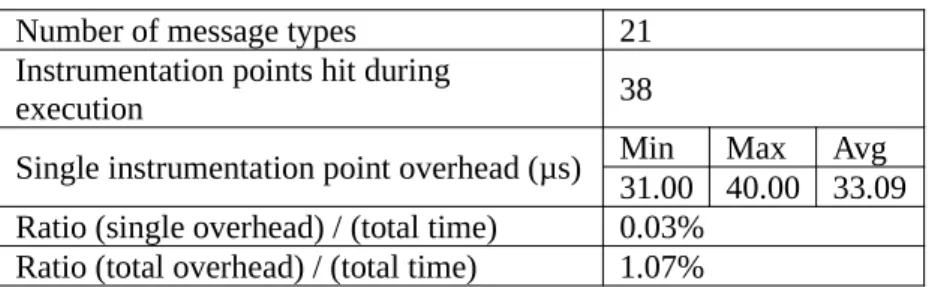
Instrumentation Overhead Evaluation
Experiments have been applied on a Pandaboard ES target with an ARM Cortex A9 (700 MHz, L1: 32K instruction 32K data, L2: 1M) and 8G DDR2 800MHz using Linux 3.2.14 with gcc 4.5.3. The analysis strategy using code instrumentation and execution trace generation is only valid if real-time constraints are not violated by the instrumentation overhead. Table 1 shows results on measured instrumentation overhead.
Table 1
Instrumentation Overhead
Number of message types 21
Instrumentation points hit during
execution 38
Single instrumentation point overhead (µs) Min Max Avg 31.00 40.00 33.09 Ratio (single overhead) / (total time) 0.03%
Ratio (total overhead) / (total time) 1.07%
The instrumented execution does not result in any missed deadlines when they are equal to 100ms, the smallest deadline in the application. On the other hand in other radio protocols, deadlines are on the scale of 1ms. A maximum of 30 points would then be allowed. In the experimental execution, deadlines would have been missed. With the instrumentation method developed, the overhead can be limited by choosing the number of instrumentation points at the model level.
Analysis Results
The analysis by PragmaDev Tracer gave several results. First of all it was observed that certain test scenarios had more messages exchanged than expected, although the scenario’s general steps were followed. In other scenarios, bugs were solved by comparing specified message sequence charts with the execution traces.
Performance simulation results
The performance simulation has been demonstrated on a specific Medium Access Control (MAC) radio resource allocation processes. The one called TCHAllocation particularly dimensioning in terms of time consumption of the MAC processing on TDMA frames.
The system model in ABSOLUT consists of the workload models of applications allocated on the components of the capacity model of the platform. The system model was simulated to estimate the execution time of the application and individual functions on the target platform. The longest time was spent on TCHAllocation function, one iteration of which took 4067 µs according to the simulation run. For comparison purposes, the real application was measured to execute in 4814 µs in the real target platform, resulting to an error percentage of -15%. This is in line with the accuracy level expected from virtual system simulation approaches in the evaluation metrics provided at the beginning of the project.
Conclusion on the experiment
Among the advantages of applying the PRESTO method in our experiment, we can mention that bugs were found, and unexpected behaviors were detected. The developed solution to apply the PRESTO method also integrates well into the development cycle. On the other hand instrumentation overhead can break application deadlines and this is a real issue since the PRESTO method is heavily based on execution trace generation. However, experiments on a real application have shown for F&NF properties verification the number of instrumented points is limited with a small impact on performance overhead. Experiments on performance simulation met the overhead ratio targeted with respect to the on board execution.
FUTURE RESEARCH DIRECTIONS
In the future research directions, we plan to work on a more important exploitation of the information modeled in the specification, in particular the platform, in order to tune them at application level from automatic code generation. One other research direction is to use traces as an input to performance analysis tools, as model level simulators, or performance estimates from one target execution to another, in order to realize as accurate as possible an estimate of design space exploration at a high level of platform modeling. Moreover, efforts are also focused on a more integrated toolset with an optimized exploitation of properties specification at modeling level (as in Modelio) by trace analysis tools (as PragmaTracer analysis tools), by property code generation.
CONCLUSION
This chapter presents the results of the addition of extra specification in order to offer performance capabilities at the early stage of the embedded software development life cycle. This flow adaptation is mainly based on trace instrumentation and generation. Enhancements are applied to the specification with new annotation capabilities and instrumentation of the wrapper code generated. Analysis of properties from trace generation has been validated. The known issue of timing overhead due to code instrumentation has been proved as limited for the instrumentation points needed for the properties verification defined at modeling level.
REFERENCES
[1] http://www.presto-embedded.eu, access october 2013. [2] http://www.omgmarte.org, access october 2013.
[3] http://www.sdl-forum.org, access october 2013.
[4] http://www.atesst.org, access the october 2013.
[5] http://www.aadl.info, access the october 2013.
[6] http :// www . paratools. com / otf.php, access october 2013.
[7] http://www.cs.uoregon.edu/Research/pdt/home.php, access october 2013.
[8] C. André, F. Mallet, R. de Simone: "Modeling Time(s)". ACM/IEEE Int. Conf. On Model Driven Engineering Languages and Systems (MoDELS/UML'07), TN, USA. LNCS 4735, pp. 559-573, Springer. (2007)
[9] C. André, J. DeAntoni, F. Mallet, and R. de Simone. The Time Model of Logical Clocks Available in the OMG
MARTE Profile. Synthesis of Embedded Software:Frameworks and Methodologies for Correctness by Construction, chapter 7. Springer Science+Business Media, LLC 2010 July, pp. 201-227.
[10] Benveniste, A., Caspi, P., Edwards, S.A., Halbwachs, N., Le Guernic, P., de Simone, R.: The synchronous
languages 12 years later. Proc. of the IEEE 91(1). 64–83. (2003)
[11] Frédéric Mallet. Automatic generation of observers from MARTE/CCSL. 23rd International Symposium on
Rapid System Prototyping (RSP'12), pp. 86-92, December 2012, Tampere, Finland, IEEE. (2012)
[12] N. Halbwachs, F. Lagnier, and P. Raymond, Synchronous observers and the verification of reactive systems, in
AMAST ’93: Proc. of the Third Int. Conf. on Methodology and Software Technology. London, UK: Springer-Verlag, 1994, pp. 83–96.
[13] J. Kreku, “Early-phase performance evaluation of computer systems using workload models and SystemC”, Acta Universitatis Ouluensis. Series C, Technica 435, 2012, 106 p.
[14] J. Saastamoinen and J. Kreku. "Application workload model generation methodologies for system-level design
exploration." Design and Architectures for Signal and Image Processing (DASIP), 2011 Conference on. IEEE, 2011.