Developing a Risk Management "Flight Simulator" for Manned
Space Programs:
A User Interface to a Systems Dynamic Simulation of System Safety
at NASA
by
Stephen R. Friedenthal
S.B. Nuclear Engineering, Massachusetts Institute of Technology, 1992 Submitted to the System Design and Management Program in
Partial Fulfillment of the Requirements for the Degree of
Master of Science in Engineering and Management
at the
Massachusetts Institute of Technology February 2004
2004 Stephen Friedenthal All rights reserved
The author hereby grants to MIT permission to reproduce and to
distribute publicly paper and electronic copies of this thesis document in whole or in part.
Signature of Author
11 71-)
Stephen Friedenthal System Design and Management Program February 2006
Certified By
Nancy Leveson Thesis Supervisor Prof or o eronautics and Astronautics
Patrick Hale Director System Design and Management Program Certified By Page 1 of 118 MASSACHUSETTS INSITfJTE OF TECHNOLOGY
JUN 2
1
2006
LIBRARIES
BARKER
Abstract
Simulators are a staple of any engineering project and manned space flight in particular. From pilot and crew training to maintenance and emergency repairs, very little is done without it first being thoroughly practiced and refined during advance simulation. Whether the simulation uses a computerized flight simulator that recreates the physics and experience of flight, or a simple mock-up with paper cutouts and hand tools, the end result is the same: people learn to make better and safer decisions through advanced simulation and practice. However, there are no simulation tools in use to help NASA managers to understand the dynamics of systemic risk, or how to evaluate the inherent risk within an organization.
This thesis describes the development of a risk management simulator that will enable NASA managers to explore the dynamics of risk using an advanced system dynamics simulation of the NASA safety culture prior to the Columbia Shuttle accident. This simulation model was developed by MIT Professor Nancy Leveson and her students as part of a NASA USRA research grant and has over 700 variables and several sub models. While the model is eminently useful to those familiar with system dynamics, the Vensim software application and the specific model structure, it is not very useful as a learning tool for those who are not.
The simulator tool developed for this thesis simplifies and consolidates the overall model behavior into 8 decision variables and 35 display variables. Moreover, 18 of those display variables are grouped into one of 5 categories of "leading indicators" of risk. This simulator enables any user to quickly begin to explore the system model and to discover the consequences of different decisions on system risk, without any need for the user to know system dynamics theory or any details of the model design. In a video game the user doesn't know how it is programmed, but is still able to learn the rules of the game, how it behaves and-most importantly-how to win. Similarly, the goal of the risk management flight simulator is to help NASA managers to learn the rules of system risk, how system risk behaves in response to management decisions, and, most importantly, how to make the best informed risk decisions.
Acknowledgements
A little under three years ago I showed my wife, Michele, a brochure I had just received describing MIT's SDM program. Michele's response was immediate, enthusiastic and supportive, "You have to do this. It's perfect for you!" As I type these last sentences for my thesis and reflect upon the past two years-January "boot camp," two summer sessions, many, many long nights and weekends and two children-I cannot begin to express my gratitude as you have been with me all the way. Michele, thank you. I love you. I couldn't have done this without you.
My thanks also to my son, Eliot, who at the age of two exclaimed during my first week of classes, "Daddy's going to ABC!" and has maintained that wonderful joy throughout the last two years of his life.
I especially want to thank my advisor, Nancy Leveson, whose kindness, wisdom, patience, great humor and support has helped to make this the most wonderful academic experience of my life. I feel truly blessed to have had the privilege to work with you.
Finally, I would like to acknowledge a few of the people in SDM without whom my life would be poorer without: Fellow SDM students Ram Krishnaswami, Fernado Cela and Mal Atherton, and on the SDM staff, SDM administrative coordinator, Ted Hoppe for his support, humor and introducing Eliot to bowling, and SDM Directors' Pat Hale and Denny Mahoney.
Table of Contents
Abstract ... 2
A cknow ledgem ents... 3
Table of Contents ... 4 List of Figures ... 7 List of Tables ... 9 1 Introduction... 10 1.1 Problem outline... 10 1.2 Thesis goals... 13
2 Risk M anagem ent Tools and M anagem ent Sim ulators ... 16
2.1 H istory of sim ulators... 16
2.2 Learning w ith sim ulators ... 18
2.2.1 Cyclical learning ... 21
2.2.2 Linear learning ... 22
2.2.3 Open-ended learning... 22
2.3 Risk m anagem ent tools in use by N A SA ... 23
2.3.1 Continuous risk m anagem ent (CRM )... 23
2.3.2 N A SA Risk m anagem ent applications... 26
2.4 The case for a risk m anagem ent sim ulator ... 26
3 System Dynam ics M odel of N A SA Safety Culture... 28
3.1 M odel description ... 28
3.2 M odel custom ization... 33
4 Design and Implementation of a Risk Management Flight Simulator ... 36
4.1 Overview ... 36
4.2 System purpose ... 38
4.2.1 Program goals ... 38
4.2.2 H igh level functional requirem ents... 39
4.2.3 System lim itations... 41
4.2.4 System constraints & requirem ents ... 42
4.3 System design principles... 43
4.3.1 D escription... 43
4.3.2 System com ponents ... 44
4.3.3 U ser interface ... 45
4.3.4 Softw are reuse through m odularity... 45
4.3.5 Object-oriented design... 46
4.3.6 Rapid developm ent environm ent ... 46
4.3.7 Integration w ith V ensim C ... 47
4.3.8 A risk m atrix for leading risk indicators ... 47
4.4. Black box behavior ... 47
4.4.1. Scenario control ... 47
4.4.2. Save & com pare user runs ... 47
4.4.3. M odify input variable values ... 48
4.4.4. D isplay graphs of variables over tim e ... 48
4.4.6. D isplay graphs from the V ensim m odel ... 48
4.4.7. Explore variable dependencies ... 48
4.4.8. Perform sensitivity analyses ... 49
4.4.9. Load & save configuration data to disk ... 49
4.4.10. Register m issing V ensim entries... 49
4.4.11. D isplay and explore sim plified m odel... 50
4.4.12. Display updated risk consequence-severity matrix over time ... 50
4.4.13. Step m odel forward in tim e (user configurable) ... 53
4.4.14. Context-sensitive help... 53
4.4.15. D isplay leading risk indicator values... 54
4.4.16. N otify user of an "accident" ... 54
4.4.17. Log error m essages to disk ... 54
4.5. Logical functions ... 54
4.5.1 Class definitions... 54
4.5.2 Program initialization... 56
4.5.3 Start sim ulation... 58
4.5.4 A dvance sim ulation ... 59
4.5.5 Trend/Sensitivity/D ependent variable display ... 60
4.5.6 Risk m atrix form ... 61
4.5.7 Show m odel ... 63
4.5.8 U ser configuration ... 63
4.5.9 Instructions... 63
4.6. Scenario database... 63
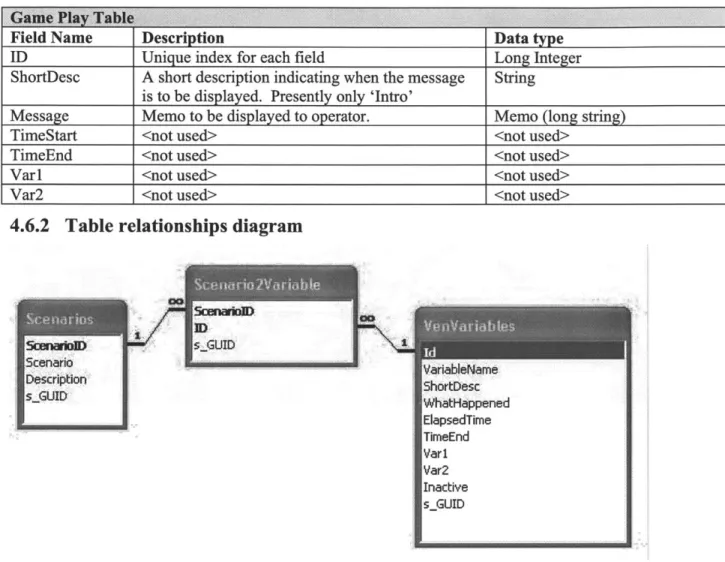
4.6.1 Table structure ... 63
4.6.2 Table relationships diagram ... 65
4.7. Im plem entation ... 66
4.7.1 Screen snap shots ... 66
5 System Evaluation & Testing ... 73
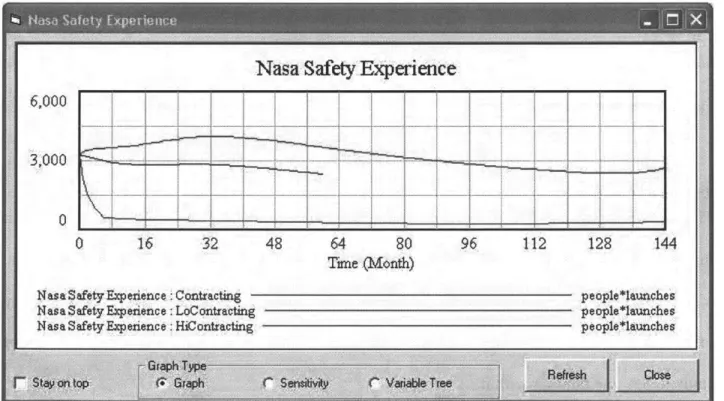
Sam ple test scenarios ... 74
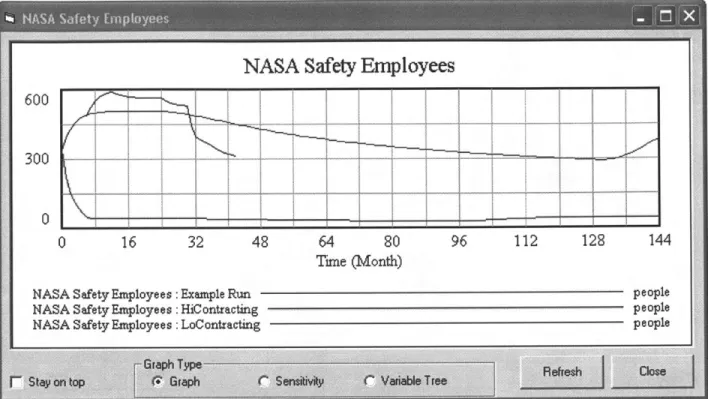
Sim ulating high and low contacting ratios... 74
Simulating performance pressure through launch requirements ... 74
Test results ... 75
Test observations ... 75
Case-based learning m odel ... 77
6 Conclusions and Recom m endations ... 78
6.1. D iscussion of thesis goals ... 78
Enable a user unfamiliar with either system dynamics or Vensim to be able to explore and learn from the m odel dynam ics... 78
6.2. Conclusions... 78
6.3. Suggested future w ork ... 79
6.3.1. Calibrate the m odel... 79
6.3.2. D ynam ic risk m atrix "what if' analysis... 80
6.3.3. Live on-line risk m anagem ent sim ulator ... 80
References... 81
Appendices... 83
A .1. System D ynam ics M odel Sub M odel V iew s ... 83
A.2. Manned Space Program Risk Management Tool User Manual... 93
A .2.1 Introduction... 93
A .2.2 G etting Started ... 94
Prerequisites... 94
Starting the program ... 94
Overview of the risk m anagem ent tool... 94
System configuration ... 96
Show m odel ... 99
A .2.3 Running a sim ulation ... 101
Scenario selection ... 101
Starting a sim ulation ... 102
A dvancing sim ulation tim e ... 103
Trending data ... 103
Loading other sim ulation runs ... 106
Risk m atrix... 108
Select graph... 109
Sensitivity Analysis ... 109
A .2.4 M odifying the V ensim M odel... 113
A .2.5 A dvanced Topics ... 114
Creating and m odifying scenarios ... 114
Creating and m odifying system instructions... 117
Error logging... 118
A .2.6 Trouble-Shooting ... 118
Scenario values are not being written to the model at the correct time ... 118
List of Figures
FIGURE 1-1 SCHEMATIC REPRESENTATION OF THE PERFORMANCE FEEDBACK LOOP. WITH EACH SUCCESFUL LAUNCH, PRESSURE FROM MANAGEMENT LEADS TO FURTHER INCREASES IN THE
LA U N CH RA TE ... 11
FIGURE 1-2 SIMPLIFIED MODEL OF THE DYNAMICS BEHIND THE SHUTTLE COLUMBIA LOSS BY L EV ESON & D U LA C ... 12
FIGURE 2-1 W W -II LINK TRAINING SIMULATOR... 16
FIGURE 2-2 PHOTOGRAPH OF THE WHIRLWIND COMPUTER. JAY FORRESTER IS ON THE FAR LEFT NEXT TO DR. NORMAN TAYLOR WHO IS POINTING. (1952) [PICTURE USED WITH THE PERMISSION OF THE MITRE CORPORATION. COPYRIGHT C THE MITRE CORPORATION. ALL RIGH TS RESERV ED .]... 17
FIGURE 2-3 THE EXPERIENTIAL LEARNING MODEL [KOLB 19, REPRODUCED WITH PERMISSION IN F R IPP P .4 1]... 18
FIGURE 2-4 NASA RISK MANAGEMENT PROCESS [11]... 24
FIGURE 2-5 NASA CRM CYCLE DIAGRAM ... 25
FIGURE 2-6 NASA LIKELIHOOD VS. SEVERITY RISK MATRIX... 25
FIGURE 3-1 SIMPLIFIED MODEL OF THE DYNAMICS BEHIND THE SHUTTLE COLUMBIA LOSS [7]... 28
FIGURE 3-2 THE 9 SUB MODELS IN THE SYSTEM DYNAMICS MODEL ... 29
FIGURE 3-3 SIMPLIFIED VIEW FROM THE VENSIM SYSTEM DYNAMICS MODEL ... 35
FIGURE 4-1 RISK MANAGEMENT PROGRAM MAIN SCREEN ... 36
FIGURE 4-2 SCREEN SHOT OF A TREND COMPARING DIFFERENT RATIOS OF CONTRACTING ... 37
FIGURE 4-3 SAMPLE RISK MATRIX DISPLAY ... 38
FIGURE 4-4 HIGH LEVEL COMPONENT DIAGRAM OF RISK MANAGEMENT TOOL ... 44
FIGURE 4-5 LOGIC DIAGRAM TO DETERMINE THE SEVERITY FUNCTION FOR THE SEVERITY-LIKELIHOOD M ATRIX ... 51
TABLE 4-1 LEADING INDICATORS AND ASSOCIATED LIKELIHOOD FUNCTIONS (FROM THE ITA R EPO R T [2 ].)... 52
TABLE 4-2 LIKELIHOOD CLASSIFICATION BREAK POINTS ... 53
FIGURE 4-6 VENSIM CLASS FUNCTION OVERVIEW... 55
FIGURE 4-7 W INDOWS INI CLASS OVERVIEW ... 56
FIGURE 4-8 ERROR HANDLING CLASS OVERVIEW... 56
FIGURE 4-9 HIGH LEVEL OVERVIEW - PROGRAM INITIALIZATION ... 57
FIGURE 4-10 HIGH LEVEL OVERVIEW - STARTING A NEW SIMULATION RUN ... 58
FIGURE 4-11 HIGH LEVEL OVERVIEW - ADVANCE SIMULATION... 59
FIGURE 4-12 HIGH LEVEL DIAGRAM OF THE TREND, SENSITIVITY AND MODEL DEPENDENCY TREE 61 TABLE 4-3 SCENARIO DATABASE VENVARIABLES TABLE STRUCTURE ... 64
TABLE 4-4 SCENARIO DATABASE SCENARIOS TABLE STRUCTURE... 64
TABLE 4-5 SCENARIO DATABASE SCENARIO2VARIABLE TABLE STRUCTURE... 64
TABLE 4-6 SCENARIO DATABASE GAME PLAY TABLE STRUCTURE ... 65
FIGURE 4-13 SCENARIO DATABASE TABLE RELATIONSHIPS DIAGRAM ... 65
FIGURE 4-14 SCREEN IMAGE OF MAIN PROGRAM ... 66
FIGURE 4-15 SCREEN IMAGE OF VARIABLE TREND DISPLAY... 67
FIGURE 4-16 SCREEN IMAGE OF VARIABLE DEPENDENCY TREE ... 68
FIGURE 4-17 SCREEN IMAGE OF SENSITIVITY CONFIGURATION ... 69
FIGURE 4-18 SCREEN IMAGE OF SENSITIVITY PLOT ... 70
FIGURE 4-19 SCREEN IMAGE OF RISK MATRIX DISPLAY ... 71
FIGURE 4-20 SCREEN IMAGE OF HIGH LEVEL MODEL WITH ONE LOOP (LAYER) DISPLAYED ... 72
FIGURE 4-21 SCREEN IMAGE OF HIGH LEVEL MODEL WITH THREE LOOPS (LAYERS) DISPLAYED ... 73
FIGURE 5-1 CASE-BASED LEARNING FLOW CHART FOR TEACHING USERS SYSTEM SAFETY CONCEPTS USING THE RISK MANAGEMENT TOOL. (BASED UPON FIGURE 7.1 OF [18] ... 77
FIGURE A.1.1 RESOURCE ALLOCATION SUB MODEL... 83
FIGURE A. 1.2 SHUTTLE AGING AND MAINTENANCE SUB MODEL... 84
FIGURE A. 1.3 LAUNCH RATE SUB MODEL ... 85
FIGURE A. 1.4 PERCEIVED SUCCESS BY HIGH-LEVEL MANAGEMENT SUB MODEL... 86
FIGURE A. 1.5 SYSTEM TECHNICAL RISK SUB MODEL ... 87
FIGURE A. 1.6 SYSTEM SAFETY EFFORTS AND EFFICACY SUB MODEL ... 88
FIGURE A.1.7 INCIDENT LEARNING SUB MODEL ... 89
FIGURE A. 1.8 SAFETY KNOWLEDGE, SKILLS AND STAFFING SUB MODEL ... 90
FIGURE A. 1.9 SYSTEM SAFETY STATUS SUB MODEL ... 91
FIGURE A .1.10 SIMPLIFIED OVERVIEW ... 92
FIGURE A.2-1 MAIN PROGRAM SCREEN OF THE RISK MANAGEMENT TOOL ... 95
FIGURE A .2-2 LOAD MODEL DIALOG ... 97
FIGURE A.2-3 BROWSE AND SELECT MODEL DIALOG... 98
FIGURE A.2-4 HIGH LEVEL OVERVIEW OF THE SYSTEM DYNAMICS MODEL... 99
FIGURE A.2-5 HIGH LEVEL OVERVIEW OF THE SYSTEM DYNAMICS MODEL WITH TWO LAYERS DISPLAYED AND SHOW BEHAVIOR ENABLED ... 100
FIGURE A.2-6 HIGH LEVEL OVER OF THE SYSTEM DYNAMICS MODEL WITH ALL LAYERS DISPLAYED ... 10 1 FIGURE A.2-7 LOAD RUNS CONFIGURATION DIALOG ... 102
FIGURE A.2-8 MESSAGE INDICATING THAT THERE HAS BEEN A SHUTTLE ACCIDENT ... 103
FIGURE A.2-9 HISTORICAL TREND OF A MODEL VARIABLE ... 104
FIGURE A .2- 10 VARIABLE TREE DISPLAY ... 105
FIGURE A.2-11 SCREEN SHOT OF THE LOAD RUNS DIALOG WITH TWO DATA RUNS LOADED FOR A N A LY SIS ... 106
FIGURE A.2-12 TREND COMPARING THE NUMBER OF CONTRACTOR EMPLOYEES UNDER HIGH AND LOW CONTRACTING SCENARIOS ... 107
FIGURE A.2-13 TREND COMPARING NASA'S ABILITY TO OVERSEE CONTRACTORS UNDER HIGH AND LOW CONTRACTING SCENARIOS... 107
FIGURE A.2-14 - LIKELIHOOD VS. SEVERITY RISK MATRIX... 108
FIGURE A.2-15 SENSITIVITY CONTROL CONFIGURATION DIALOG ... 110
FIGURE A.2-16 SENSITIVITY CONTROL CONFIGURATION FOR TWO VARIABLES... 112
FIGURE A .2-17 SAMPLE SENSITIVITY PLOT ... 113
FIGURE A.2-18 VENSIM PUBLISH MODEL DIALOG WHEN MODIFYING THE VENSIM MODEL ... 114
FIGURE A.2-19 SCENARIO DATABASE TABLE RELATIONSHIPS DIAGRAM ... 115
FIGURE A.2-20 SCREEN SHOT OF THE VENVARIABLES TABLE ... 116
FIGURE 2-21 SCREEN SHOT OF THE SCENARIOS TABLE ... 116
FIGURE A.2-22 SCREEN SHOT OF THE SCENARIO2VARIABLE TABLE WHICH LINKS EACH EVENT TO THE RIGHT SCEN A RIO ... 117
FIGURE A,2-23 SCREEN SHOT OF THE GAMEPLAY TABLE WITH USER INSTRUCTIONS... 117
List of Tables
TABLE 4-1 LEADING INDICATORS AND ASSOCIATED LIKELIHOOD FUNCTIONS (FROM THE ITA
R EPO R T [2 ].)... 52
TABLE 4-2 LIKELIHOOD CLASSIFICATION BREAK POINTS ... 53
TABLE 4-3 SCENARIO DATABASE VENVARIABLES TABLE STRUCTURE... 64
TABLE 4-4 SCENARIO DATABASE SCENARIOS TABLE STRUCTURE... 64
TABLE 4-5 SCENARIO DATABASE SCENARIO2VARIABLE TABLE STRUCTURE ... 64
TABLE 4-6 SCENARIO DATABASE GAME PLAY TABLE STRUCTURE ... 65
1
Introduction
1.1 Problem outline
This thesis summarizes the development of a risk management tool that was designed to better
enable NASA managers and decision makers to understand the complex system dynamics that
underscore system risk. Following the Columbia shuttle accident in 2003, Leveson et. al.
developed a sophisticated system model of the engineering and safety culture at NASA to better
understand and characterize the cultural and socio-political aspects of risk. The model was
developed using a commercial off-the-shelf ("COTS") product, Vensim, which provides an easy
method to describe a system and the interactions between the system components. Vensim, and
other tools like it, were born from the ground-breaking work of Jim Forrester and John Sterman
and have been used widely to describe systems varying from "predator-prey" population models
(i.e., the inter-relationship between rabbit and fox populations in a closed environment) to
supplier-consumer distribution models (i.e., the infamous "beer game") to product marketing
"flight simulators" (i.e., the complex dynamics of pricing a product and resource allocation) and
many others. Leveson, however, took system dynamics into a relatively new area: modeling
system safety culture. Specifically, they sought to develop a tool that could be used to better
understand the dynamics behind the breakdown in safety culture that led to the Columbia
disaster. The model was based upon previous work using STAMP (a "Systems Theoretic
Accident Modeling and Processes") that "...integrates all aspects of risk including organizational
example, with each successful launch, NASA managersI may come to believe that safety
concerns and objections are increasingly overrated based on the erroneous belief that success = "proof' of system safety. (i.e., insulating foam has come off the shuttle external fuel tank on all
previous launches and there wasn't a problem, hence falling foam is "safe".) This increasing
(false) confidence in the inherent safety of the system, along with budgetary concerns and
external pressure, then leads to an increasing performance pressure to "do more with less" and a
concomitant pressure to have more (successful) launches.
schematically below.
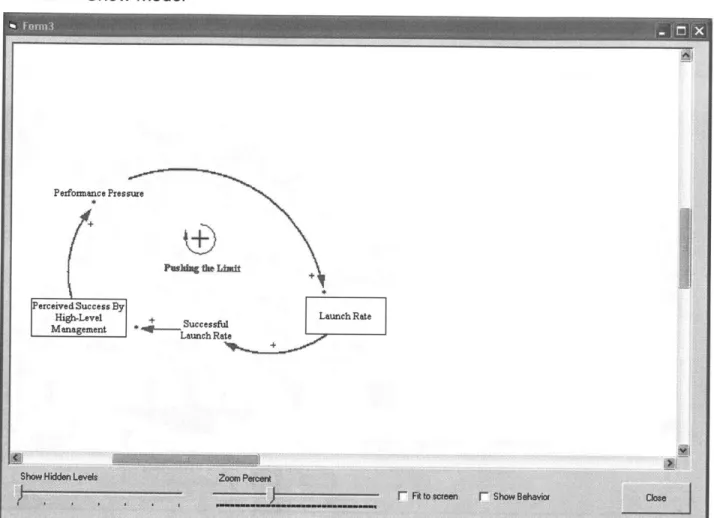
This relationship can be described
Performance Pressure
Perceived Success By Launch Rate
High-Level , + Successful Management * Launc hRa
Figure 1-1 Schematic representation of the performance feedback loop. With each succesful launch, pressure from management leads to further increases in the launch rate
The term "Manager" leaves a lot of room for ambiguity. In our context when we say manager we are referring to a
person that has decision-making authority over the allocation of personnel and resources as well as those persons who have primary authority and approval for when NASA can proceed with a shuttle launch. While it may be true that "everyone is responsible for safety", and anyone with a significant safety concern can impact a shuttle launch decision, in practice, when "everyone" is responsible, no one is. Hence, the decision to base the model on the assumption that there are those who by nature of their unique position have the ultimate decision-making authority in many ways represents the reality of system safety vs. organizational goals of system safety.
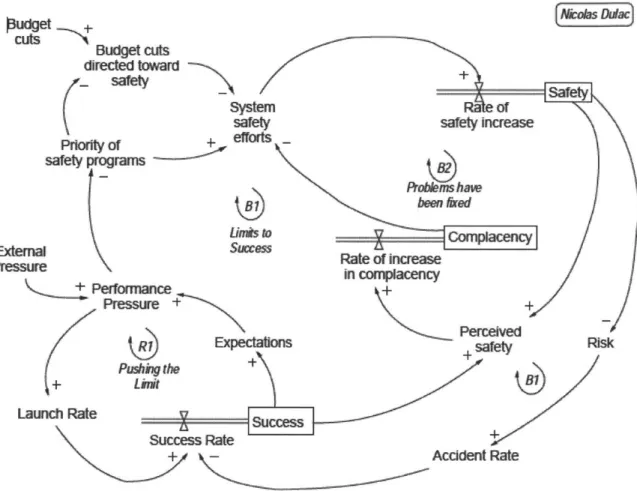
Of course, we recognize that such a positive feedback loop cannot go on forever and there are numerous feedbacks and other systems that support, inhibit and feed off of this loop. This was
developed and shown as Figure 3 in [7] (below).
Pudget +~ys ~j
cuts Budget cuts directed toward
safetySafety
system Of
safety safey increase
Pri^y Of efforts
safety programs
- robk-s have
jog 1been &ard
Punb to Compwency
Skg?)
Succesus sate of increase in ompoacency
Perforrmnce+ Pressure ++ Rol Perceived Rs xpectatio+ safety Rs PLW* nthe+ Launch Rate Sccs Success Rate Accident Rate
Figure 1-2 Simplified model of the Dynamics Behind the Shuttle Columbia Loss by Leveson & Dulac
We see that there are several inter-connecting loops and it is a little more complicated, but intrinsically, it looks pretty straightforward. Were that this was all there was to the model, we would be done. But, of course, real systems are significantly more complex than this and to develop this "simple" model there are, in fact, more than 700 variables in the Vensim model that underlie this diagram and the overall model becomes so complex that all but those who are
model that is so complex that it is usable only by a few academics. And, while this might
provide job security for those so inclined, our goal is disseminate and share this model with
NASA managers so that they can use it to better understand system safety and, hopefully, gain a greater appreciation of the complex dynamics of system safety at NASA. There are two
fundamental ways to approach this problem. We can either, (1) teach all NASA managers a
graduate course in system dynamics, the Vensim application and the specific model design, or
(2) develop a simplified "front end" to the model so that someone with very little training can
immediately begin to use the model as a learning tool without becoming bogged down in the
minutiae of the model design and system dynamics theory.
This, then, is the problem statement and the goal of this thesis: To develop a simplified interface
to the system dynamics model so that NASA managers can use the model as a risk management
tool.
1.2
Thesis goals
In addition to developing a simpler user interface to the system dynamics model, the goal of this
thesis is that it can be used, as a learning tool, to help decision makers better understand systemic
risk. This understanding is particularly important as it becomes increasingly apparent that the
traditional methods of risk management such as probabilistic risk assessment (PRA), fault tree
analysis and so forth, do not adequately account for programmatic and human-system-interface
risk (See, for example, a discussion of E. Co/i poisoning of the public water supply in
Walkerton, ON that led to several deaths in [5], or even a discussion of the "Therac-25" incident
in [6]. In both cases the standard safety methods and tools failed to protect lives due to a lack of
awareness of the complexity of system safety.)
Put more simply, in a NASA frame of reference, the Columbia Shuttle accident was not a case of
what are referred to as, "unknown unknowns", causing the loss of shuttle and crew. On the
contrary, NASA management was fully aware that foam had been a recurring problem, that
Atlantis only 3 months prior had foam impact the shuttle a mere 6 inches from a critical
electrical junction box and-most importantly-within hours of the launch of the Columbia a
post-launch film review indicated that the largest piece of insulating foam to have ever fallen off
in the history of the shuttle program had impacted the critical leading edge of the wing at a speed
of over 600 mph and appeared to have possibly caused some damage to the shuttle. But, due to
an overconfidence in the perceived safety that insulating foam had never previously caused an
accident, NASA management did not take any steps to further investigate the damage (e.g., having the military take high resolution photos of the damaged area) or plan for the possibility of
a damaged thermal tiles on reentry. (Recall the loop in Figure 1-1). We can be sure that this
type of accident is less likely to happen again, and certainly without a thorough analysis. But, the weakness of existing safety analyses is that by definition they rely upon the unstated
assumption that human-system interfaces are "working" and that a risk is adequately described
and appropriately evaluated. PRA and safety analyses are not enough. NASA decision makers
need to understand the dynamics that underlie system safety so they can evaluate the "health" of
their safety system and its ability to appropriately evaluate risk.
To this end, the work of this thesis is to accomplish several goals. These are:
1. To develop a working version of the model shown in [5], that encapsulates the model complexity so that users can more readily understand the broad macroscopic effects of
2. To design and program a user interface to the system dynamics base model that will enabled any user with only a short introduction into its use to be able to explore the model dynamics.
3. To develop the interface program so that it can be used (or further developed) into a risk management tool so that NASA managers can modify a subset of the model inputs (such as launch rate or the percentage of contracting to 3rd parties) and see how these changes
affect risk over time.
4. To develop the interface program so that users can track the "leading [risk] indicators" from [2] as the model inputs are modified (over time) and to display them in a
likelihood-severity 3 x 4 risk matrix as is commonly used by NASA management to assess risk. 5. To develop the user interface so that it can be upgraded and expanded to incorporate
different case scenarios such as external budget and performance requirements.
2 Risk Management Tools and Management Simulators
2.1 History of simulators
It is no coincidence that interactive simulations are often called, "flight simulators" regardless of their aeronautical or terrestrial goals. Some of the earliest training and simulation tools were first developed to help train pilots. As early as the Wright brothers, it was recognized that system complexity required a different level of training. In WW-I, Edwin Link developed the first mechanical flight simulator which later proved to be used extensively by the US military in WW-II to train pilots how to fly without jeopardizing equipment or personnel.
Figure 2-1 WW-11 Link Training Simulator
These training simulators were very simple and did not mimic the actual aerodynamics and feedback of a real airplane, but they did enable a student pilot to become familiar with the basic control and operation of an airplane. It was not until the late 1940's, with project "Whirlwind" developed at MIT, that the first (analog) computer simulation was used to provide immediate feedback to the user based on mathematical modeling of aerodynamic response. Not only was
this to become a seminal event in digital computing and computer simulation, but the lead
computer designer of the project and inventor of "core memory" was Dr. Jay Forrester who
would later develop the theory of system dynamics upon which this thesis is based.
Figure 2-2 Photograph of the Whirlwind computer. Jay Forrester is on the far left next to Dr. Norman Taylor who is pointing. (1952) [Picture used with the permission of The MITRE Corporation. Copyright C The
Mitre Corporation. All rights reserved.]
Eventually flight simulators became more and more complex to the point where we are today:
flight simulators so closely mimic the actual flying experience that they have become a necessary
staple of training pilots in flight safety, procedures and aerodynamics. In fact, in most any
complex system that involves severe consequences when there is mishap-and where it is
impractical or unsafe to train on the real system-we are likely to find a computer simulator to
help train operators how to respond in the event of an accident. The nuclear power industry, for
example, has full mock-ups of the reactor control room with a sophisticated computer model
behind it for operators to practice emergency procedures without the risk of an accident or a loss
of plant availability (which is costly).
With the advent of the computer, another type of simulator arose in the 1980's and
1990's-business simulations. These simulations require the development of a complex mathematical
model to simulate some aspect of a business cycle or process such as new product development
or resource allocation. These tools enable business managers to learn about the dynamics of the Page 17 of 118
particular challenge and to practice and hone their skills and understanding in a safe
environment.
2.2 Learning with simulators
There are, of course, many different ways that people learn. We tend to learn incrementally, building upon previous knowledge on step at a time. Figure 4.1 of Learning Through Simulations
(Fripp [18] ) shows the Kolb learning model reproduced below.
Concrete Experiences
/V
Testing implications or Observation and
concepts in new situations Reflection
Formation of abstract
concepts and
-generalizations
Figure 2-3 The experiential learning model [Kolb 19, reproduced with permission in Fripp p.41]
The key point of this diagram is that learning is a process that is based upon a combination of
concrete and abstract experiences that are then tested and observed/reflected upon. Different
people learn in different ways and Fripp spends some time talking about the importance of
different learning styles, i.e., What works for some does not work well for others. For our
purposes, however, we are less interested in an individual's particular learning style than the
observation that, if the Kolb model is correct, regardless of style if one is to truly learn a new
concept then it must involve the whole cycle. If any one leg is missing then regardless of how
well the other three are mastered the ability to apply the new skill is limited. For example, one
and even bounce a tennis ball on a racquet or over a net a few times (concrete experiences). If
you have never actually played tennis (testing concepts in new situations), however, it is highly
unlikely that you will be ready for tournament play. Furthermore, it is not enough for the
learning structure to be in place for effective learning to take place. The participant has to want
to learn so that he can be an active participant. As pointed out by Fripp (p 41), "For people to
learn most effectively, the subject matter must therefore either have intrinsic interest to them, or
they will need to have their interest stimulated in some way." (Many of us may remember a
great professor who made a boring class fun and interesting by stimulating our interest).
So, how do we learn? The options are varied: lectures, classes, on-the-job training, mentoring and coaching, on-line information, case studies and, of course, simulations. All of us have used
one or more of these at different times of our lives, but simulations offer several distinct
advantages not available with any of the other methods. These include:
" They provide immersion-the participant can immerse oneself within the simulation and act as if it is not a simulation.
" They are a safe environment to make mistakes with no risk of financial loss or equipment damage
" They can be team-based, or individual
* They can simulate extreme situations that would not ordinarily be available
* They work with all four stages of the Kolb model: encouraging the participant to test new
concepts, gain concrete knowledge and facts and the opportunity for reflection during and
after the simulation
" A well designed simulation can convey system interactions and dependencies
" They can be FUN, which make the learning all the more enjoyable and memorable.
What are the disadvantages of simulations?
Fripp discusses several: They can be complex and time-consuming to design and build: If the
simulation is too easy then participants try to "beat the game" and if they are too complicated
then participants may give up and lose interest.
But, overall, a well-designed simulation can be an ideal learning environment-especially for
endeavors such as space flight, which have such extreme risks and costs associated with failure.
What are some of the features of a simulation that might encourage effective learning?
Fripp discusses three kinds of managerial learning, "cerebral learning," "skills learning" and
"transformational learning," and-as with the Kolb model-effective learning involves all three.
Aldrich in, Simulations and the future of learning : an innovative (and perhaps revolutionary)
approach to e-learning (Aldrich [8]) emphasizes the importance of simulations that have the
following features (Aldrich, Pg. 9):
" Authentic and relevant scenarios
" Applied pressure situations that tap user's emotions and force them to act
" A sense of unrestricted options and,
* Replayability
In terms of how one learns through a simulation "game" Aldrich discusses three different
"contents", what he calls the three "primary colors" of learning in game simulations: Cyclical,
Open-Ended and Linear.
2.2.1 Cyclical learning
Cyclical learning is familiar to all of us as learning by rote. With each iteration we gain a better
understanding of the system and improve our skills. Simulators based upon cyclical learning
teach through repetition and practice. Arguably, all learning involves some fraction of repetition
as we imprint a neural behavior. Certainly in aeronautical flight simulators we see cyclical
learning in areas such as emergency response procedures so that "common" mishaps become
familiar to the pilot. However, cyclical learning as a primary simulation method is more
prevalent in other industries such as medicine, where the student needs to practice a procedure
"until he gets it right." Examples of simulators run from the very simple-such as the
"resusci-annie" doll familiar to Red Cross CPR students-to the increasingly more complex and realistic
simulation tools for medical students to practice medical procedures.2
If we extend the definition of "simulator" to include system mock-ups and dry runs, we can see that cyclical learning is used in many more industries where it is desirable to have personnel
practice a complicated procedure in some form of a simulated environment. Nuclear technicians, for example, will practice a nuclear refueling procedure until management is confident that there
will be safety through familiarity. Other examples include aircraft and spacecraft maintenance, surgical operating procedures, military "war games", and even school fire drills. How do we
differentiate between cyclical learning simulations vs. simply practicing a skill (such as playing
tennis or golf) through repetition? I would suggest that the principle difference is that a
2 See for example the products available from the company "Limbs and Things Ltd." www.limbsandthings.com Page 21 of 118
simulation requires some degree of imagination on the part of the participant. If she is acting as
if there is some alternate reality (a fire, emergency, real radioactive fuel present, etc.), then it is a
simulation. If there is no suspension of disbelief, then it is not.
2.2.2 Linear learning
As the name implies, linear learning is a time-based, one step follows the previous form of
learning. Most classes are taught this way, as well as story narratives and it is the most common
method for learning a new skill. Linear learning is familiar to us because we experience time as
linear. Most simulators, however, are not based upon linear learning. A pilot in a flight simulator can re-play the same event over and over until he is comfortable with his performance
regardless of the flow of time. Interestingly, however, because system dynamics uses time as its
integrating variable, linear learning does come into play with respect to system dynamics based
simulators such as this thesis. As described later in this thesis, the risk management tool has a
user step forward through time (the default is 6 months per iteration) so that she can understand
and evaluate the time-based nature of safety and risk accumulation. If a user wants to re-examine
or improve her performance, then she must go back to the beginning and step forward through
time again making the appropriate choices along the way. So, while linear learning does not see
much use in class simulators, it is used to a degree in this context.
2.2.3 Open-ended learning
Open-ended learning is perhaps the "holy grail" of all good simulations. It involves an
understanding of trade-offs and recognition that a system is dynamic with various feedbacks. It
is also very much the same concept as Fripp's "transformational" learning. Humans are uniquely
gifted with the ability to adapt to a new situation and apply their knowledge of the system to take
designed to combine open-ended learning-presenting the student with an unanticipated event
-with cyclical learning until he or she "gets it right." Open-ended learning is about teaching the
participant about the system dynamics so that he can make an informed decision based upon that
knowledge. This is the ultimate goal of this thesis as well-to teach NASA managers about the
dynamics of system safety; not in terms of component and mechanical systems (for which NASA
has numerous tools to evaluate the risk, cost and severity of a failure) but in terms of the overall
socio-technical system itself.
2.3
Risk management tools in use by NASA
NASA uses several risk management tools depending on the type and nature of the project. If managing cost and schedule are of primary import, a project is likely to use continuous risk
management (CRM) along with a database tool to simplify the integration and reporting of
system risks. Supporting CRM, or perhaps as a separate effort, there will be probabilistic risk
assessments (PRA), often combined with a fault tree analysis, that seek to quantify and identify
the most significant risks of mechanical or system failure. PRA is also used (and misused) to
normalize risk so that different risks can be compared in terms of failures per number of events
and even to make risk "trade offs"-literally moving risk from one system to another as if it
were a physical quantity that could be traded between systems. (See, for example, "Risk as a
Resource" [11] which grew from NASA's "faster, better, cheaper" initiative) 2.3.1 Continuous risk management (CRM)
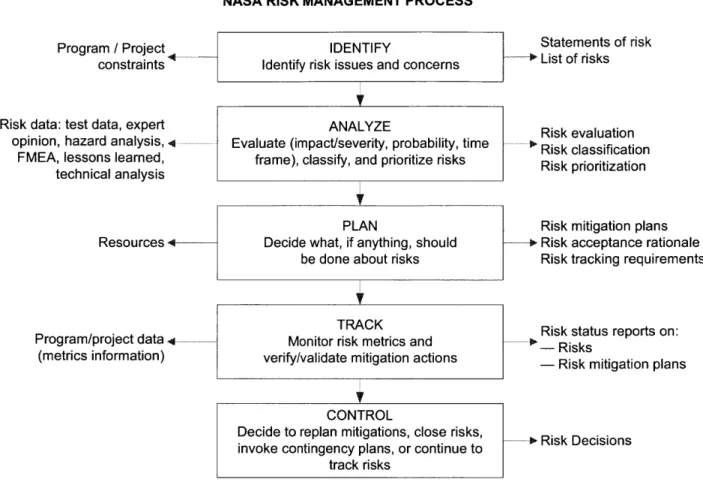
An outcome of NASA's faster, better, cheaper (FBC) initiative is extensive use of continuous
risk management. CRM aims to track and control budget, schedule and program risk through six
steps: identify, analyze, plan, track & control.
NASA RISK MANAGEMENT PROCESS
Program / Project4
constraints
Risk data: test data, expert opinion, hazard analysis, -q
FMEA, lessons learned,
technical analysis
K
Statements of risk + List of risks Risk evaluation + Risk classification Risk prioritization Resources 4--Program/project data 4-(metrics information) TRACKMonitor risk metrics and verify/validate mitigation actions
CONTROL
Decide to replan mitigations, close risks, invoke contingency plans, or continue to
track risks
Risk mitigation plans
o Risk acceptance rationale Risk tracking requirements
Risk status reports on:
-- Risks
- Risk mitigation plans
P+ Risk Decisions
Figure 2-4 NASA risk management process [111
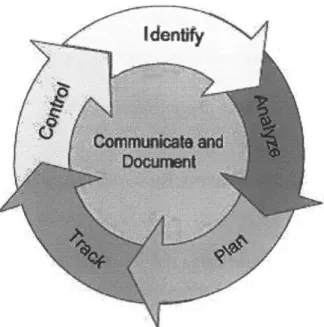
This is often shown as a cyclic process indicating that the process is "continuous". IDENTIFY
Identify risk issues and concerns
V
ANALYZE
Evaluate (impact/severity, probability, time frame), classify, and prioritize risks
PLAN
Decide what, if anything, should be done about risks
Identfy~N
Figure 2-5 NASA CRM cycle diagram
The primary output of CRM is the generation of a 5x5 likelihood (probability) vs. severity
(impact) risk matrix that attempts to prioritize and focus attention on the most important risks.
-j
~0
02
-H
1
2345
IMPACT
Figure 2-6 NASA likelihood vs. severity risk matrix
From a purely safety and risk perspective, the CRM process does not prioritize "risk" over cost
and schedule. A high likelihood and severity impact can easily be schedule risk or excessive
cost overruns. From a project risk management perspective, this is perfectly fine. But, from a
system technical risk perspective, it appears to be problematic. While, "of course" technical risk
is treated with respect, there is nothing in the CRM process that explicitly treats it any different.
There are some signs, however, that this may be changing. At the NASA Risk Management
Conference VI, Wayne Hale, Manager of the Space Shuttle Program, noted that:
"The RM [Risk Management] system is only as good as the engineering that informs it. The RM system can also lead to the illusion that we have a comprehensive portrait ofprogram risk when we don't." [13]
At the same conference, John Turner, the Space Shuttle Program Risk Manager warned
participants [to] "Avoid Calculus with Crayons Syndrome (CWCS)-risk scores are at best
fuzzy"[14]. So, while CRM is still primarily focused on programmatic risk (cost and schedule)
vs. safety, there appears to be a greater appreciation for the limitations of it as well.
2.3.2 NASA Risk management applications
NASA has several risk management database and integration tools to assist in the management of risk and the coordination of resources. These include, "Integrated Risk Management"
(IRMA) [16], "Risk Management Implementation Tool" (RMIT) [17], "Active Risk Manger"
(ARM) [15] as well as the "Glenn Risk Database", developed with Microsoft Access@. A
common feature of all of the tools is that they assist the user in following the risk management
process whenever a new risk is entered or updated. Typically, users can enter detailed
information, and generate reports and a 5x5 risk matrix to highlight the most important risks.
The most important take-away from all of these programs is that, as pointed out above, they are
project risk management tools, and not safety focused.
2.4
The case for a risk management simulator
The case for a risk management simulator is actually quite simple. Can anyone imagine an
astronaut piloting the shuttle without extensive practice in a flight simulator? The same goes for
emergency repairs and maintenance: workers will practice ("simulate") making the repair in a
these hypotheticals is clearly, "no." In fact, we know that practically every facet of space flight is practiced and simulated until the chance of operator error is remote. Given the great
prevalence of simulation in manned space flight it seems almost antithetical that there are no tools available to help managers to practice (safety) risk management decision-making. But, that is exactly the case because, quite simply, they do not appear to exist. More importantly, there are no tools currently available to help managers to understand the risk consequences of project
management tradeoffs such as:
* If the budget requires either reducing the launch rate or contracting more work, which
decision is safer?
* If you are going to increase the amount of work contracted out, what measures should
you take to minimize the safety impact?
* Launching too many missions clearly has a safety impact, but is there a minimum launch
goal as well, below which risk increases?
* To what degree does schedule pressure-trying to do more with less-impact safety? Is
a little pressure good, or is it always bad?
* What are the leading indicators of a risk problem?
* Is it good to have a string of successful launches? What are the risks?
The goal of this thesis is to provide NASA with a tool that will enable just these types of analyses and eventually, with further work, an on-line real-time risk management simulator as well.
3 System Dynamics Model of NASA Safety Culture
This simulation uses the system dynamics model developed by Leveson et.al. for the Phase I
final report for a USRA grant in February 2005 [7] with some minor modifications described
below.
Budget cut
directed toward
systum Of
Csawet safeW increase
Prietof +eff
safe rams
Resu - Rale of incfease
in comp acency
IPenoance +
Pressure +
Expe
Perceived
Expectats ety Ris
Ro +
Lunch Rate
Success Rlfe+
+ - Accident Rate
Figure 3-1 Simplified model of the dynamics behind the Shuttle Columbia loss [71
3.1 Model description
With the exception of the modifications described in Section 3.2, the model is essentially
unchanged from the original USRA, pre-Columbia model. The description of the model is
reproduced from that report. The model has several hundred variables grouped into one of 9
1. Launch Rate
2. System Safety Resource Allocation 3. System Safety Status
4. Incident Learning and Corrective Action 5. Technical Risk
6. System Safety Efforts and Efficacy 7. Shuttle Aging and Maintenance
8. System Safety Knowledge Skills and Staffing 9. Perceived Success by High-Level Management
It's important to note that the 9 sub models were developed to simplify creating the simulation and do not necessarily correspond to major system dynamic driving forces.
PeF ived syst n
success by saw
3.m1 Tecnial sta
Shtne Agng
and
ioinen ce ystae ofety
Effat and
BficWcy
ncdent Leang
RiM and poaectve
t syst oSafe s Acton
Knowledge,
Sk s and Sat
Figure 3-2 The 9 sub models in the system dynamics model
The description of each of the 9 sub models from [7] is reproduced below.
3.1.1.1 Technical Risk
The purpose of the technical risk model is to determine the level of occurrence of anomalies and hazardous events, as well as the interval between accidents. The assumption behind the risk formulation is that once the system has reached a state of high risk, it is highly vulnerable to small deviations that can cascade into major accidents. The primary factors affecting the technical risk of the system are the effective age of the Shuttle, the quantity and quality of
inspections aimed at uncovering and correcting safety problems, and the proactive hazard analysis and mitigation efforts used to continuously improve the safety of the system. Another
factor affecting risk is the response of the program to anomalies and hazardous events (and, of course, mishaps or accidents).
The response to anomalies, hazardous events, and mishaps can either address the symptoms of the underlying problem or the root causes of the problems. Corrective actions that address the symptoms of a problem have insignificant effect on the technical risk and merely allow the system to continue operating while the underlying problems remain unresolved. On the other hand, corrective actions that address the root cause of a problem have a significant and lasting positive effect on reducing the system technical risk.
3.1.1.2 System safety resource allocation
The purpose of the resource allocation model is to determine the level of resources allocated to system safety. To do this, we model the factors determining the portion of NASA's budget devoted to system safety. The critical factors here are the priority of the safety programs relative to other competing priorities such as launch performance and NASA safety history. The model assumes that if performance expectations are high or schedule pressure is tight, safety funding will decrease, particularly if NASA has had past safe operations.
3.1.1.3 System safety status
The safety organization's status plays an important role throughout the model, particularly in determining effectiveness in attracting high-quality employees and determining the likelihood of other employees becoming involved in the system safety process. Additionally, the status of the safety organization plays an important role in determining their level of influence, which in turn, contributes to the overall effectiveness of the safety activities. Management prioritization of system safety efforts plays an important role in this sub model, which in turn influences such safety culture factors as the power and authority of the safety organization, resource allocation, and rewards and recognition for raising safety concerns and placing emphasis on safety. In the model, the status of the safety organization has an impact on the ability to attract highly capable personnel; on the level of morale, motivation, and influence; and on the amount and effectiveness of cross-boundary communication.
3.1.1.4 Safety knowledge, skills and staffing
The purpose of this sub model is to determine both the overall level of knowledge and skill in the system safety organization and to determine if the number of NASA system safety engineers is sufficient to oversee the contractors. The System Safety Effort and Efficacy sub model use these two values.
In order to determine these key values, the model tracks four quantities: the number of NASA employees working in system safety, the number of contractor system safety employees, the aggregate experience of the NASA employees, and the aggregate experience of the system safety contractors such as those working for United Space Alliance (USA) and other major Shuttle contractors.
The staffing numbers rise and fall based on the hiring, firing, attrition, and transfer rates of the employees and contractors. These rates are determined by several factors, including the amount of safety funding allocated, the portion of work to be contracted out, the age of NASA employees, and the stability of funding.
The amount of experience of the NASA and contractor system safety engineers relates to the new staff hiring rate and the quality of that staff. An organization that highly values safety will be able to attract better employees who bring more experience and can learn faster than lower quality staff. The rate at which the staff gains experience is also determined by training, performance feedback, and the workload they face.
3.1.1.5 Shuttle aging and maintenance
The age of the Shuttle and the amount of maintenance, refurbishments, and safety upgrades affects the technical risk of the system and the number of anomalies and hazardous events. The effective Shuttle age is mainly influenced by the launch rate.
A higher launch rate will accelerate the aging of the Shuttle unless extensive maintenance and refurbishment are performed. The amount of maintenance depends on the resources available for maintenance at any given time. As the system ages, more maintenance may be required; if the resources devoted to maintenance are not adjusted accordingly, accelerated aging will occur. The original design of the system also affects the maintenance requirements. Many compromises were made during the initial phase of the Shuttle design, trading off lower development costs for higher operations costs. Our model includes the original level of design for maintainability, which allows the investigation of scenarios during the analysis where system maintainability would have been a high priority from the beginning.
While launch rate and maintenance affect the rate of Shuttle aging, refurbishment and upgrades decrease the effective aging by providing complete replacements and upgrade of Shuttle systems such as avionics, fuel systems, and structural components. The amount of upgrades and refurbishment depends on the resources available, as well as on the perception of the remaining
life of the system.
Upgrades and refurbishment will most likely be delayed or canceled when there is high uncertainty about the remaining operating life. Uncertainty will be higher as the system approaches or exceeds its original design lifetime, especially if there is no clear vision and plan about the future of the manned space program.
3.1.1.6 Launch rate
The Launch Rate sub model is at the core of the integrated model. Launch rate affects many parts of the model, such as the perception of the level of success achieved by the Shuttle program. A high launch rate without accidents contributes to the perception that the program is safe, eventually eroding the priority of system safety efforts. A high launch rate also accelerates system aging and creates schedule pressure, which hinders the ability of engineers to perform thorough problem investigation and to implement effective corrective actions that address the root cause of the problems rather than just the symptoms. The launch rate in the model is largely determined by three factors:
1. Expectations from high-level management: Launch expectations will most likely be high if the program has been successful in the recent past. The expectations are reinforced through a "Pushing the Limits" phenomenon where administrators expect ever more from a successful program, without necessarily providing the resources required to increase launch rate;
2. Schedule pressure from the backlog of flights scheduled: This backlog is affected by the launch commitments, which depend on factors such as ISS commitments, Hubble servicing requirements, and other scientific mission constraints;
3. Launch delays that may be caused by unanticipated safety problems: The number of launch delays depends on the technical risk, on the ability of system safety to uncover problems requiring launch delays, and on the power and authority of system safety personnel to delay
launches.
3.1.1.7 System safety efforts and efficacy
This sub model captures the effectiveness of system safety at identifying, tracking, and mitigating Shuttle system hazards. The success of these activities will affect the number of hazardous events and problems identified, as well as the quality and thoroughness of the resulting investigations and corrective actions. In the model, a combination of reactive problem investigation and proactive hazard mitigation efforts leads to effective safety-related decision making that reduces the technical risk associated with the operation of the Shuttle.
While effective system safety activities will improve safety over the long run, they may also result in a decreased launch rate over the short run by delaying launches when serious safety problems are identified.
The efficacy of the system safety activities depends on various factors. Some of these factors are defined outside this sub model, such as the availability of resources to be allocated to safety and the availability and effectiveness of safety processes and standards. Others depend on characteristics of the system safety personnel themselves, such as their number, knowledge, experience, skills, motivation, and commitment. These personal characteristics also affect the ability of NASA to oversee and integrate the safety efforts of contractors, which is one dimension of system safety effectiveness. The quantity and quality of lessons learned and the ability of the organization to absorb and use these lessons is also a key component of system safety effectiveness.
3.1.1.8 Hazardous event (incident) earning and corrective action
The objective of this sub model is to capture the dynamics associated with the handling and resolution of safety-related anomalies and hazardous events. It is one of the most complex sub models, reflecting the complexity of the cognitive and behavioral processes involved in identifying, reporting, investigating, and resolving safety issues. Once integrated into the combined model, the amount and quality of learning achieved through the investigation and resolution of safety problems impacts the effectiveness of system safety efforts and the quality of resulting corrective actions, which in turn has a significant effect on the technical risk of the
system.
The structure of this model revolves around the processing of incidents or hazardous events, from their initial identification to their eventual resolution. The number of safety-related incidents is a function of the technical risk. Some safety-related problems will be reported while others will be left unreported. The fraction of safety problems reported depends on the effectiveness of the reporting process, the employee sensitization to safety problems, the possible fear of reporting if the organization discourages it, perhaps due to the impact on schedule. Problem reporting will increase if employees see that their concerns are considered and acted
upon, that is, if they have previous experience that reporting problems led to positive actions. The reported problem also varies as a function of the perceived safety of the system by engineers and technical workers. A problem reporting positive feedback loop creates more reporting as the perceived risk increases, which is influenced by the number of problems reported and addressed. Numerous studies have shown that the risk perceived by engineers and technical workers is different from high-level management perception of risk. In our model, high-level management and engineers use different cues to evaluate risk and safety, which results in very different assessments.
A fraction of the anomalies reported are investigated in the model. This fraction varies based on the resources available, the overall number of anomalies being investigated at any time, and the thoroughness of the investigation process. The period of time the investigation lasts will also depend on these same variables.
Once a hazard event or anomaly has been investigated, four outcomes are possible: (1) no action is taken to resolve the problem, (2) a corrective action is taken that only addresses the symptoms of the problem, (3) a corrective action is performed that addresses the root causes of the problem, and (4) the proposed corrective action is rejected, which results in further investigation until a more satisfactory solution is proposed. Many factors are used to determine which of these four possible outcomes results, including the resources available, the schedule pressure, the quality of hazardous event or anomaly investigation, the investigation and resolution process and reviews, and the effectiveness of system safety decision-making. As the organization goes through this ongoing process of problem identification, investigation, and resolution, some lessons are learned, which may be of variable quality depending on the investigation process and thoroughness. In our model, if the safety personnel and decision-makers have the capability and resources to extract and internalize high-quality lessons from the investigation process, their overall ability to identify and resolve problems and do effective hazard mitigation will be enhanced.
3.1.1.9 Perceived success by high-level management
The purpose if this sub model is to capture the dynamics behind the success of the Shuttle program as perceived by high-level management and NASA administration. The success perceived by high-level management is a major component of the Pushing the Limit reinforcing loop, where much will be expected from a highly successful program, creating even higher expectations and performance pressure. High perceived success also creates the impression by high-level management that the system is inherently safe and can be considered operational, thus reducing the priority of safety, which affects resource allocation and system safety status. Two main factors contribute to the perception of success: the accumulation of successful launches positively influences the perceived success while the occurrence of accidents and mishaps have a strong negative influence.
3.2
Model customization
The original Columbia model was essentially unchanged, but some modifications were made to
provide a better user experience or to add new capabilities. These are described below.