Plasma Science and Fusion Center Massachusetts Institute of Technology
Cambridge MA 02139 USA
This work was supported by the U.S. Department of Energy, Grant No.
DE-FC02-99ER54512. Reproduction, translation, publication, use and disposal, in whole or in part, by or for the United States government is permitted.
PSFC/RR-08-6
Design, installation and commissioning of the upper
divertor cryopump system in Alcator C-Mod
B. LaBombard, A. Zhukovsky, J. Zaks, R. Vieira, P. Titus, Y. Rokman, S. Pierson, N. Mucic, S. Marazita, R. Leccacorvi, J. Irby,
Design, installation and commissioning
of the upper divertor cryopump system in Alcator C-Mod
B. LaBombard, A. Zhukovsky, J. Zaks, R. Vieira, P. Titus, Y. Rokhman, S. Pierson, N. Mucic, S. Marazita, R. Leccacorvi,
J. Irby, D. Gwinn, R. Granetz, R. Childs, J. Bosco, B. Beck
September, 2007 Over the past year, a new cryopump system in Alcator C-Mod’s upper divertor has been successfully installed, operated and used as a research tool for initial investigations on particle and density control. This report summarizes the activities that have led to the completion of a C-Mod project milestone in FY07, “Investigate particle and density control with the new upper divertor cryopump”.
1. Project overview 1.1 Design concept
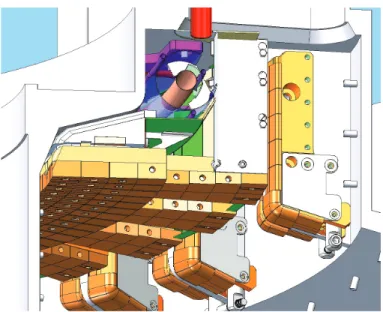
The design of C-Mod’s upper divertor cryopump system is unique among the world’s tokamaks, employing an array of gas-pumping slots that penetrate the upper divertor target plate (see Fig.1). This geometry allows a single toroidal loop of liquid helium to be used, greatly simplifying the cryogenic feed lines and providing the largest-possible, continuous cryogenic surface inside a C-Mod divertor. The geometry also allows the pump to be operated in an efficient low-flow or no-flow ‘quasi pool-boiling’ regime for liquid helium. The toroidal loop (a 25.4 mm diameter inconel pipe with 0.25 mm wall) acts as a helium vapor separator; it is divided internally into a series of compartments and is only partially filled with helium, allowing helium to boil at atmospheric pressure with the resulting vapor exiting via an exhaust tube. Under conditions of forced helium flow, the compartments increase flow turbulence, wetting a larger internal perimeter of the pipe and further enhancing the pumping speed (~10% increase). Bubble boiling of helium near atmosphere pressures (4.2 K) is found to be effective in keeping a large fraction of the cryopump surfaces to under the target value of 4.6 K. A superconducting level meter (‘dip-stick’) is inserted into the exhaust tube, indicating the height of helium liquid in the pipe. The helium pipe is surrounded by nitrogen-cooled and room-temperature surfaces, shielding the pipe from ambient radiation, which includes room-temperature blackbody radiation and plasma light. Molybdenum tiles protect the cryogenic structures from plasma
contact. These tiles are arranged to provide an array of 30 ‘pumping slots’. A portion of the neutral particle flux that is generated at the molybdenum tile surface undergoes charge-exchange collisions with the plasma and scatters into the ‘gas box’ that surrounds the cryogenic tubes (see Monte Carlo modeling of particle trajectories in Fig. 2). By varying the mapping of the outer magnetic flux surfaces onto the tile surfaces, dynamic control of the gas-pumping throughput can be achieved (see Fig. 3).
Figure 1 – Upper divertor cryopumping system concept in Alcator C-Mod. A portion of the neutral particles formed at the upper divertor target plate undergo charge-exchange collisions with the ambient plasma, causing them to pass through ‘pumping slots’ and enter into the ductwork surrounding the cryogenic surfaces.
0.50 0.55 0.60 0.65 0.70 0.75 0.30 0.35 0.40 0.45 0.50 0.55 0.60 B. LaBombard 19-JUN-2006
C-Mod Cryopump Simulation - Case CH1
0.50 0.55 0.60 0.65 0.70 0.75 Major Radius (m) 0.30 0.35 0.40 0.45 0.50 0.55 0.60 Vertical Height (m) B. LaBombard 19-JUN-2006 -0.05 0.0 0.05 Toroidal Direction (m) Atoms Launched=10000 Trajectories Shown=300 Atoms Leaked=883 Atoms Pumped=431 Atoms Ionized=8686 Charge Exchange Events=8314 CX Reflected into Slot=2626 Pumped/Launched=0.043
Hits on Inner/Outer Connector=449
Source= 2.64E+22 D atoms/s 373.1 torr-l/s D2 Baffle Width (meters)=0.063
Profile Shot#1021002017:800 1MA:2MW:nebar= 2.5:H-mode EFIT: 1031211007:0.660 SSEP = -1.3 mm
Pumping= 1.14E+21 D atoms/s 16.08 torr-l/s D2
Gas inventory = 8.5 torr-l D2
Baffle
Figure 2 – Example of neutral particle trajectories (red lines) from a 3-D Monte Carlo code used to simulate the operation of the pump. The results from this numerical simulation were used to optimize the location and size of neutral baffles located at the large major radius side of the pumping slot (green).
1050303004 EFIT: 1.000 1050303023 EFIT: 1.000 1050303003 EFIT: 1.000
Figure 3 – The cryopump’s particle throughput can be changed dynamically during a discharge by varying the plasma flux that arrives on the upper divertor target. For example, varying the magnetic equilibrium from lower-single null dominant (left) to near-balanced double-null (right) increases the particle fluxes directed to the pumping slot tiles.
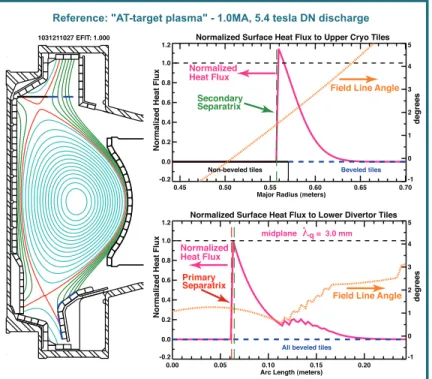
The molybdenum tiles that form the divertor target plate and pumping slots are located just above the nominal location of the upper x-point. This placement leads to significant poloidal flux expansion at the divertor target, spreading the scrape-off layer heat fluxes over a large surface area. Figure 4 shows a comparison of heat fluxes mapped to the upper and lower divertor surfaces for a near-balanced double-null equilibrium. The power handling of the upper divertor tiles is found to be comparable or even better than that of the lower divertor surfaces (‘better’ because there are no ‘beveled tiles’ at the location of the upper strike point, which lead to additional heat-flux peaking factors). Thus, this integrated divertor target and cryopump design allows the pumping system to be fully utilized for high-performance plasma physics experiments, including those that employ upper single-null plasma equilibria.
1031211027 EFIT: 1.000 Normalized Surface Heat Flux to Upper Cryo Tiles
0.45 0.50 0.55 0.60 0.65 0.70
Major Radius (meters) -0.2 0.0 0.2 0.4 0.6 0.8 1.0 1.2 Secondary Separatrix -1 0 1 2 3 4 5 degrees
Field Line Angle
Non-beveled tiles Beveled tiles
Normalized Surface Heat Flux to Lower Divertor Tiles
0.00 0.05 0.10 0.15 0.20
Arc Length (meters) -0.2 0.0 0.2 0.4 0.6 0.8 1.0 1.2
Normalized Heat Flux
Normalized Heat Flux
Normalized Heat Flux Normalized Heat Flux midplane λq = 3.0 mm Primary Separatrix -1 0 1 2 3 4 5 degrees
Field Line Angle
All beveled tiles
Reference: "AT-target plasma" - 1.0MA, 5.4 tesla DN discharge
Figure 4 – Poloidal flux expansion reduces peak heat fluxes on the upper divertor cryopump tiles to a level similar to that of the lower divertor. This enables C-Mod to operate high-performance plasmas in an upper single-null configuration with full utilization of the cryopump.
1.2 Design goals
The cryopump team targeted a number of key specifications for the new upper divertor and cryopump system:
- Divertor, tiles and cryogenic support structures designed to withstand eddy current and halo current loads corresponding to a full-performance 2.0 MA (plasma current), 9 tesla (toroidal field) upward-going plasma disruption with a total halo current of 0.5 MA; detailed analysis to be performed with the aid of an ANSYS model of the electromagnetic transients associated with a C-Mod disruption [1]. - Rogowski coils embedded into the tile support structures to monitor halo current
levels
- A full toroidal cryogenic loop (360 degrees) located in the upper chamber, occupying only one vertical port for cryogenic feed lines.
- Upper divertor tiles/baffles arranged for optimal particle removal, using a system of 30 ‘pumping slots’; simple Monte Carlo modeling combined with C-Mod operational experience to be used to optimize design.
- Gas pressure gauges (Penning and baratron type) and an embedded Langmuir probe array to measure divertor neutral pressures and plasma fluxes to the target plates. - Minimal interruption of line-of-sight access through C-Mod’s vertical ports.
- All vacuum and cryogenic connections inside the C-Mod vessel to be welded; welding to be performed in-vessel using a robotic orbital welder system.
- Employ a partially-filled liquid helium ‘pot’ design at atmospheric pressure (4.2 K surfaces), capable of pumping hydrogen gas (4.6 K design target).
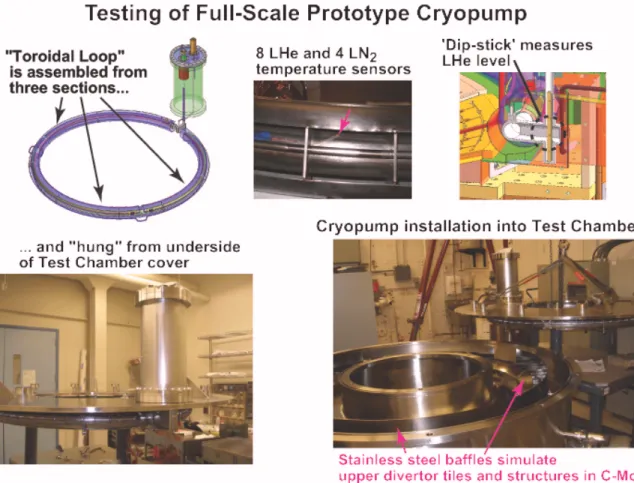
- Build a full-scale, fully-instrumented prototype pump using the planned in-vessel fabrication methods; test the prototype off-line in a dedicated vacuum chamber, assessing its pumping performance in a geometry that simulates the C-Mod divertor/tile structure.
- System pumping speed target: A minimum of 8,000 liters/s for room temperature D2
2. Full-scale prototype testing
The testing and evaluation program for the prototype pump covered four principal areas of operation: cool-down characteristics including cryogenic flow control and stability, deuterium and hydrogen pumping speed and saturation behavior, pumping/regeneration cycling, and resiliency to an up-to-air vacuum breach. Figure 5 shows the installation of the prototype pump into a toroidally shaped vacuum chamber, custom built for this purpose. The testing program was completed in the fall of 2006 as preparations were being made for the fabrication and installation of the final version of the C-Mod cryopump.
2.1 Cool-down characteristics
As stated above, the cryopump scheme employs a unique ‘pot’ design with multiple compartments for holding liquid helium, a helium inlet line (liquid) and a helium exhaust line (vapor) with a helium level sensor (‘dip-stick’). This arrangement was found to exhibit no cryogenic flow instabilities (helium or nitrogen). Cool-down to operating temperature was accomplished simply by opening the cryogenic values. Improvements the LN2 lines were identified and later implemented on the final version of the pump, including larger diameter pipes (0.375” i.d.) fastened with a nearly continuous weld bead.
Figure 5 – Arrangement for testing the Alcator C-Mod prototype cryopump.
2.2 Deuterium and hydrogen pumping benchmarks
Stainless steel baffles were installed in the test chamber to simulate the divertor tile structure in C-Mod (Fig.5). Pumping speeds were recorded for room temperature gases; these became the benchmarks for the actual pump to attain in C-Mod. The overall system pumping speed for room temperature deuterium and hydrogen was measured to be 9,700 and 12,000 liters/s respectively, under gas flow rates in the range of 25 to 50 torr-liters/s. These numbers were found to be in-line with simple estimates based on gas conductances and the active area of the cold surfaces. No saturation of pumping speed was observed up to a tested inventory of 5,500 torr-liters of deuterium frost.
2.3 Pumping/regeneration cycling
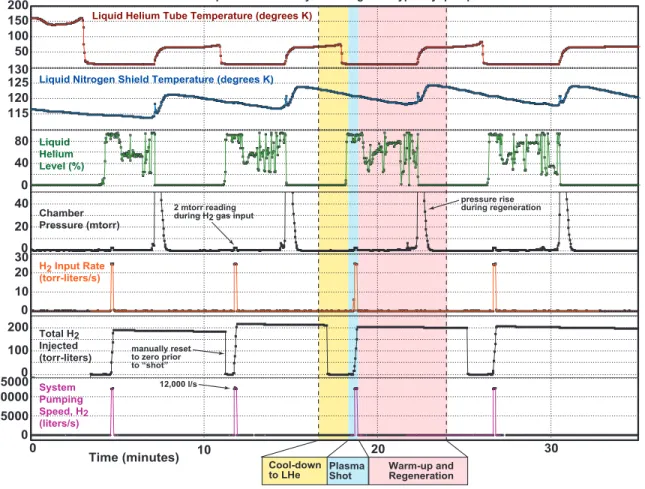
A series of tests were performed to determine the best operational scenario for cool-down, cryo-condensation and regeneration within the standard C-Mod shot cycle. Figure 6
shows the behavior of the pumping system as a series of four ‘plasma discharges’ are simulated. A simple operational sequence was identified, as illustrated by this figure:
1. Cool down to LN2 temperature before C-Mod run. This requires about 1 hour. 2. Start LHe flow (2 psi) just prior to a C-Mod shot (~7 minutes for first cool-down,
~2 minutes for subsequent).
3. The cryopump is ready for a plasma shot on the first indication of a LHe level (>60%) on the 'dip stick'.
4. Take plasma shot while maintaining LHe flow.
5. Right after shot, stop LHe flow and begin flow of warm He gas. 6. Regeneration is completed after about 4 minutes of He gas flow. Proceed to step 2 for the next C-Mod shot.
Liquid Helium Tube Temperature (degrees K)
Liquid Nitrogen Shield Temperature (degrees K)
Liquid Helium Level (%) Chamber Pressure (mtorr) 2 mtorr reading during H2 gas input
pressure rise during regeneration Cool-down to LHe H2 Input Rate (torr-liters/s) Total H2 Injected (torr-liters) System Pumping Speed, H2 (liters/s) Time (minutes) 30 0 10 20 115 120 125 130 5000 10000 15000 0 0 100 200 0 10 20 300 20 40 0 80 40 50 100 150
200 Simulation of Multiple C-Mod Shot Cycles using Prototype Cryopump Test Stand
Plasma Shot Warm-up and Regeneration 12,000 l/s manually reset to zero prior to “shot”
Figure 6 – Simulated pumping and regeneration cycles for a series of four C-Mod discharges.
It was found that this cycle can be completed in about ~11 minutes for the first one and ~7 minutes for subsequent ones – an operational scenario that is ideally suited for the standard C-Mod shot cycle (typically requiring a 15 to 20 minute time interval between successive discharges). Pumping speed for H2 was reproducibly 12,000 liters/s. Only 2 to 4 liters of LHe were consumed per simulated shot, which included a regeneration phase after each.
2.4 Up-to-air vacuum-breach test
For the final test on the prototype, an up-to-air accident was simulated. A 1-1/2” diameter i.d. gate valve was promptly opened, exposing the test chamber to room temperature atmosphere while the pump was filled with cryogenic liquids and operating normally. Resultant overpressures in the range of 30 to 45 psi were detected on the LHe exhaust line. Leak-checking revealed no evidence of any rupture or leaks in the nitrogen or helium feed systems. Visual inspection also revealed no evidence of distortion to the pump surfaces. Bellows sections that are used to connect among nitrogen and helium feed lines were found to be unaffected.
3. Upper divertor and cryopump installation
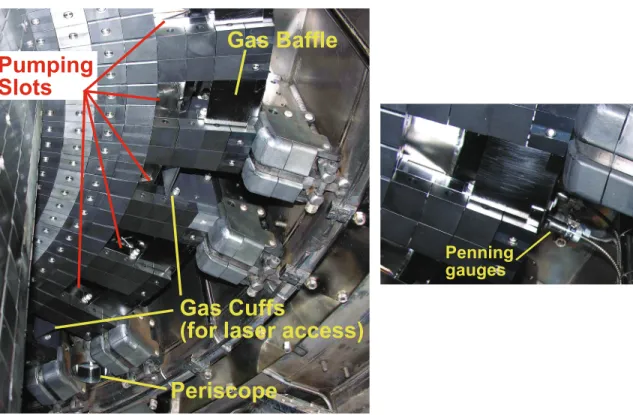
Installation of the upper divertor tile structure and cryopump occurred over the time period of January 2007 to April 2007. Figure 7 shows the process of in-vessel orbital welding and an initial fit-up of the cryopump in the upper chamber, highlighting the installed halo-current rogowski coils and the ‘hangers’ that are used to support the cryopump body. This was a period of intense activity inside the C-Mod vacuum vessel, involving not only the installation of the cryogenics system but also the installation of 30 sectors of ‘shelf plates’, ‘posts’ and baffles as well as 720 molybdenum tiles and associated hardware. A view of the final installation can be seen in Fig. 8.
Test fit-up in upper chamber
Halo current Rogowski coils
Cryopump Hanger
Completed welding of LHe lines
LHe inlet LHe exhaust
Cryopump LN2 shield
Figure 7 – Welding and installation of the cryopump body into the upper chamber of C-Mod.
Gas Baffle
Gas Cuffs
(for laser access)
Pumping
Slots
Periscope
Figure 8 – Final installation of tile support plates, molybdenum tiles, gas cuffs and gas baffles.
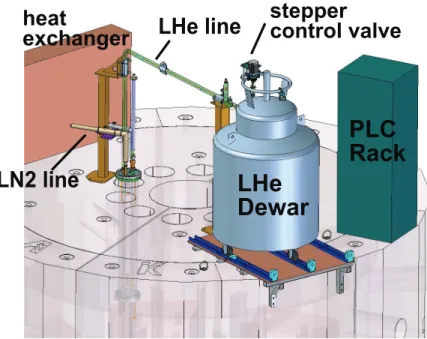
As shown in figure 9, the external components for the cryopump system consist
Penning gauges
primarily of a 500 liter liquid helium dewar, vacuum-jacketed transfer lines (nitrogen and helium) as well as a variety of control valves, sensors and an instrumentation rack, containing the PLC control system. The installation of this system was completed in early May 2007, allowing remote operation of the system from the C-Mod control room in a ‘manual’ mode.
LHe
Dewar
PLC
Rack
stepper
control valve
heat
exchanger
LHe line
LN2 line
Figure 9 – Layout of cryogenic components and control system, mounted on top of C-Mod’s radiation-shielding igloo. A stepping motor is used to remotely control the flow valve on the 500 liter liquid helium dewar.
4. Cryopump startup and initial particle pumping tests
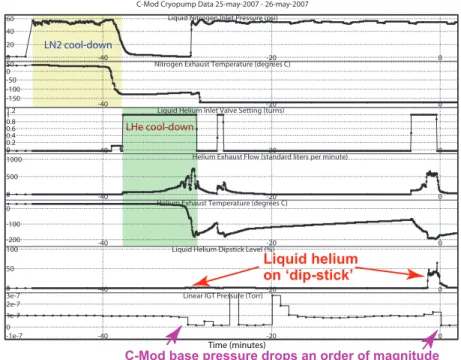
The first cool-down of the cryopump system to liquid helium temperature was attained on May 25, 2007. In response, the base pressure in C-Mod dropped by an order of magnitude (see Fig. 10). The cool-down and regeneration response times of the C-Mod pump were found to be similar to that of the prototype (Fig. 11), allowing the cryopump’s operation to be seamlessly integrated into the standard shot cycle.
A series of dedicated experiments were begun to characterize the performance of the cryopump in C-Mod, following the program outlined in mini-proposal #475, “Cryopump Startup” [2]. Figure 12 shows the results from a pumping speed benchmark test. The C-Mod pump was found to attain a system pumping speed very close to the prototype, ~9,600 liters/s for room temperature D2 gas.
C-Mod Cryopump Data 25-may-2007 - 26-may-2007
-40 -20 0
0 20 40
60 Liquid Nitrogen Inlet Pressure (psi)
-40 -20 0
-150 -100 -50 0
50 Nitrogen Exhaust Temperature (degrees C)
-40 -20 0 0 0.2 0.4 0.6 0.8 1
1.2 Liquid Helium Inlet Valve Setting (turns)
-40 -20 0
0 500
1000 Helium Exhaust Flow (standard liters per minute)
-40 -20 0
-200 -100
0 Helium Exhaust Temperature (degrees C)
-40 -20 0
0 50
100 Liquid Helium Dipstick Level (%)
-40 -20 0
-1e-7 0 1e-7 2e-7
3e-7 Linear IGT Pressure (Torr)
First cool-down of pump to LN2 and LHe temperatures
Liquid helium on ‘dip-stick’
C-Mod base pressure drops an order of magnitude
Time (minutes) LN2 cool-down
LHe cool-down
Figure 10 –First cool-down of both nitrogen and helium cryogenic loops in C-Mod.
C-Mod Cryopump Data 25-may-2007 - 26-may-2007
440 450 460 470 480 0 0.2 0.4 0.6 0.8 1
1.2 Liquid Helium Inlet Valve Setting (turns)
440 450 460 470 480
0 500
1000 Helium Exhaust Flow (standard liters per minute)
440 450 460 470 480
0 50
100 Liquid Helium Dipstick Level (%)
440 450 460 470 480
0 1e-6 2e-6
3e-6 Linear IGT Pressure (Torr)
440 450 460 470 480 0 10 20 30 40 TC3 Pressure (mTorr)
Seamless integration of cryopump operation with shot cycle
(operated in a ‘manual’ mode for these shots)
Regeneration
Cooldown
Plasma
Time (minutes)
Figure 11 – Repeated cycles of cryopump cool-down, plasma operation and cryopump regeneration, synchronized with the standard C-Mod shot cycle.
20 40 60 Torr-l/s D2 Injection Rate 0 2 mtorr Torus Pressure 0 1 2 3 4 seconds 0 5.0•103 1.0•104 1.5•104 liters/s
System Pumping Speed
Pumping speed = 9.62E+03 liters/s
Figure 12 – Measurement of system pumping speed for room temperature D2 gas. The
C-Mod pump was found to essentially reproduce the pumping speed benchmark set by the full-scale prototype unit, ~ 9,600 liters/s.
The performance of the pump for particle removal and density control was found to be excellent in moderate-density upper single-null (USN) discharges, as show in Fig. 13. A steady state particle removal rate of ~140 torr-l/s is demonstrated in this discharge with the line density held constant at the programmed value. In order to achieve this rate of gas injection (which exceeds the maximum available from C-Mod’s pulse gas valve system) a supplemental gas puff of ~50 torr-l/s from the NINJA gas injection system was required. The typical helium consumption for a full day of operation was found to be 60 to 90 liters.
1070525026 0.0 0.5 1.0seconds 1.5 2.0 0.0 0.5 1.0seconds 1.5 2.0 0.2 0.4 0.6 0.8 1.0 10 20m -2 NL04 0.0 0.5 1.0seconds 1.5 2.0 0.0 0.5 1.0seconds 1.5 2.0 100 200 Torr-l/s Injection Rate 0.0 0.5 1.0seconds 1.5 2.0 0.0 0.5 1.0seconds 1.5 2.0 2 4 6 8 mtorr UDIV Pressure 0.0 0.5 1.0 1.5 2.0 seconds 0
Figure 13 – Demonstration of excellent particle throughput and density control in a
standard, moderate density, upper single-null discharge. A steady-state D2 removal rate of
5. Density control physics experiments
Experiments were performed to examine the relationship between density control and plasma phenomena associated with magnetic topology, magnetic field direction and confinement regime, initially as part of MP#475 and then in subsequent mini-proposals that were designed to exploit the cryopump for physics investigations (for example, MP#485, “H-mode density control and pedestal response to cryopumping” [3] and MP#506, “H-modes with cryopumping in USN, normal field direction” [4]). These experiments were performed during the last three months of C-Mod’s FY07 run campaign (June-August, 2007).
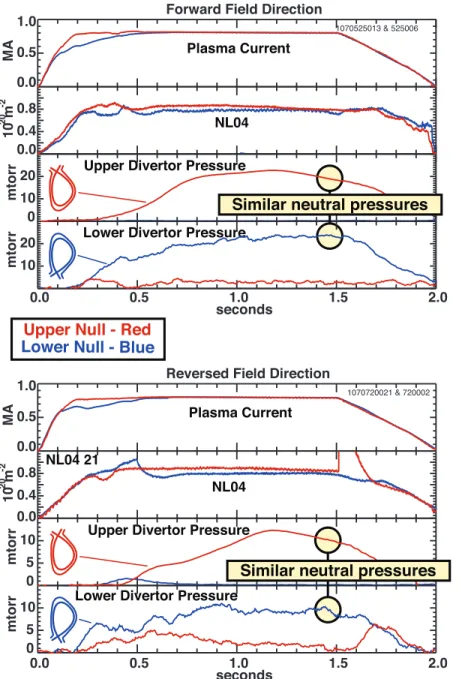
Static pressures in the upper and lower divertor were studied as a function of magnetic topology (USN/LSN) with both forward and reversed field. As shown in Fig. 14, the static pressures in the upper chamber in USN were found to be very similar to those in the lower divertor for LSN for otherwise similar discharges (both forward and reversed magnetic field). This was taken as evidence that the toroidal slot geometry of the upper divertor was functioning as intended, providing a ‘neutral compression’ that was comparable to that produced by the closed, toroidally-symmetric lower-divertor geometry. In other words, our choice of placing a large, toroidal-loop cryopump in the upper divertor was a good one: The upper divertor slot/baffle arrangement provides the same neutral pressure as the lower divertor – a location where we cannot install such a large cryopump system.
As seen in Fig.14, the neutral pressures in the ‘active divertor’ (i.e., lower divertor for LSN and upper divertor for USN) are systematically lower with reversed magnetic field operation. This result appears to be connected to some well known ‘divertor asymmetries’ effects that are present in C-Mod and other tokamaks and associated with the magnetic field direction (ExB drifts are thought to play a role). Since the pumping slots in the upper divertor are connected to the outer divertor leg only, the divertor neutral pressure is higher when a high-recycling condition is achieved in the outer divertor leg. Experiments have shown that this condition is favored with forward B-field direction and USN – precisely the situation for which the cryopump was optimized. Apparently, because the toroidal ‘pumping slot’ in the lower divertor samples both the inner and outer divertor legs (via the private flux region), high neutral pressures there depend on attaining a high-recycling
regime in the inner divertor leg, a condition that is favored with forward field direction and LSN topology. Thus, the experiments that were performed in support of MP#475 have helped to expose some of these plasma physics subtleties and form a good basis for planning future experiments.
Upper Null - Red
Lower Null - Blue
Forward Field Direction
0.0 0.5 1.0 MA Plasma Current 0.0 0.4 0.8 10 20 m -2 NL04 0 10 20 mtorr
Upper Divertor Pressure
10 20
mtorr
Lower Divertor Pressure
0.0 0.5 1.0 1.5 2.0
seconds
Similar neutral pressures
Lower Divertor Pressure
Plasma Current
NL04
Upper Divertor Pressure
Reversed Field Direction
0.0 0.5 1.0 MA 0.0 0.4 0.8 10 20 m -2 NL04 21 0 5 10 mtorr 0 5 10 mtorr 0.0 0.5 1.0 1.5 2.0 seconds
Similar neutral pressures 1070720021 & 720002 1070525013 & 525006
Figure 14 – Comparison of static neutral pressures (i.e., without pumping) in the upper and lower divertors for upper single-null (USN) and lower single-null (LSN) magnetic topologies in ohmic L-mode discharges. Top panel is with forward magnetic field and current while the bottom panel is with reversed. The upper divertor pressure in USN is found to be similar to the lower divertor in LSN – evidence that the pumping slot geometry is working as intended. Peak divertor pressures are about a factor of two lower with reversed field direction.
As the plasma density is lowered, both inner and outer divertor legs change over to a low-recycling regime and, as a result, the plasma fluxes to the divertor surfaces drop faster than linear with plasma density. This ‘divertor physics effect’ limits the particle-pumping throughput of the cryopump at low densities. Figure 15 shows a comparison of a pumped and non-pumped USN discharge in which the gas fueling was turned off at 0.7 seconds. An initial fast density decay is followed by a slower pump-out of the plasma density. The slow pump-out phase occurs after the change over from high- to low-recycling on the divertor plate (see drop in divertor probe flux on Fig. 15).
Despite the large gas throughputs that are generated by a combination of puffing and pumping, the local divertor conditions (density, temperature, target flux) were found to remain similar for otherwise similar core plasma conditions. Figure 15 illustrates this point. For times between 0.5 and 0.7 seconds, the trace labeled “divertor probe flux” is found to be unchanged in going from “pump off” to “pump on” (a change from zero to ~100 torr-l/s throughput). While this result may seem surprising at first, it is actually consistent with our expectations since the cryopumping system removes, at best, only a small fraction (~4%) of the incident plasma flux striking the divertor surfaces.
The physics of H-mode, with its prompt formation of a ‘density pedestal’ at the L-H transition, also impacts the effectiveness of the cryopump for core plasma density control. Figure 16 shows a comparison of and L-mode and an H-mode discharge, both with strong cryopumping applied after 0.75 seconds. In these cases, the cryopump is effectively ‘turned on’ by programming a step change in plasma equilibrium from LSN to USN (see “x-point balance” trace). The fast density rise associated with the first L-H transition (and others) is seen to be much faster than the time scale for the pump to remove particles from the vacuum vessel. However, the pump does gradually deplete the plasma density in both discharges over a longer time scale. When the H-mode discharge momentarily transitions back to L-mode, it has a density similar to that of the L-mode discharge. These results indicate that despite the occurrence of transient L-H transitions, the overall particle pump throughput is relatively insensitive to these events.
0.0 0.5 1.0seconds 1.5 2.0 0.0 0.5 1.0 MA Plasma Current 0.0 0.5 1.0seconds 1.5 2.0 0.0 0.2 0.4 0.6 0.8 1.0 1.2 10 20m -2 Line Density 0.0 0.5 1.0seconds 1.5 2.0 0 50 100 150 Torr-l/s
Gas Injection Rate
0.0 0.5 1.0seconds 1.5 2.0 0.0 0.5 1.0seconds 1.5 2.0 0 10 20 mtorr
Upper Divertor Pressure
0.0 0.5 1.0seconds 1.5 2.0 0 2 4 6 amps
Divertor Probe Flux
0.0 0.5 1.0 1.5 2.0
seconds
Pump on
Pump off
Figure 15 – Comparison of a pumped and non-pumped discharge in which the gas fueling is turned off at 0.7 seconds. The prompt density decay after 0.7 seconds is followed by a slower ‘pump-out’ of the plasma density – a time when the divertor changes from a high to a low-recycling regime. 1070601030 & 29 0.0 0.5 1.0seconds 1.5 2.0 0.0 0.5 1.0seconds 1.5 2.0 0.0 0.5 1.0 1.5 2.0 10 20 m -2 Line Density 0.0 0.5 1.0seconds 1.5 2.0 0.0 0.5 1.0seconds 1.5 2.0 0 10 mm Upper Null 0.0 0.5 1.0 1.5 2.0 seconds
L-mode reference plasma L-H density rise
Lower Null
X-point Balance
(EFIT SSEP parameter)
-10
Figure 16 – Comparison of pumped L- and H-mode plasmas. The magnetic topology is changed from lower-null dominant to upper-null dominant at 0.75 seconds, causing the upper divertor cryopump to ‘pump-out’ the discharge after that time. The cryopump’s particle removal rate cannot complete with the prompt density rise associated with an L-H transition. However, independent of confinement mode, the pump does provide a gradual ‘pump-out’ of the plasma density over a longer time scale.
An interesting and unanticipated consequence of the upper divertor cryopump operation is its effect on the toroidal distribution of neutrals in C-Mod. As shown in Fig. 17, gas is injected into the C-Mod torus at the location of “B-side”. With the cryopump turned on, a large gas puff is needed to maintain a constant plasma density. Since the cryopump exhausts the torus in a toroidally symmetric way, this combination of pumping and puffing leads to a change in the toroidal distribution of neutral pressures. As shown in Fig. 17, neutral pressures at the location of “G-side” decrease with strong puffing/pumping while pressures at “CB-side” increase. This redistribution of neutrals was found to be beneficial for the operation of the J-port ICRF antenna during this run campaign, due to an RF break-down limit at high neutral pressures.
Finally, the cryopump has demonstrated its utility in producing controlled, steady-state plasmas with a high radiation level, maintained by the continuous injection of a non-recycling impurity gas. Figure 17 shows the time traces from an USN discharge in support of MP#502 [5], which combined the tools of strong cryopumping, strong D2 gas puffing and steady-state argon injection. This discharge represents a new research capability for C-Mod – a direct consequence of the successful implementation of the upper divertor cryopump system.
6. Summary
A new upper divertor cryopump system has been successfully installed and operated in Alcator C-Mod. The system is a fully integrated divertor and cryopump design that employs a number of unique features including a ‘pumping-slot’ style divertor target and a full toroidal cryogenic loop that acts as a compartmentalized liquid helium ‘pot’ (or as a turbulized pipe for the case of forced liquid helium flow). The system is found to function as intended, providing C-Mod with a new high-throughput particle exhaust tool (exceeding 9,000 liters/s for room temperature D2 gas) while minimizing helium
consumption and avoiding a complex external cryogenic system. Dedicated experiments were performed during the FY07 run campaign to explore the capability of the pump for particle exhaust and plasma density control as a function of magnetic topology, plasma density and confinement regime. These experiments have provided valuable information, demonstrating the pump’s utility for future physics experiments and for expanding the research capabilities of Alcator C-Mod.
The activities outlined in this report satisfy the Alcator C-Mod’s FY07 project milestone, “Investigate particle and density control with the new upper divertor cryopump”.
Acknowledgements
The first author wishes to thank the entire cryopump team for the Herculean effort that was required to make this pumping system a reality in Alcator C-Mod. This work is supported by U.S. D.o.E. Coop. Agreement DE-FC02-99ER54512.
A B C D E F G H J K B G CB 0.0 0.5 1.0seconds 1.5 2.0 0.0 0.5 1.0seconds 1.5 2.0 0.0 0.4 0.8 1.2 10 20 m -2 Line Density 0.0 0.5 1.0seconds 1.5 2.0 0 50 100 150 Torr-l/s
Gas Injection Rate
0.0 0.5 1.0seconds 1.5 2.0 0.0 0.5 1.0seconds 1.5 2.0 0.0 0.2 0.4 0.6 mtorr
‘G-Side’ Neutral Pressure
0.0 0.5 1.0 1.5 2.0 seconds 0.0 0.5 1.0 1.5 mtorr
‘CB-Side’ Neutral Pressure
Pump on
Pump off
“G-Side”
“CB-Side”
“B-Side” Gas Injection
Figure 17 – Strong cryopumping combined with gas-puffing from the “B-side” fueling valve leads to a change in the toroidal distribution of neutral pressures.
Shot# 1070830032
Plasma Current (MA)
0.0 0.2 0.4 0.6 0.8 1.0 Line Density 0 5.0•1019 1.0•1020 ICRF Power (MW) 0 1 2 3 4
Argon Gas Puff 0 2 6 10 Radiated Power (MW) 0.0 0.2 0.4 0.6 0.8 1.0 1.2 1.4 0.0 0.2 0.6 1.0 seconds
Figure 18 – Example of a steady-state, radiative plasma with continuous injection of argon. Such discharges represent a new research opportunity in C-Mod, made possible by the successful implementation of the upper divertor cryopump system.
References
[1] Titus, P., Zaks, J., Vieira, R., Gwinn, D., and Labombard, B., "C-MOD cryopump design
and analysis," presented at the 21st IEEE/NPSS Symposium on Fusion Engineering, Knoxville, TN, USA, 2007.
[2] B. LaBombard, B. Beck, J. Bosco, R. Childs, D. Gwinn, J. Irby, R. Leccacorvi, S.
Marazita, N. Mucic, S. Pierson, Y. Rokhman, P. Titus, R. Vieira, J. Zaks, A. Zhukovsky, “Cryopump Startup”, Alcator C-Mod mini-proposal #475,
http://www.psfc.mit.edu/research/alcator/program/cmod_runs.php
[3] J.W. Hughes, B. LaBombard, M. Greenwald, A. Hubbard, B. Lipschultz, J. Terry, D.
Whyte, W.L. Rowan, R. McDermott, K. Marr, I. Bespamyatnov, M. Reinke, “H-mode density control and pedestal response to cryopumping”, Alcator C-Mod mini-proposal
#485, http://www.psfc.mit.edu/research/alcator/program/cmod_runs.php
[4] J.W. Hughes, B. LaBombard, M. Greenwald, A. Hubbard, B. Lipschultz, J. Terry, D.
Whyte, W.L. Rowan, R. McDermott, K. Marr, I. Bespamyatnov, M. Reinke, “H-modes with cryopumping in USN, normal field direction”, Alcator C-Mod mini-proposal#506,
http://www.psfc.mit.edu/research/alcator/program/cmod_runs.php
[5] M. Reinke, A. Ince-Cushmann, J. Rice, B. Labombard, A. Graf B. Lipschultz and W.
Rowan, “HIREX-SR Calibration Plasmas”, Alcator C-Mod mini-proposal#502,