Processes David N. Ford
and
John D. Sterman
Dynamic Modeling of
Product Development Processes
David N. Ford' and John D. Sterman2
January 1997
The authors thank the Organizational Learning Center and the System Dynamics Group at the Sloan School of Management, and the "Python" organization for financial support. Special thanks to the members of the Python project for their interest, commitment and time.
Associate Professor, Department of Information Sciences, University of Bergen, N-5020 Bergen, Norway <[email protected]>
2 J. Spencer Standish Professor of Management, Sloan School of Management, Massachusetts Institute of
Technology, 50 Memorial Drive, E53-351, Cambridge, MA 02142 USA <[email protected]>
Dynamic Modeling of Product Development Processes
David N. Ford and John D. Sterman
Abstract
Successful development projects are critical to success in many industries. To improve project performance managers must understand the dynamic concurrence relationships that constrain the sequencing of tasks as well as the effects of and interactions with resources (such as labor), project scope and targets (such as delivery dates). This paper describes a multiple phase project model which explicitly models process, resources, scope and targets. The model explicitly portrays iteration, four distinct development activities and available work constraints to describe development processes. The model is calibrated to a semiconductor chip development project. Impacts of the dynamics of development process structures on research and practice are discussed.
Introduction
Developing products faster, better and cheaper than competitors has become critical to success in many markets whether the product is an office building, software package, or computer chip. This has made the performance of product development projects an increasingly important area of competitive advantage. In response to these pressures many industries have shifted from a sequential, functional development paradigm to a concurrent, team based paradigm. Increasing concurrence and cross functional development also dramatically increases the dynamic complexity of product development (Smith and Eppinger, 1995; Wetherbe, 1995; Osborne, 1993). But the mental models used by developers and managers to evaluate, estimate and manage projects have not generally improved to include dynamic influences on performance. The resulting lack of understanding (Diehl and Sterman, 1995; Sterman, 1994; Paich and
Sterman, 1993; Rechtin, 1991) and inadequate decision heuristics (Kleinmuntz, 1993) have contributed to the frequently cited poor management of development projects (CII, 1990; Womack, Jones and Roos, 1990; Dertouzos, Lester and Solow, 1989; Davis and Ledbetter, 1987;
Pugh, 1984; Abdel-Hamid, 1984; Brooks, 1975).
Many aspects of projects influence performance including the development process, resources, project scope, and targets. A project's development process describes the flows of work among development phases and the completion of development tasks within each phase. The
characteristics of a development process describe the relative difficulty of development activities, concurrence relations among activities, delays within processes such as defect discovery and iteration within and between phases. The quantity and effectiveness of resources constrain the rate at which different development activities are performed by limiting development capacity. A project's scope helps define completion by describing the amount of work required to complete each phase of development. Targets describe acceptable levels of performance and project priorities. The development process, resources, scope and targets of a project interact in complex ways to drive project performance.
Traditional project management models based on the Critical Path Method and PERT (Moder, Phillips and Davis, 1983; Halpin and Woodhead, 1980) staticly describe process, resources, targets and scope with activity duration estimates and precedence relationships describing the network flow of activities. These descriptions are used to predict the effects of process, resources, targets and scope on performance (primarily schedule). These methods are limited by their use of an indirect project measure (time) and by bundling the characteristics of and relationships among scope, resources, and processes in each activity into a single duration estimate. They also tend to ignore iteration or require that iteration be implicitly incorporated into duration estimates and precedence relationships. For example if a product definition defect is released to the designers who then discover the defect after design work has begun then the development process must feed back the defect from the design phase to the product definition phase and repeat the product definition (i.e. iterate), thereby increasing total project duration and cost.
Other research approaches identify some dynamic consequences of different project structures on project performance. For example the dynamic consequences of iteration among project phases on cycle time have been addressed directly with Steward's (1981) and Eppinger, Whitney, Smith and Gebala's (1994) Design Structure Matrix. The Design Structure Matrix has been used to map (Smith and Eppinger, 1995) and predict (Morelli, Eppinger and Gulati, 1995) information flows among development phases, study both time/quality tradeoff decisions (Chao, 1993) and variability in cycle times (Osborne, 1993). Design Structure Matrix research demonstrates the results of iteration between phases but does not describe or model the underlying processes which drive cycle time. A description of the process structure in the form of the causal relationships that generate project behavior is needed to investigate how project processes drive performance.
To be complete such a causal dynamic project model must explicitly model and integrate the influences of processes, resources, scope and targets on performance. Three of these four features have been modeled extensively by system dynamics researchers. Several system dynamics models have been used to model project resources and investigate the effects of resource management on project progress (e.g. Richardson and Pugh, 1981; Cooper, 1980, Roberts, 1974; Homer, Sterman, Greenwood and Perkola, 1993). For example Abdel-Hamid (1984) built a system dynamics model of software development in which progress is driven by the daily work force of software developers (resource quantity) and software developer productivity (resource effectiveness). Considerable attention has also been given to the secondary effects of changes in project scope. Cooper (1980) and Reichelt (1990) related owner initiated design changes to total scope of work and litigation costs, and Pugh-Roberts Associates (Cooper, 1980) among others (Williams, Eden, Ackermann and Tait, 1995) have used such models extensively and successfully in support of litigation over cost overruns in aerospace, defense, shipping and construction. The influences of schedule targets on performance have been modeled by Abdel-Hamid (1984), Richardson and Pugh (1981) and Roberts (1974) and the evolution of one form of project targets (customer demands) in response to performance has been studied by Fiddaman, Oliva and Aranda (1993). But little investigation of how the demands and constraints of different development processes influence project performance has been made. The general exclusion of development process structures from project models implicitly assumes that development processes have no impact on project performance. Yet the availability of work as described by the precedence relationships within and between phases is an important constraint on project performance (Rosenau and Moran, 1993; Clark and Fujimoto, 1991; Wheelwright and Clark, 1992; Modor et al., 1983; Halpin and Woodhead, 1980). This simplifying assumption can also lead to grossly unrealistic performance predictions under extreme conditions. For example a project model driven solely by resources allows schedule and quality performance to improve as resources grow until, at the limit of infinite labor, the project is predicted to be completed in an infinitesimally small time.
A more suitable description of development dynamics must include iterative flows of work, distinct development activities and available work constraints. The existing system dynamics models of projects which include process structures have focused on the roles of two development activities. Cooper (1994, 1993a,b,c, 1980) first and several researchers subsequently (e.g. Kim, 1988; Abdel-Hamid, 1984; Richardson and Pugh, 1981) modeled two development activities by distinguishing between initial completion and rework. Ford, Hou and Seville (1993) expanded this approach to model three development activities (initial completion, required rework and optional rework to improve quality). However these models do not include
other important development activities identified in the product development literature including quality assurance (Rosenau and Moran, 1993; Rosenthal, 1992; Wheelwright and Clark, 1992) and coordination (Adler, 1995, Cooper and Kleinschmidt, 1994; Clark and Fujimoto 1991). Abdel-Hamid's model includes quality assurance and accounts for the impact of coordination on the productivity of workers within a project but not between project phases. System dynamics models of iterative flows have evolved from single flows of accurate work slowed by implicit iteration through separate streams of correct and flawed tasks (Abdel-Hamid, 1984; Richardson and Pugh, 1981) to more realistic closed-loop flows (Ford, 1995; Ford et al., 1993; Kim, 1988). Homer et al. (1993) first described development processes with available work constraints imposed by a development phase on itself or imposed on a downstream phase. The dynamic concurrence constraints in the model described in this paper have their conceptual foundation in the Homer et al. model. In this work distinct development activities, iteration and dynamic concurrence are integrated in a single model to describe development processes in a generic and flexible form.
This paper describes a product development project model which explicitly models all four performance drivers - process structure, resources, targets and scope. We calibrated and tested the model for the case of a medium-scale semiconductor product development project. We focus on the modeling and role of dynamic concurrence on project performance. The importance of
integrating process structure with resources, scope, and targets in dynamic models of projects and future research is discussed.
The Product Development Project Model
Our model simulates the performance of a multiple-phase development project. Each phase is represented by a generic structure which is customized to reflect a specific stage of product development such as preparing construction drawings for building an office complex, writing software code or testing computer chip prototypes. The generic phase structure has four subsystems which interact and impact project performance. The four subsystems are development processes, resources, scope, and targets. We use the three traditional measures of project performance (time, quality and cost). They are reflected in the model with cycle time, defects, and cost. Primary phase subsystems interactions are shown in Figure 1, including a floating goal structures, resource constraints and the generation of a demand for resources by development processes. The development processes subsystem is the focus of this work. Ford (1995) describes the other subsystems in detail.
Process Structure
Resources
----1 L/CIIIWIU I- Development Activites Phase Dependencies Process Performance Limit - -(Cycle Time TotalToal Defect Rate
Work I
"'Required I Cost
Scope
Targets
Figure 1: Phase Subsystems
The links between project phases can be described with a project network diagram (Figure 2).
LEGEND
I--* Products of Development Phase \ / Return Errors for Correction
U7
Development PhaseN.1
Figure 2: A Project Network
Quantity Allocation among Development Activites Effectiveness I L " _
If the dependencies within individual phases and between the phases in this network are described with a Design Structure Matrix (Eppinger et al., 1994) over 80% (13 of 16) of the cells are occupied. This indicates a highly interdependent process in which iteration is particularly important. These links shown in Figure 2 represent several forms of inter-phase interaction,
including:
* Work progress in upstream phases constrains progress in their dependent downstream phases. These constraints are shown by the solid arrows in the project network. * Defects inherited by downstream phases from upstream phases corrupt downstream
work which must then be corrected. When inherited defects are discovered by a downstream phase they are returned for correction to the phase where the defect was
generated. These flows are shown by the dashed arrows in the project network. * The correction of defects requires coordination between the phase that discovered the
defect and the phase that generated the defect.
* Schedule, quality, and cost performance in individual phases influence the conformance of the entire project to the project targets. The responses of project managers to performance affects the targets set for each project phase.
The model allows us to represent projects with an arbitrary number of phases which can be linked in an arbitrarily complex network of concurrence relations, including sequential, parallel, partially concurrent and other dependent relationships. The fundamental units which flow through a project are "development tasks". Conceptually a development task is an atomic unit of development work. Examples of development tasks include the selection of a pump, writing a line of computer code and installing a steel beam. The unit of work used to describe a development task may differ among project phases. For example a product definition phase might use product specifications as the basis for tasks whereas the design phase of the same project might use lines of computer code. We assume tasks within a phase are uniform in size and fungible. This assumption becomes more accurate as task size decreases. Therefore relatively small pieces of development work are selected as tasks. Fungible tasks are characteristic of some development project phases (e.g. the delivery and placement of soil for a roadbed). Many other development phases have interdependent but fungible tasks (e.g. software code as in Abdel-Hamid, 1984). Tasks are also assumed to be small enough to be defective or correct but not partially defective. This assumption also becomes more accurate as task size becomes smaller. These assumptions help identify divisions among development phases and development tasks.
We describe development within a project with four activities: initial completion, quality assurance, iteration and coordination. Initial completion is finishing a development task the first
time. Quality assurance is the inspection of tasks for defects. Work on tasks subsequent to their initial completion to correct defects or improve quality is referred to as iteration. Coordination is the integration of the product development project among phases. An example of coordination is when designers work with marketers to refine product specifications. Project processes, resources, scope and targets influence all four development activities. By customizing the characterizations of these features the model can be used to represent many different types of development projects. Process structures simulate the constraints which different development activities, their interactions and the availability of work within and among phases impose on progress. Resource structures simulate the effects of work force sizes, the allocation of labor among the four development activities, productivity, experience and fatigue. Scope structures model the original scope of work for each phase and scope changes in response to schedule, cost and quality pressures. Target structures simulate the specification and modification of overall project and phase-level targets for cycle time, quality, and cost relative to targets and the pressures on developers due to poor performance.
Describing Development Processes
Development Processes in a Single Project Phase
Individual development phases include processes which can constrain project progress. Consider as an example the erection of the structural steel skeleton for a ten story building. The steel erection requires that the structural members (the columns, beams and bracing) be installed, inspected for proper installation and corrected if the installation is found to be defective. For any given technology an average amount of time is required for each of these three development activities to be performed for each structural member, regardless of the quantity or effectiveness of the resources (e.g. laborers and cranes) applied. These average process durations are unique characteristics of the structural steel installation, inspection, and correction activities and descriptive of the development process used in the steel erection phase of the project. An additional constraint imposed by the structure of these three development activities is that they cannot be performed simultaneously on any single structural member since inspection requires that initial installation be complete and correction of defective work requires that any defects have been discovered through inspection. Additionally, work on some steel members such as beams must wait for the completion of other work such as the installation of the columns which support those beams. Therefore not all the structural members can be worked on simultaneously. This feature of the steel erection process limits the availability of work based on the amount of work which has been completed and therefore limits the degree of concurrent development possible within a single development phase. Finally, after installation, inspection and any required correction of structural members which have been approved may not be released to
subsequent development phases until a discrete number of members have been approved. For example approved steel work may not be released for the installation of utilities until all the steel on an entire floor of the building is approved. This can also delay the final completion of the development phase. How can these constraints be modeled?
Our model uses three features to describe the development process in a single phase: circular iteration, multiple development activities and dynamic concurrence. Circular iteration is described with the stock and flow structure (Figure 3). In our model development tasks flow into and through four states: tasks Completed but not Checked (CnC), Tasks to be Iterated (TtIter), Tasks Approved (TAppr) and Tasks Released (TRel). Tasks are completed for the first time through the performance of the initial completion activity (IC). They accumulate in the Completed not Checked stock. If no tasks are defective or those defects are not found during quality assurance (QA) the tasks leave the Completed not Checked stock and pass through the Approve Tasks (ApprT) flow into the stock of Tasks Approved (TAppr). Approved tasks are subsequently released through the Release Tasks (RelT) flow to the stock of Tasks Released (TRel). This represents delivering tasks to the managers of downstream phases or to customers. Defective tasks are discovered through the Quality Assurance (QA) activity. Tasks found to be defective move through the Discover Defective Tasks (DDT) flow from the Completed not Checked stock to a stock of Tasks to be Iterated. These tasks are corrected or improved through the Iterate Tasks (IterT) activity and returned to the Completed not Checked stock. Defects can be generated during both initial completion and iteration. The structure of these stocks and flows is shown in Figure 3 with the variable name abbreviations and their equation numbers.
An analogy of paper passing among boxes on the project manager's desk can clarify the movement of tasks through a development phase. Each task is written on a sheet of paper. The scope of the phase is the number of sheets of paper. The tasks currently available for initial completion are the papers in the project manager's "In" box. Initial completion activity completes the tasks, shifting the pieces of paper from the "In" box to the project manger's "Work to be Checked" box, which contains the contents of the Completed not Checked stock. Quality assurance moves sheets of paper from the "Work to be Checked" box into the project manager's "Corrections Required" box (Tasks to be Iterated) or to the "Okay" box (Tasks Approved). When the project manager considers the number of sheets of paper in the "Okay" box to be sufficient he shifts them into the "Done" file (Tasks Released).
Ttlter (2) Tasks to be Iterated
I-i _A
Discover Defective Task rate DDT (7) IterT (5) Itprnt Trick rt ApprT (8) ReIT (9) · A ... Tl ..K r . . eea I t.ak f
'
'1
I
I1Ifl
1L1I
1()
V
1Tasks Completed CnC (1) m_ ~-Lo
Initial Completion rate IC (11)
ot Checked U- Tasks Approved U Tasks Released
TAppr (3) TRel (4)
Figure 3: Development Process Model Stocks and Flows of a Single Phase
Four differential equations describe the flows of development tasks through any single phase j in a project of n phases where j E { 1,2...,n }. We omit the subscript j for clarity.
(d/dt)(CnC) = IC + IterT - DDT - ApprT (1)
(d/dt)(Ttlter) = DDT - IterT (2)
(d/dt)(TAppr) = ApprT - RelT (3)
(d/dt)(TRel) = RelT (4)
The primary feedback loops in the model's process structure for a single phase are shown in Figure 4. The negative loop depicts the reduction in the number of tasks available for initial completion as work is completed. The initial completion rate is based on the Tasks Available for Initial completion, the Average Initial Completion Duration and the Resource Constraint. An increase in the initial completion rate increases the number of Tasks Completed, which decreases the number of Tasks Available for Initial Completion, which reduces the initial completion rate. This loop introduces the feature we use to describe each of the development activities in a specific development phase, the Average Process Activity Duration. The Average Process
i ---
--I 11 r -I
Activity Duration is the average time required to complete a development activity on a task if all required information, materials and resources are available and no defects are generated. It describes the purest time constant the process imposes on progress by answering the question "How fast (on average) would a development activity on a task be completed if everything needed was available?" For example "How fast would a structural steel member be installed if all the best equipment and installers were available and knew where and how to install the member?" In Figure 4 the Average Process Activity Duration is applied to initial completion. The model uses structure similar to the negative loop shown in Figure 4 to describe the role of the Average Quality Assurance Duration in discovering defective tasks, the Average Iteration Duration to correct defects, and the Average Coordination Duration to resolve inter-phase concerns. In-Phase Task Concurrence constraint Resource Tasks Constraint + Tasks Constraint +_ Completed
(labor quantity in Phase \
& productivity) ,I ¢ | Fraction of Tasks Basework ( Available Minimum Basework Duration
Rate \ (In-Phase constraint)
Inter-Phase Task Concurrence constraint Number of TsekLc in _r rTl-Zraction of Tasks A., lthl_
- MrdAIU I Ul I dlaSS 'VlIidUIrl
Phase Released from (Inter-Phase constraint)
Upstream Phases
Figure 4: Feedback Loops in a Single Development Phase for a Initial Completion Development Activity
I
i-Three development activities drive the flows of tasks in each project phase: initial completion, quality assurance and iteration. Each activity requires both that sufficient resources are available to undertake the work (that is, enough skilled workers) and that enough of the information and material needed to complete the activity is available (that is, that there is a stock of tasks which can be addressed as a result of completion of prior activities). Therefore the progress rate for each of the three development activities is the minimum of the rate allowed by resources and the rate allowed by the process of performing the specific development activity. The equations for the four flows in a single phase which depend directly on development activities are based on the Resource Constraint, the Average Process Activity Durations of the three development activities and the work available for each activity. The work available for the iteration activity is the number of tasks known to require iteration. Therefore the average iteration rate is the lesser of the Iteration Resource Constraint (RCIterT) and the number of tasks waiting for iteration divided by the average time which the process requires to perform iteration on a task, the average iteration duration (AID):
IterT = Min(RCIterT, TtIter / AID) (5)
In a similar manner the work available for the quality assurance activity is the number of tasks Completed but not Checked. Therefore the average quality assurance rate (QA) is the lesser of the Quality Assurance Resource Constraint (RC QA) and the number of tasks waiting for quality assurance (CnC) divided by the average time which the process requires to perform quality assurance on a task (AQAD):
QA = Min(RCQA, CnC / AQAD) (6)
The two flows based on the quality assurance activity include explicit modeling of the generation and discovery of defects. We assume that quality assurance efforts are not perfect and some defects are missed. Therefore some defective tasks are mistakenly considered to be correct and are approved and subsequently released to downstream phases with the tasks which do not contain defects. We assume that no tasks which are not defective are mistakenly considered defective. We model defect rates with the probability of a defect existing in a task (p(TDef)) and the accuracy of quality assurance with the probability of discovering a defect if it exists (p(DiscDef)). Defects are modeled with a parallel coflow structure similar to the development task structure. The equations for the defect coflow structure are shown in the appendix. The number of tasks found to be defective is the product of the quality assurance rate, the probability of a defect existing in a task (p(TDef)) and the probability of finding a defect if it exists
(p(DiscDef)). The Approve Tasks rate (ApprT) is the number of tasks checked by quality assurance but not found to have defects. Therefore the formulations for the Discover Defective Tasks rate (DDT) and Approve Tasks rate (ApprT) are:
DDT = QA * p(TDef) * p(DiscDef) (7)
ApprT = QA - DDT (8)
Approved tasks are released in packages whose size is defined by the Release Package Size (RelPackSize) which activates a Release Trigger (RelTrig). This package size describes the minimum number of unreleased tasks (in percent) to be released in a package. All the tasks which have been approved are released when the number of Tasks Approved exceeds this threshold. Therefore the equations for the Release Tasks flow is:
RelT = TAppr * RelTrig (9)
RelTrig = IF (RelPackSize / (PS - TRel) >= TAppr), THEN (1) ELSE (0) (10)
The Initial Completion rate (IC) is formulated similarly to the iteration and quality assurance rates. The initial completion rate is based on the Resource Constraint (RCIC), the Average Initial Completion Duration (AICD) and the work available for initial completion (ICAvail):
IC = Min(RCIC, ICAvail / AICD) (11)
The number of tasks available for initial completion (ICAvail) depends on the Internal Process Concurrence relationship, another characteristic feature of the development process. A phase can represent multiple activities, not all of which can necessarily be performed independently. The positive loop shown in Figure 4 models the increase in the number of tasks which will become available for initial completion as work within the phase is completed. For example in the construction of a ten story building the structural work on the upper floors is not available until the lower floors which support them are completed. The Internal Process Concurrence relationship answers the question "How much work can now be completed based upon how the work has progressed thus far?" We describe the specification and estimation of Internal Process Concurrence constraints below. The number of basework tasks available for initial completion can also be constrained by upstream phases. Testing, for example, cannot commence until a prototype is completed. We model these inter-phase constraints with External Process Concurrence relationship (described later).
The tasks available for initial completion (ICAvail) are those which can be completed less those for which initial completion has already been completed. Therefore the number of tasks available for initial completion (ICAvail) is the difference between the Total Tasks Available (TTA) and those tasks which are perceived to be initially completed satisfactorily (TPS) or are waiting for iteration (TtIter). Finding a large number of defects while the initial completion rate is low can reduce the fraction of tasks perceived to be satisfactory. This can in turn reduce the total tasks available to a level below the number of tasks perceived satisfactory or to be iterated, causing an infeasible negative number of tasks available for initial completion. The maximum function prevents this condition.
ICAvail = Max(O, TTA - (TPS + TtIter)) (12)
The Total Tasks Available is the product of the fraction available as defined by the constraint set by the Internal Process Concurrence relationship (%Avail Internal Concurr) and the number of tasks required to complete the phase (the phase scope, PS). Tasks perceived to be completed satisfactorily is the sum of the tasks Completed but not Checked (CnC), the Tasks Approved (TAppr) and the Tasks Released (TRel):
TTA = PS * %Avail Internal Concurr (13)
TPS = CnC + TAppr + TRel (14)
The Fraction of Tasks Available due to the Internal Process Concurrence constraint (%Avail Internal Concurr) is a function of the fraction of the phase scope which is perceived to have been completed satisfactorily, Fraction Perceived Satisfactory (FPS). The function is defined by the Internal Process Concurrence relationship (IPC). The Fraction of tasks Perceived Satisfactory is the ratio of the tasks perceived satisfactory thus far (TPS) and the phase scope (PS). The tasks to be iterated are not included because tasks known to be defective do not make additional work available:
%Avail Internal Concurr = fPC(FPS) (15)
FPS = TPS / PS (16)
The process structure for a single phase as described by the preceding sixteen equations is shown in Figure 5.
probability Discover Defect
Average Quality Assurance Duration AQAD
Quality Assurance Resource constraint
\ \ RCQA
Average Initial Completion Duration AICD
Internal Process Concurrence
Tasks to be Iterated
%Avail Internal Concurr (15)
Figure 5: The Development Process Structure for a Single Project Phase
Describing Internal Process Concurrence
A project phase's Internal Process Concurrence relationship describes the inter-dependency of
the tasks within the phase. In describing the construction of the structure for an office building the Internal Process Concurrence relationship could capture the physical constraint that lower floors must be completed sequentially one at a time from the ground up because lower floors support those above. These constraints can act as a bottleneck in the availability of work. Most previously published system dynamics models of projects have assumed that all uncompleted tasks are available for completion (e.g. Abdel-Hamid, 1984; Richardson and Pugh, 1981; Roberts, 1974). This assumption implies that all tasks are independent and could be performed in
parallel. Product development research (e.g. Rosenthal, 1992; Wheelwright and Clark, 1992; Clark and Fujimoto, 1991) and the example above show that processes frequently constrain the availability of work. Without the Internal Process Concurrence relationship the existing models would allow all tasks to be completed instantly if the work force were large enough.
Internal Process Concurrence relationships capture the degree of sequentiality or concurrence of the tasks aggregated together within a phase, including possible changes in the degree of concurrence as the work progresses. As shown in Figure 6, all Internal Process Concurrence relationships for feasible projects must lie strictly above the 450 line, otherwise work could not be completed until it was already completed. Within the feasible region a variety of functional forms are possible including nonlinear concurrence relationships. In general more concurrent processes are described by curves near the left axis of the Internal Process Concurrence graph and less concurrent processes are described by curves near the 450 line. Figure 6 shows the Internal Process Concurrence relationship for the construction of the structure for a ten story office building in which the floors are erected sequentially from the ground up. At the beginning of the project only the first floor (10%) is available to be completed. The completion of portions of the first floor make available portions of the second floor. When the first floor is finished 10% is completed and the second floor becomes available, making 20% completed or waiting to be completed. This linear progression continues until the completion of the ninth floor releases the final floor for completion (100% completed or waiting to be completed when the phase is 90% complete). I UVI Percent Completed or Available to Complete 0 100
Percent Completed and Released
In contrast with the office building example many such relationships are not linear. The Internal Process Concurrence relationship shown in Figure 7 is based upon the design of software code used to create the layout of a new computer chip and was derived from fieldwork with the design team (Ford 1995). The code to be produced is aggregated into several blocks. A few of these blocks of code must be designed and written before other blocks can be started. Therefore only these important blocks (estimated to be 20% of the code) can be worked on at the beginning of the design phase. More code does not become available until these blocks approach completion. The increased potential concurrence of subsequent code is reflected in the steep rise of the function between 20% and 30% Perceived Satisfactory. When most of the blocks of code have been written the work of integrating the blocks into a single operational program begins. Integration is fundamentally less parallel, producing the flat tail on the right side of the graphical function. Percent Complete or Availablb to Comple 0 100
Percent Completed and Released
Figure 7: A Nonlinear Internal Process Concurrence Relationship
Development Processes Among Multiple Project Phases
We capture the links among project phases in two ways: External Process Concurrence relationships and coordination. External Process Concurrence relationships are used to describe available work constraints between development phases in a manner analogous to the internal available-work constraints described by Internal Process Concurrence. An External Process Concurrence relationship describes the amount of work that can be done in a downstream phase based on the percent of work released by an upstream phase. For example the testing of a
prototype cannot begin until the prototype is built and the amount of detailed design work which can be completed is constrained by the amount of product definition work which has been released to the detailed design phase.
The purpose of External Process Concurrence relationships is similar to the purpose of the precedence relationships used in the Critical Path and PERT methods: to describe the dependencies of development phases on each other. However External Process Concurrence relationships as used here can describe these relationships in greater detail and richness than the precedence relations used in the Critical Path and PERT methods for several reasons:
* External Process Concurrence relationships describe the dependency between two phases along the entire duration of the phases instead of only at the start and finish of the phases as in the Critical Path and PERT methods.
* External Process Concurrence relationships can be nonlinear whereas precedence relationships used in the Critical Path and PERT methods cannot. That is, the External Process Concurrence relationship can represent changes in the degree of possible concurrence between two phases as work on the upstream phase progresses.
* External Process Concurrence relationships describe a dynamic relationship between development phases by allowing the output (Percent Tasks Available for Initial completion) to vary over the life of the project depending on the current conditions of the project. For example if design drawings are returned from construction (the
downstream phase) to design (the upstream phase) for iteration then the work available to construction is reduced, possibly requiring construction to cease until the drawings are iterated and re-released. In contrast the precedence relationships used in the Critical Path and PERT methods are static.
External Process Concurrence relationships can be applied from any upstream development phase on which a phase depends. In our multiple phase model the Total Tasks Available for Initial Completion (TTA) is based on the minimum (i.e. tightest) of the constraints set by the phase's Internal Process Concurrence relationship (%Avail Internal Concurr) and the External Process Concurrence relationships (%Avail External Concurr) which link the phase to upstream development phases. The revised equation for the total tasks available is:
TTA = PS * Min(%Avail Internal Concurr, %Avail External Concurr) (13a)
The Fraction of Tasks Available due to the External Process Concurrence relationship (%Avail External Concurr) is the minimum of the constraints between the phase and each upstream phase in the project network (%Avail External Concurri). The fraction available due to each constraint
is a function of the Fraction of tasks Released from the Upstream phase in the project network (FRelUpi). The function is defined by the External Process Concurrence relationship (EPCi,j) between the focal phase (denoted with subscript j where j E ({ 1,2...n}) and each upstream phase in the activity network (denoted with subscript i). The Fraction of tasks Released from the Upstream phase is the ratio of the number of tasks released by the upstream phase (TReli) to the scope of the upstream phase (PSi):
%Avail External Concurrj = Min(fEPCi,j (FRelUpi)) for i j FRelUp i = TRel i / PSi
(17) (18)
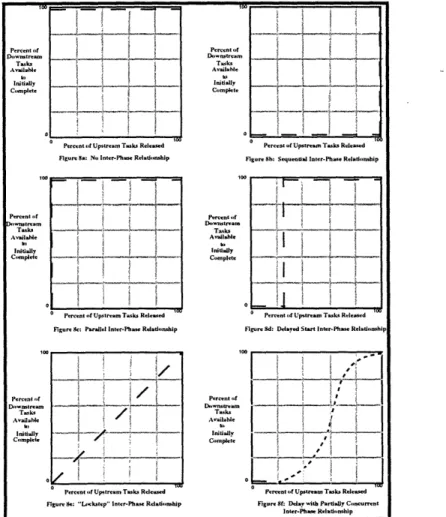
Note that the External Process Concurrence relationship fEPCi,j = 1 for upstream phases i which do not constrain downstream focal phases j as shown in Figure 8a. In general External Process Concurrence relationships describe more concurrent processes with curves near the upper and left axes of the External Process Concurrence graph and less concurrent processes with curves near the lower and right axes.
Pernt . of Up..ream Taks RrI{.d Figur.e 8: N. Inter-Phas Rd.tmd-ship
rm~~~~~~~~
uo 'm ... l~ .._ _ _ , _ r,,ul~_
t
, _ ._ ._~~
e _^ = _ .~~
O -__
Peem) ltea risRlr
Figure k: Pill Inttr-Pha- Rdtd-nhip
P.rat o Up-l..m Tk. Rd.-d F Pgur : ". a lkt p" Inl.-Phs Rdat.lr-,ip
Pecmnt ,f Dooartram Avilohle Initilly Colmprlte rgrc Oh ot upsIr-m P sks Rltiiseo Figure Sh: Squentii Inter-Phe Relid,.phip
Pemnt
% ;.kil'. _P. Initdly
Ctrmplete
-i-- fU~oo I~oo ok itooo
P1g erent ., Ulp tru Tl-Pk Rtelerd i i gure Bd: Ddayed St inr-Phise Rd-latinshi
P l -f rrn s *
Initiallv _
Glmpce t e
o
-Permnt tf Uptrm Taks Raed
Figur. $f: Deby 'it Prtil0y Cnurm nt Inr-Pb ReiatIdl hip
Figure 8: Examples of External Process Concurrence
Percent of AniloMh Initially Cmpete P" p.. of Pent .! DovsntrrTook. Initilly C.rnpe.. Avoilokle 1t} =- m lo II II - - -IIIIXIX XIXII Illp · llln LIllllll 4111 __ aXII 111* ·rllllXI II IX IIC XII llL1l* i^ X I I I IIIIII m o _ ,.. _ . K . .~( 10 o
!
OFigure 8 illustrates several possible External Process Concurrence relationships. Four of the examples (8a, 8b, 8c and 8d) demonstrate how External Process Concurrence relationships can be used to describe inter-phase relationships commonly used by the Critical Path Method and PERT. For example infinite order delays between phases based on development progress can be described by shifting the point along the abscissa at which the first downstream tasks become available (Figure 8d). Two of the examples (Figures 8e and 8f) show inter-phase relationships which can be described with External Process Concurrence but cannot be described with the Critical Path method or PERT. Different levels of concurrence among phases can be described with External Process Concurrence relationships by altering the shape of the curve in the graphical function. For example Figure 8e describes an inter-phase relationship in which the downstream phase can proceed at the same rate as the upstream phase. The development process allows them to proceed in "lockstep". Figure 8f describes an inter-phase relationship in which the downstream phase must wait until the upstream phase has released 20% of its tasks and then can proceed at varying degrees of potential concurrence.
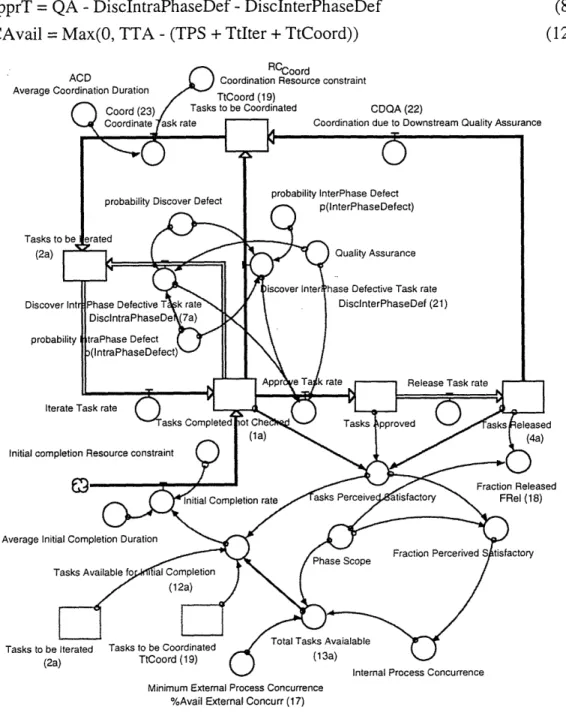
Coordination
The second development process which directly links project phases is coordination. Coordination describes the inter-phase effects of releasing and inheriting defects. For example, detailed designers may need to meet with product architects to explain why certain product specifications cannot be met within the time and budget available, and then revise the specifications. Our explicit modeling of coordination allows us to distinguish between two important types of defects encountered in product development, defects caused by factors internal to a development phase and defects caused by using defective work from upstream phases as the basis for development work.
Tasks requiring inter-phase coordination such as meetings to explain or resolve problems accumulate in a stock of Tasks to be Coordinated before they are coordinated and moved to the Tasks to be Iterated stock (Figure 9). Two flows fill the Tasks to be Coordinated stock. First, tasks which are discovered to be defective due to the inheritance of defects from upstream phases flow from the Completed not Checked stock into the stock of Tasks to be Coordinated. We call this flow Discover Inter-Phase Defective Tasks (DisclnterPhaseDef). Second, the defective tasks which have been released, discovered by a downstream phase and returned for coordination and iteration are removed from the upstream phase's stock of Tasks Released and enter the stock of Tasks to be Coordinated (TtCoord) through the flow of Coordination due to Downstream Quality Assurance (CDQA). Tasks leave the Tasks to be Coordinated stock and enter the Tasks to be Iterated stock through the coordination activity (Coord). Therefore the equation for the stock of
Tasks to be Coordinated (TtCoord) and revised equations for the Tasks Completed but not Checked, Tasks to be Iterated, Tasks Released stocks, the Approve Tasks flow (ApprT) and the Tasks Available for Initial Completion and which reflect coordination are:
(d/dt)(TtCoord) = DiscInterPhaseDef + CDQA - Coord
(d/dt)(CnC) = IC + IterT - DisclntraPhaseDef - DiscInterPhaseDef - ApprT (d/dt)(Ttlter) = DiscIntraPhaseDef + Coord - IterT
(d/dt)(TRel) = RelT - CDQA
ApprT = QA - DiscIntraPhaseDef - DiscInterPhaseDef ICAvail = Max(O, TTA - (TPS + TtIter + TtCoord))
(19) (la) (2a) (4a) (8a) (12a) CDQA (22)
Coordination due to Downstream Quality Assurance
Tasks to be Iterated Tasks to be Coordinated (2a) TtCoord (19)
Minimum External Process Concurrence %Avail External Concurr (17)
Modeling the discovery of defects caused by inheriting defective tasks from upstream phases (DiscInterPhaseDef) requires that we distinguish between flows of tasks with internally and externally (upstream) generated defects. This is because the flow of tasks with internal defects, which we call Discover IntraPhase Defective Tasks (DiscIntraPhaseDef), goes directly from the Completed not Checked stock to the Tasks to be Iterated stock but the flow of tasks with defects due to inherited defects (DiscInterPhaseDef) flows from the Completed not Checked stock to the Coordination stock before going to the Tasks to be Iterated stock. We model internal defects with a coflow structure with a structure similar to the development tasks structure as described above. We model defects due to inheriting upstream defects with a second coflow which is also based on the development tasks structure. The equations for both coflow structures and their basis in the development tasks structure are shown in the appendix.
An assumption is required to allocate the tasks defective due to both internal and external defects to the flow of Discover Defective Tasks or Discover InterPhase Defective Tasks. We assume that developers will correct defects generated within their own phase before bringing those tasks to coordination so as to avoid revealing to colleagues that they have made errors (a behavior observed in our field studies). Therefore the overlapping discoveries can reasonably be assumed to go directly to the Tasks to be Iterated stock. Other assumptions are easily accommodated. Based on this reasoning and the densities of the two kinds of defects in the stock of tasks Completed but not Checked we redefine the flows of defective tasks from the Completed not Checked stock as:
DiscIntraPhaseDef = QA * p(DiscDefTask) * p(IntraPhaseDefect) (7a) DisclnterPhaseDef = QA * (p(InterPhaseDefect)
-(p(InterPhaseDefect) * p(IntraPhaseDefect))) (21) where the Intra-Phase and Inter-Phase defects are calculated by the defect coflow
structure (see appendix for equations).
The flow of Coordination due to Downstream Quality Assurance (CDQA) is based on the reality that not all defects are caught by quality assurance within a phase. Often defects are released and subsequently discovered by downstream phases. This flow is the sum of the IntraPhase Defects and InterPhase defects released by the phase and discovered by all its downstream phases. These flows are modeled in the defect coflow structure based on the probability of the focal phase (denoted j) releasing a defect to a downstream phase (denoted i e { 1,2...n}), the probability of the receiving phase discovering the inherited defect (p(DiscDefi)) and the rate at which the receiving phase is checking tasks for defects through quality assurance (QAi). The probability of the focal
phase releasing a defect is the ratio of the number of defects released (IntraPhaseDefRelj or InterPhaseDefRelj) to the number of tasks released (TRelj). Simultaneous discovery of the same inherited defect by multiple downstream phases is assumed insignificant. This assumption is valid for relatively small released defect densities and a sufficiently short time step in the simulations:
CDQA = ( [((IntraDefRelj / TRj) * p(DiscDefi) * QAi) +
((InterDefRelj / TRj) * p(DiscDefi) * QAi)] for i X j (22)
Note that p(DiscDefi) • 0 only for phases which utilize the output of the focal phase. The Tasks to be Coordinated stock is drained through the coordination of tasks. The Coordination Rate (Coord) is based on the resource constraint for coordination (RCCoord) and the rate each development process allows tasks to be coordinated. Using a formulation similar to that used for initial completion, quality assurance and iteration this process rate is the work requiring coordination (the Tasks to be Coordinated, TtCoord) divided by the Average Coordination Duration (ACD):
Coord = Min(RCCoord TtCoord / ACD) (23)
For simplicity we have assumed coordination across phases can be accomplished asynchronously with tools such as memoranda, sharing of CAD/CAM files or electronic mail. An extension to the model would explicitly require various degrees of simultaneity in the resolution of inter-phase coordination. In the extreme case where all coordination requires full simultaneous participation of employees from all affected phases the coordination rate would be constrained by the minimum of resources devoted to coordination supplied by the involved phases.
Coordination has effects on development projects beyond the resolution of inherited errors described above. A beneficial side effect of coordination is learning about developments in dependent phases by developers. Improved understanding decreases the generation of errors and increases the likelihood of developers finding their own and inherited errors and thereby increased their productivity. Since these effects influence underlying rates of defect generation, defect discovery and productivity we model them with nonlinear graph functions. A still more detailed model of coordination would model proactive coordination as well as the reactive function described above.
Model Testing
The full model includes structures describing resources (labor), targets such as overall and phase-specific deadlines, and scope as well as the process structure described above. These structures have been generally based upon previously developed system dynamics models (Fiddaman et al., 1993; Homer, 1985; Abdel-Hamid, 1984; Richardson and Pugh, 1981; Roberts, 1974). Resources are allocated to initial completion, quality assurance, iteration and coordination based upon the relative pressures for each activity as perceived by developers. Pressures for resources are driven by the demand for each activity as modeled by the process structures above and are influenced by delays in perception and cognitive processes along with schedule, quality, and cost targets. Complete model equations and documentation are available from the authors. A somewhat simpler version is fully documented in Ford (1995).
Validation of the process portion of the model structure was considered particularly important since these structures are absent in the system dynamics and project management literature. Direct structure tests (Barlas, 1989; Forrester and Senge, 1980) included discussions with developers and managers in the product development organization at a multinational semiconductor firm to confirm that our model structure closely reflected their process. These tests and interview data support the previously discussed inadequacy of development project mental models and helped validate our model structure. Of particular significance here is that several of the negative loops systematically missed by the managers and developers are described by our model's process structure and are not related to resources, targets or scope. These loops include the constraint on available work imposed at the beginning of a phase by its Internal Process Concurrence relationship and the negative loop in which completing work reduces the amount of work available to be done. Extreme conditions tests helped validate the integration of process, resource, target and scope structures.
Behavior-reproduction tests (Forrester and Senge, 1980) were also used to validate the model by comparing simulations to field data for a mid-size chip development program, which we call the Python project. Historical data and reference modes were developed from records of the Python project. Specification items were selected as the basis for development tasks in the Product Definition phase. Numbers of specification items and changes to those items in sequential versions of the product specifications were counted to generate time series data of the progression of the Product Definition phase. The Design phase consisted primarily of writing the
computer code used to lay out physical chip components in the available space. The firm graciously provided the full source code to us for model calibration. The number of lines of code is considered by the company to be sensitive information. However inspection of the code
-revealed a uniform code density so we used vertical inches of code on a printout page as the basis for Design tasks. The code was written in several blocks. Each block included a record of the original completion date and notes describing subsequent revisions. These dates and notes were used to generate time series data for the initial completion and iteration performed on each block of code. These were then aggregated to generate time series for the Design phase. Similar approaches were used for the other development phases.
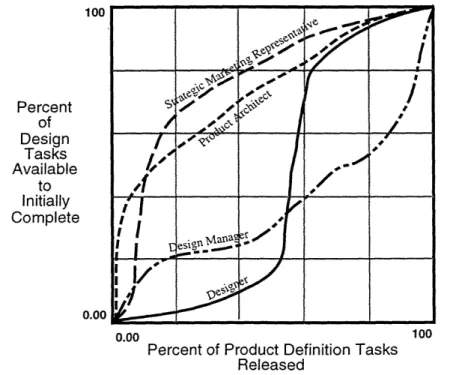
Workshops were conducted with developers and managers on the Python project to estimate the relevant Internal and External Process Concurrence relationships. The protocol for the elicitation of the concurrence relationships is described in Ford (1995). These workshops proved to be useful not only for eliciting the data needed to calibrate the model but also helped the members of different development groups understand each other's mental models better. As an example Figure 10 shows expert estimates of the External Process Concurrence relationship between the product definition and design phases of the Python project. The product definition phase develops product specifications describing the Python chip's market, target performance and architecture. The designers use these specifications as the basis for writing the software code used to lay out the chip's individual components. Each estimate in Figure 10 describes the mental model of a participant in the product definition or design phase concerning the question "How much-design work can be completed based on how much product definition work has been completed and released?"
100 Percent of Design Tasks Available to Initially Complete 0.00 0.00 100
Percent of Product Definition Tasks Released
Figure 10: Four Estimates of External Process Concurrence Relationship between the Product Definition and Design Phases
It is interesting to note that the two "upstream" people (the marketing representative and the product architect) believe the "downstream" people (the design manager and designer) can and presumably should begin their work quite early, when few product specifications have been released, while those downstream believe their work can only progress when a majority of the specifications have been released. This difference in mental models led to conflict in prior development projects. Different process concurrence relationship estimates were used as the basis for sensitivity testing of the model. Basing sensitivity tests on actual expert estimates can increase confidence in the sensitivity tests over tests based solely on modeler estimates of those relationships.
Data and model simulations for the four phases shown Figures 11 through 14. 1 00- 90- 8070 -60 - 50-W 40 30 a. 30 -20 10
in the network in Figure 2 are shown in
L
0 10 20 30 40 50 60 70
Time (weeks)
80 90 100 1 10 120
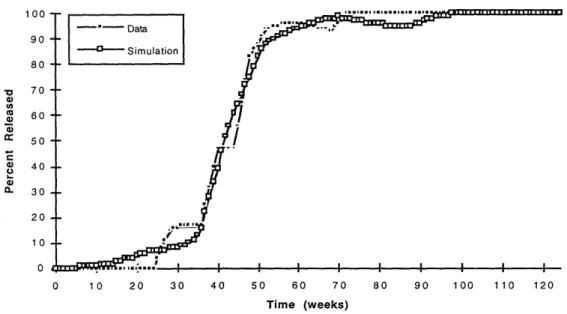
Figure 11: Reference Mode and Simulation of Product Definition Phase Error Statistics
R2 = 99% Root Mean Squared Error (RMSE) = 0.42% MAE as percent of mean = 6%, n = 92
Theil Inequality Statistics: Bias = 7% Variation = 8% Covariance = 85%
r
~ --.~--- |/I |l i l I l · i ii I I J
. · · · . . . ·
0. C co a) 0 C.a) c 0 CL 0 10 20 30 40 50 60 70 80 90 100 110 120 Time (weeks)
Figure 12: Reference Mode and Simulation of Design Phase Error Statistics
R2= 98% RMSE = 0.57% MAE as percent of mean = 13% n = 117 Theil Inequality Statistics: Bias = 10% Variation = 6% Covariance = 84%
-'- Data - Simulation 0 10 20 30 40 50 60 70 80 90 100 110 120 Time (weeks) Figure 13: Error Statistics
Reference Mode and Simulation of Test Prototypes Phase
R = 99% RMSE = 0.55% MAE as percent of mean = 12%
Theil Inequality Statistics: Bias = 31% Variation = 40% Cc
n =43 )variance = 29% 9 I 90 80 70 60 50 40 30 20 10 0 100 80 70 60 50 40 -30 0 (Du a) 0. 20 10 0 I - - - - -···~~~~~~~~~~~~~~~~~~~~~~~~~~~~~~~~~~~··l~~~~~~~~~n~~~~u .... i i i t I~~~~~~~~~~~~~~~~~~~~~ n n I L
Iuu 90 - 80-o 70-aD at 60 -a) 50-C ax 4 0-a) 0. 30. 20-10 -04 ....- Data .-.n Simulation I... .' .. 1... ... I I 0 10 20 30 40 50 60 70 80 90 100 110 120 Time (weeks)
Figure 14: Reference Mode and Simulation of Reliability/Quality Control Phase Error Statistics
R2= 100% RMSE= 1.75% MAE as percent of mean = 21% n =6 Theil Inequality Statistics: Bias = 54% Variation = 46% Covariance = 0%
The behavior patterns of our four project phase simulations closely replicate the patterns of the reference modes. Error statistics were calculated for reference mode and simulated behavior patterns only over times when phases were active. This prevented including data in error
statistics which matched exactly due to inactivity and would inappropriately reduce calculated error measures. Errors for the four phases are reasonable (average R2 = 99% and average MAE as percent of mean = 13%). Partitioning the mean squared error (MSE) using the Theil inequality statistics (Sterman, 1984) reveal low MSE (average MSE = 0.98%) dominated by unequal covariance in the phases with the largest errors. This indicates closeness in the means of actual and simulated values and similar dominant trends with error caused primarily by a fairly constant temporal shift between the simulated and actual values, such as the difference in the timing of the drop in the design phase near week 70, or significant noise. The fit between simulated and actual data could be improved beyond that shown by specifying process concurrence relationships with higher resolution. However this would require specification beyond the data resolution justified by the knowledge elicitation process and would result in calibrating the model to process and measurement noise. Process noise can be caused by the natural variations in work effort and productivity around the averages represented in the model. Measurement
noise can be caused by the way the original data was coded (e.g. errors in dates of completion of design code) or data reduction errors.
Impacts of Development Process Dynamics on Projects
We use our model to demonstrate that in systems with high iteration, such as product development, modeling process concurrence relationships endogenously and separately from other processes is critical to understanding the dynamics of projects. To illustrate differences in the influence of development activities on performance we simulated project durations with Average Process Activity Durations for a single development activity in all project phases at levels of 25, 50, 100, 200, 400, and 800 percent of the base value used in the model tests described above. These durations can represent process differences across industries or firms or differences within a firm due to varying levels of process complexity and through variation in the use of process improvement tools such as information technology. The resulting project schedule performance for each of the four development activities is shown in Figure 15.
,. C 0 o cO m 0 o o J C o 0 a-3.25 2.75 2.25 1.75 1.25 0.75 0.25 0.5 1 2 4
Activity Duration / Base Activity Duration
8
Figure 15: Impacts of Average Process Activity Durations on Project Duration
Project durations change significantly more in response to changes in the initial completion duration than in response to changes in the other development activities, as indicated by the steeper slope of the line representing different initial completion durations. In the case of long durations the difference exceeds 50%. Different performance measures may be more or less
' Initial Completion
- Quality Assurance
_. Iteration
sensitive to specific development activities depending on process descriptions. However the high sensitivity of project duration to the initial completion duration relative to the other development activities in this example demonstrates the need for modeling development activities separately.
To illustrate the importance of modeling process concurrence relationships explicitly and dynamically we simulated a project three times using a different external process concurrence relationship between the Product Definition and Design phases in each simulation. The three relationships are: 1) the dynamic relationship described by the designer (Figure 10), 2) the dynamic relationship described by the strategic manager (Figure 10) and 3) a purely parallel and static relationship such as would be modeled with the Critical Path Method (Figure 8c). Figure 16 shows the number of design tasks to be coordinated using each of the three descriptions. Both dynamic external process concurrence relationships capture the significant coordination impact of concurrence but the traditional concurrence description recognizes very little coordination. This demonstrates the importance of modeling development concurrence relationships explicitly and endogenously to capture the dynamics of projects.
. 60 u o5 0 ) 50 Ia) o 40 a, 30 I-I, 20 0 C 1 0 0 i ', I 't
I
Ix\
I
0 10 20 30 40 50 60 70 Time (weeks) 80 90 100 110 120Figure 16: Design Tasks Requiring Coordination under three External Process Concurrence Relationships
-.--- Design Tasks to be Coord
-Traditional Concurrence Description
---- Design Tasks to be Coord -Dynamic Concurrence Description (strategic manager)
- - Design Tasks to be Coord -Dynamic Concurrence
Conclusions
We have described a dynamic structure for modeling development processes separately from project resources, scope, and targets and have demonstrated the importance of distinguishing process dynamics from other project dynamics for understanding projects. We suspect that previous dynamic project models which reflect actual behavior have incorporated some of the development processes which we have made explicit into resource structures and parameter estimates. However capturing how development processes affect project performance by explicitly modeling those processes provides significantly improved descriptions of development team mental models, project constraints and the drivers of project performance. The significant effects which these process structures have on performance demonstrate the need for integrated project models which include processes, resources, scope and targets.
Our work contributes to the modeling of project management by adding development processes to the three domains identified by Rodrigues and Bowers (1996) as currently being addressed with system dynamics (monitoring and control, rework and human resources). We have improved the modeling of development projects by explicitly describing and testing structures for process concurrence, four distinct development activities, two types of defects, bi-directional flows of defects between phases, and defect coflow structures in a generic project model. The model can be used to further investigate the impacts of process, resources, scope and targets on project performance. We have also identified process concurrence relationships as an important
aspect of practitioner mental models as a topic for future work.
Project performance problems can be expected to increase as competitive forces and new development paradigms increase project complexity. Our work points to an important gap between the primary methods currently used to describe, model, communicate and manage projects in practice and the complexity of the structures which actually drive the behavior of
those projects. Current project management literature directed toward practitioners is based on open-loop, single-link linear relationships which are often reduced to lists of rules-of-thumb (e.g. Thomsett, 1990). Field data collected during our research indicates that development practice also suffers from these limitations (Ford, 1995). Current project modeling tools are incapable of capturing the dynamics produced by the development processes described here. Barring reduced project complexity performance cannot significantly improve without the development of tools for the description, modeling, and management of dynamic development processes. Our model helps fill this gap by providing a framework for designing and testing development process structures and management policies. By explicitly modeling development processes and relating process, resources, scope, and target features to performance our model plays a similar role for