HAL Id: insu-01293245
https://hal-insu.archives-ouvertes.fr/insu-01293245
Submitted on 24 Mar 2016HAL is a multi-disciplinary open access archive for the deposit and dissemination of sci-entific research documents, whether they are pub-lished or not. The documents may come from teaching and research institutions in France or abroad, or from public or private research centers.
L’archive ouverte pluridisciplinaire HAL, est destinée au dépôt et à la diffusion de documents scientifiques de niveau recherche, publiés ou non, émanant des établissements d’enseignement et de recherche français ou étrangers, des laboratoires publics ou privés.
Lionel Mercury, Kirill Shmulovich, Isabelle Bergonzi, Jean-Michel Matray
To cite this version:
Lionel Mercury, Kirill Shmulovich, Isabelle Bergonzi, Jean-Michel Matray. Water-solid interactions at the pore scale. TRePro III – Workshop on Modelling of Coupled Transport Reaction Processes, Mar 2014, Karlsruhe, Germany. �insu-01293245�
WATER-SOLID INTERACTIONS AT THE PORE SCALE
Lionel Mercury1*, Kirill Shmulovich2, Isabelle Bergonzi1, Jean-Michel Matray31 Institut des sciences de la Terre d’Orléans, UMR 7327 Université d’Orléans/ CNRS/ BRGM, 1A rue de la Férollerie, 45071 Orléans, France
2 Institute of Experimental Mineralogy, Russian Academy of Science. 142432 Chernogolovka, Russia.3
3. IRSN, DEI/SARG/LETS, BP 17, 92262 Fontenay-aux-Roses cedex, France.
* Corresponding author: lionel.mercury@univ-orleans.fr
Introduction
Water and aqueous solution confined in restricted volumes (pore, channels, intra-solid cavities, etc) are largely encountered everywhere in nature, and their thermochemical properties define the possible driving forces of their interactions with any phase(s) of interest locally present. At given (T,Ptotal) pairs, liquids are considered to be bulk materials, except
when the confinement reaches the nanometric scale. Despite this very usual choice, a growing number of evidences points to the existence of an intermediate-sized domain (1 µm - 50 nm) in which the interaction behaviors seems to change, most probably due to thermodynamic driving forces. This contribution reports on dedicated recent experiments, the measurements of which can be interpreted assuming modified reactive properties in the system.
Capillarity
Capillary water arises in the porous networks that are not saturated and displays liquid-air interface concave toward liquid-air. Practically speaking, it can be encountered in soils (featuring most of the immobile water) and trees (sap ascent), in aquifers depleted of their original fluids, in CO2 storage reservoirs, in the aerated zone around tunnels, etc. The thermodynamic
properties of liquid can be easily corrected through a V.dP term, since capillary water is characterized by a decreasing internal pressure, and many theoretical predictions can be done accordingly (e.g. Mercury and Tardy, 2001; Mercury et al., 2003). The pore size domain of influence of such effect, as predicted by Laplace law, is around 8-10 nm, that restricts its applicability in natural settings to the lowest existing pores, those of clayey materials for instance. However, we performed a series of experiment which shows that the capillary effects may act at a larger scale (Bouzid et al., 2011a and b).
Precipitation in capillary solution
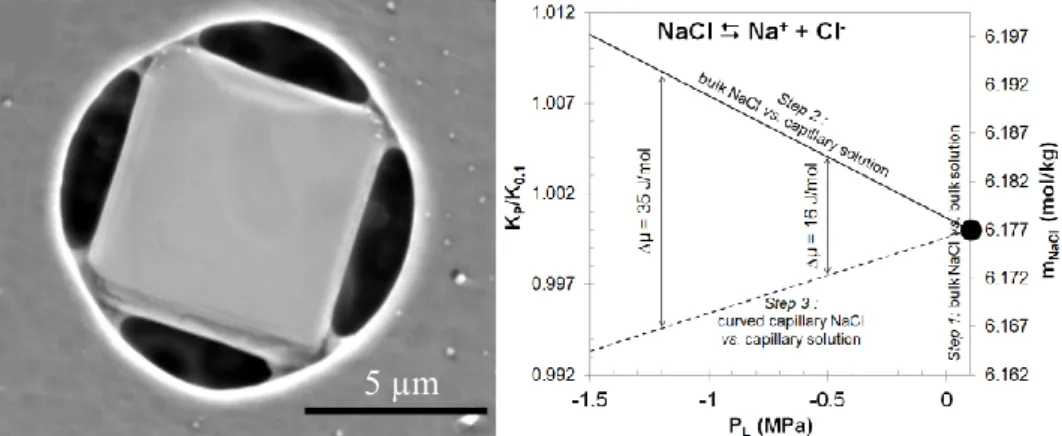
The first experiment (Bouzid et al., 2011a) was done by drying a filtration membrane, after its imbibition by a quasi-saturated NaCl solution. After sufficient evaporation, first we observed precipitation of a quite perfect cubic halite, completely filling the round pore (Fig. 1). Later on, while evaporation promoted capillary water contacting the cubic halite, we observed the precipitation of a secondary curved halite. Our thermodynamic interpretation (phase diagram, Fig. 1b), is that the capillary liquid properties modifies the equilibrium constant and then
induces a driving force toward the precipitation of a curved “capillary” solid, because at pressure equilibrium (“isobaric” sketch) with capillary liquid. It means that we were able to promote capillary precipitation, and the “concave” curvature of this secondary halite supports this proposition.
Figure 1: Left, normal and capillary halite precipitated in a pore initially saturated with aqueous
solution and submitted to a drying sequence. Right, corresponding phase diagram showing the change in the equilibrium constant of the reaction in anisobaric (normal solid + capillary liquid) and isobaric (capillary liquid and capillary solid) situations.
It is interesting to outline the dimensions of the original pore ( 10 µm) and the size of the capillary bridges (600-800 nm). Indeed, it indicates that the mechanism, though capillary, does not require to be nanoscopic to become significant. Whenever a drying system has got corners, wedges, etc, to locate capillary water, the precipitation of solids with new shape appears possible.
Another point of interest, though more or less outside the geochemical approach here developed, is the geomechanical consequence of such precipitate on the container itself (here a polycarbonate polymer). It deforms according to the capillary traction exerted at the vertices of the cubic halite where the capillary bridges (initially liquid, then solid) take place. Due to the precipitation of the capillary solid, the stress fossilizes.
Dissolution in capillary solution
The second experiment (Bouzid et al., 2011b) was carried out in a capillary tube, initially filled with a NaCl quasi-saturated brine. The first event was a precipitation of massive halite at the liquid-air interface, isolating a liquid column in-between from outside (and so called “NaCl cork”) (Fig. 2 left).
Figure 2: Left, capillary tube ( = 80 µm) filled with NaCl brine and closed by two NaCl massive
precipitates, with (upper, t0) and without (lower, t0 + 56 days) in-between dendritic solid. Right, decreasing size of the massive solids, showing the dissolution effect with time.
Initially, this liquid column was assumed to be bulk liquid at equilibrium with the NaCl corks. But, with time, we observed a continuous decreasing size of the corks, firstly rapid, then more progressive (Fig. 2 right), highlighting that the solid was initially under-saturated with respect to halite. Additionally, after three months, occluded liquid cavitated demonstrating that it was not a bulk liquid but a superheated one, most probably due to the persistence of a capillary liquid ring all around the corks (see discussion in Bouzid et al., 2011b). Using previous phase diagram (Fig. 1 right), and remembering that a capillary and a superheated liquids have exactly the same properties, the interpretation is straightforward: dissolution is driven by the increasing solubility of bulk halite in superheated/capillary liquid due to an increasing equilibrium constant of this anisobaric system And that change is achieved in a 80 µm wide channel.
Solid curvature
Pore networks can be developed by solid grains stacking, each individual grain having its own shape and size. As a consequence, a pore is a cavity whose solid walls have a certain curvature at the pore scale. We built an experiment to measure the solubility of such solid as a function of its curvature (Mercury et al., submitted), owing to a pressure membrane extractor enabling to sequentially extract solutions from thinner and thinner pores. Measurements were performed with a silica paste whose pore network was first imaged by cryo-SEM (Fig. 3 left). The solid matrix was concavely curved toward the pore-filling solution, and the measured silica content was decreasing with the decreasing pore size (Fig. 3 right). Thermodynamic calculations based on the same isobaric-anisobaric concepts fitted satisfactorily the results (Fig. 3 right).
Figure 3: Silica paste pore network (left) in which (right) silica concentration (normalized to the
initial concentration, symbols) is measured as a function of the extraction pressure, here converted into the corresponding pores sizes, and thermodynamic recalculation (lines).
In the present discussion, an interesting point is the 150 nm (1/R 6 µm-1) diameter of the pores wherein the pore-size-controlled effect becomes visible. Despite small, such pores are outside the nanoscopic world, and so the pore-size-dependent solubility may have a real impact in natural settings.
-0.20 -0.18 -0.16 -0.14 -0.12 -0.10 -0.08 -0.06 -0.04 -0.02 0.00 0 20 40 60 80 log(S iO 2 )/SiO 2 )° 1/Rpore(µm-1) solid-water= 320 mJ/m² solid-water= 500 mJ/m² solid-water= 390 mJ/m²
Interfacial water
The water-rock interactions take place at the very contact between the two phases, and again, it is usually assumed that the interfacial domain is a matter of molecular layers, in the 1-5 nm range. Obviously, there are numerous reasons, both theoretical and experiment, to restrict the interfaces to such limited distance. Yet, we performed recently an infra-red experiment which opens some questions about this consensus. Micro-IR maps using synchrotron radiation source (at Soleil synchrotron, SMIS beamline) were performed on water occluded in a quartz fragment (fluid inclusion, Fig. 4) (Bergonzi et al., 2013).
Figure 4: Two IR maps (right) of the sampled inclusion (left). The colour relates to the absorbance
scale, taken (middle) at the main peak of the OH-stretching band: 3400 cm-1, featuring the bulk liquid (e.g. Maréchal, 2007), and (right) at the dangling-OH band: 3680 cm-1, characteristic of hydrophobic interfaces (e.g. Miranda and Shen, 1999).
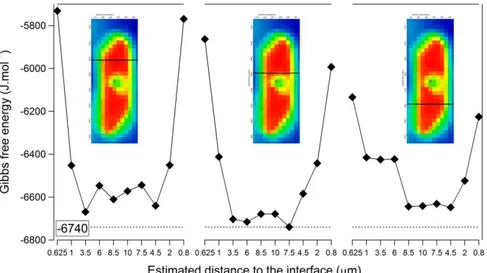
Measuring the dangling OH band is usual at the 1-5 nm scale with adapted IR spectroscopy. Here above, classic IR micro-spectroscopy captured this band, this time at the 0.5 µm (at least) scale. To illustrate the consequence of such findings, we converted the IR bands into thermodynamic values (Fig. 5), using a partition function recently developed (Bergonzi et al., submitted). Interfacial water appears to be 1 kJ/mol less reactive than the bulk, over a thickness (at least 500 nm) that makes this shift highly relevant for water-solid interactions.
Figure 5: Gibbs free energy as a function of the location in the map. The dotted line displays the bulk
Conclusions
Physico-chemical measurements on geological-type samples tend to indicate that liquid and solids at the pore scale may behave in different ways than expected from bulk behaviors. The lengths characteristic of such (mesoscopic ?) behaviors are (at least) in the 30-500 nm range, and then cannot be linked to nanoscopic driving forces. We propose that geochemical transformations are sensitive (in relevant conditions) to geometrical confinement at a much higher scale than usually assumed. As a consequence, the reactive term of water-rock interactions in (not so) thin pores, channels, or cavities, probably requires to be re-examined considering this proposition.
Acknowledgements
.This work has received financial support from the French Agency for Research (Agence Nationale de la Recherche), grant CONGE-BLAN10-61001, and from Region centre, grant 201100070577 SIRE. It also benefited from the beamtime allocation n°20130094 from SOLEIL synchrotron. The support of labex Voltaire, grant ANR-10-LABX-100-01 is also acknowledged.
References
Bergonzi, I., Mercury L., and Jamme, F., 2013. Thermodynamic properties of interfacial water from its infrared signature. Proc. of the “16th Int. Conference on the Properties
of Water and Steam”, 1-5 Septembre 2013, Londres (UK), 000-000.
Bouzid, M., Mercury, L., Lassin A., Matray, J.-M., and Azaroual, M., 2011a. In-pore tensile stress by drying-induced capillary bridges inside porous materials. J. Colloid Interf. Sci., 355: 498-506.
Bouzid, M., Mercury, L., Lassin, A., et Matray, J.-M., 2011b. Salt precipitation and trapped liquid cavitation in micrometric capillary tubes. J. Colloid Interf. Sci., 360: 768-776. Maréchal, Y., 2007. The hydrogen bond and the water molecule, Elsevier, 332 p.
Dorsey, N.E., 1968. Properties of ordinary water-substance, in all its phases: water-vapor, water and all the ices. American Chemical Society Monograph Series. New York; Hafner, 673 p.
Mercury, L., and Tardy, Y., 2001. Negative pressure of stretched liquid water. Geochim.Cosmochim. Acta, 65: 3391-3408.
Mercury, L., Azaroual, M., Zeyen, H., and Tardy, Y., 2003. Thermodynamic properties of solutions in metastable systems under negative or positive pressures. Geochim. Cosmochim. Acta, 67: 1769–1785.
Mercury, L., Bouzid, M., Matray, J.-M., Défarge, C., submitted. Pore-size-controlled solubility in aquifers: role of the curvature of the host pores. Earth Planet. Sci. Lett. Miranda, P.B., and Shen, Y.R., 1999. Liquid interfaces: a Study by Sum-Frequency