HAL Id: hal-00317893
https://hal.archives-ouvertes.fr/hal-00317893
Submitted on 14 Oct 2005
HAL is a multi-disciplinary open access
archive for the deposit and dissemination of
sci-entific research documents, whether they are
pub-lished or not. The documents may come from
teaching and research institutions in France or
abroad, or from public or private research centers.
L’archive ouverte pluridisciplinaire HAL, est
destinée au dépôt et à la diffusion de documents
scientifiques de niveau recherche, publiés ou non,
émanant des établissements d’enseignement et de
recherche français ou étrangers, des laboratoires
publics ou privés.
geosynchronous orbit
B. Lavraud, M. H. Denton, M. F. Thomsen, J. E. Borovsky, R. H. W. Friedel
To cite this version:
B. Lavraud, M. H. Denton, M. F. Thomsen, J. E. Borovsky, R. H. W. Friedel. Superposed epoch
analysis of dense plasma access to geosynchronous orbit. Annales Geophysicae, European Geosciences
Union, 2005, 23 (7), pp.2519-2529. �hal-00317893�
SRef-ID: 1432-0576/ag/2005-23-2519 © European Geosciences Union 2005
Annales
Geophysicae
Superposed epoch analysis of dense plasma access to
geosynchronous orbit
B. Lavraud, M. H. Denton, M. F. Thomsen, J. E. Borovsky, and R. H. W. Friedel
Space Science and Applications, Los Alamos National Laboratory, P.O. Box 1663, MS D466, Los Alamos, 87545 New Mexico, USA
Received: 11 March 2005 – Revised: 29 June 2005 – Accepted: 22 July 2005 – Published: 14 October 2005
Abstract. We report on the occurrence of dense plasma
ac-cess to geosynchronous orbit. We performed a superposed epoch analysis of 1464 events of dense (>2 cm−3at onset) plasma observed by the MPA instruments on board the Los Alamos satellites, for the period 1990–2002. The results al-low us to study the temporal evolution of various plasma pa-rameters as a function of local time. We show that dense plasma access to geosynchronous orbit mostly occurs near local midnight. This dense plasma population is shown to be freshly injected from the mid-tail region, colder than the typical plasma sheet and composed of a relatively small O+ component. This population is thus probably the result of a cold, dense plasma sheet (CDPS) injection from the mid-tail region. Cold and dense ion populations are also observed on the dawnside of geosynchronous orbit at a similar epoch time. However, we demonstrate that this latter population is not the result of the dawnward transport of the population detected near midnight. The properties of this ion popula-tion may arise from the contribupopula-tion of both ionospheric up-flows and precipitating plasma sheet material. The correla-tion of an enhanced Kpindex with the arrival of the CDPS at
geosynchronous orbit shows that the inward transport of this population is allowed by an enhanced magnetospheric con-vection. Surprisingly, this dense plasma does not, in general, lead to a stronger Dst (ring current strength) within the 12 h
following the CDPS injection. It is noted, however, that the superposed Kpindex returns to relatively low values soon
af-ter the arrival of the CDPS. This may suggest that the dense plasma is, given the average of the 1464 events of this study, only transiting through geosynchronous orbit without access-ing the inner regions and, therefore, does not contribute to the ring current.
Keywords. Magnetospheric physics (Plasma convection;
Plasma sheet) – Space plasma physics (Transport processes)
1 Introduction
The recurrent presence of unusually cold and dense plasma in the plasma sheet has been revealed by a number of studies
Correspondence to: B. Lavraud
(e.g. Lennartsson and Shelley, 1986; Terasawa et al., 1997; Fujimoto et al., 1998; Phan et al., 2000). Because of its com-position, it has been attributed a solar wind origin (Lennarts-son, 1992). The formation of this cold, dense plasma sheet (CDPS) is strongly dependent on the interplanetary magnetic field (IMF) direction. It is usually observed after long periods of northward IMF (Terasawa et al., 1997). Two main scenar-ios have been proposed to account for its formation: (1) solar wind plasma transport via the Kelvin-Helmholtz instability at the flank magnetopause (e.g. Terasawa et al., 1997; Fujimoto et al., 1998; Hasegawa et al., 2004) and (2) solar wind “di-rect” capture on newly-closed field lines at the dayside mag-netopause, by a double tailward-of-the-cusp (high-latitude) reconnection of magnetosheath field lines, and subsequent convection down-tail (e.g. Song and Russell, 1992; Raeder et al., 1997; Øieroset et al., 2005).
Geosynchronous spacecraft are located at the inner edge of the mid-tail plasma sheet and therefore constitute ideal tools for exploring the transport of CDPS populations to the in-ner magnetosphere. Thomsen et al. (2003) recently showed that the CDPS can access geosynchronous orbit when (1) a southward turning of the IMF occurs after a long interval of northward IMF or (2) a sudden solar wind pressure en-hancement occurs during or just after a period of long-lasting northward IMF. Thomsen et al. (2003) suggested that the for-mer scenario probably allows inward transport of the CDPS by restoring a strong, large-scale magnetospheric convection while the latter probably allows the observations of the CDPS as the result of a large compression of the magnetosphere.
In this study, we do not focus on the mechanisms lead-ing to the formation of the CDPS. We aim to establish its bulk properties and, most specifically, its temporal evolution when observed at geosynchronous orbit. This is achieved by performing a superposed epoch analysis of various plasma parameters. The local time dependence of such dense plasma events, as well as their actual direct sources (LLBL, plasma sheet, . . . ) and origin (solar wind, ionosphere, . . . ), are still to be established in the context of dense plasma events at geosynchronous orbit. After the CDPS is formed in the mid-tail regions, its transport to the inner magnetosphere has po-tential effects on the strength of the ring current and asso-ciated geomagnetic activity (Jordanova et al., 1998, 2003; Kozyra et al., 1998), which we also discuss.
(a) (b)
Fig. 1. Distributions of dense plasma measurements (>2 cm−3)by the MPA instrument on board the Los Alamos satellites at geosynchronous orbit, for the period 1990–2002. (a) Normalized density distributions of zero epoch (initial) and total dense plasma measurements. The solid line corresponds to the density distribution of the dense plasma measurements from zero epoch (normalized to the total number of zero epoch dense plasma events) while the dashed line corresponds to the density distribution of all dense plasma measurements recorded at geosynchronous orbit (normalized to the total number of dense measurements). See text for details. (b) The solid line is the local time distribution of the initial dense plasma events, normalized to the total number of events. The dashed line is the local time distribution of all dense plasma measurements. For this latter distribution, the total number of dense plasma measurements in each local time bin is normalized to the total number of measurements (regardless of density) recorded in that local time area during the period 1990–2002.
2 Instrumentation and data processing
In this study we make use of ion and electron measure-ments from the MPA (Magnetospheric Plasma Analyzer) in-struments on board the Los Alamos National Laboratory geosynchronous satellites. The MPA instruments are elec-trostatic analyzers. They measure the three-dimensional energy-per-charge distributions of both ions and electrons between ∼1 eV/q and ∼45 keV/q. We analyze density, tem-perature and velocity measurements which are available ev-ery 86 s (Thomsen et al., 1999) and are calculated for the en-ergy ranges 30–45 000 eV and 100–45 000 eV, respectively, for electrons and ions (assumed to be protons unless other-wise stated). The reader is referred to Bame et al. (1993) and McComas et al. (1993) for detailed description of the MPA instruments.
For the current study, data are taken from five different satellites in geosynchronous orbit covering the period be-tween 1990 and 2002. An analysis of the whole data set was first performed to obtain the statistics of all dense plasma measurements observed during this period. The “zero epoch” times used for the superposed epoch analyses come from a resulting list of 1464 dense plasma events. The zero epochs were defined as the first time, during a given day, at which one of the operating spacecraft measured an ion density ex-ceeding 2 cm−3. A delay of 12 h was further enforced be-tween two consecutive events. Magnetosheath and boundary layer encounters were removed by only accepting data points where the ion density is less than 10 cm−3and the ion bulk speed is less than 100 km/s.
3 Results
3.1 Local time distribution of the dense plasma
The normalized density distribution of the dense plasma measurements arising from the analysis of the entire MPA data set, for all times on all spacecraft, is shown in Fig. 1a as a dashed line. The solid line in Fig. 1a shows the normal-ized distribution of the density observed at the zero epoch of the 1464 events of dense plasma, as defined in Sect. 2. These density distributions are compatible with the tail of the distribution of plasma sheet density at geosynchronous orbit previously reported by Borovsky et al. (1997). The bulk of the distributions in Fig. 1a are between 2 and 3 cm−3, with a much lower occurrence frequency above 3 cm−3. Plasma sheet intervals with densities above 2 cm−3were referred to as “superdense” events by Borovsky et al. (1997), since the average plasma sheet density was found to be 0.7 cm−3.
The difference between the two distributions in Fig. 1a may be explained as follows. If the front of the dense plasma events is gradual in terms of density, one can expect to see a larger proportion of events in the range 2–3 cm−3first, i.e. at zero epoch (solid line). At latter times, the probability of observing higher densities increases, which is reflected by larger occurrence frequencies above 3 cm−3for the (dashed) distribution of all dense measurements.
The solid line in Fig. 1b shows the normalized local time distribution (1-h bins) of the 1464 dense plasma measure-ments from the zero epoch times. This distribution shows a tendency for dense plasma events to occur first close to midnight (solid line). The occurrence probability is much less each side of midnight toward the dayside. This result
(a)
(c)
(b)
(d)
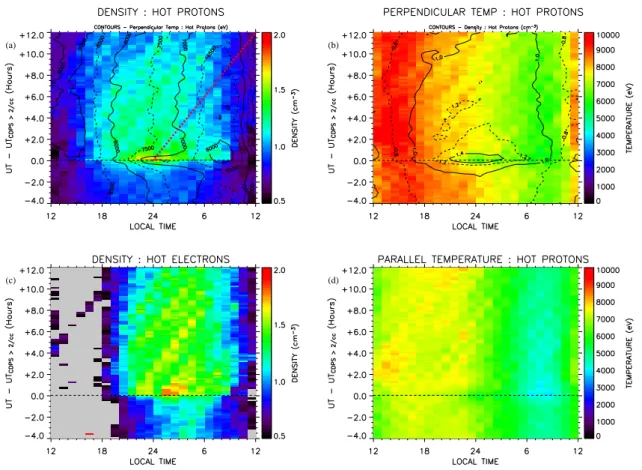
Fig. 2. Results of the superposed epoch analysis for various plasma parameters. The zero epoch times are those of the 1464 initial dense
plasma events. The measurements from all operating spacecraft are binned and averaged according to 24 local time bins (x-axis) and 96 ten-minute intervals in time. The total time interval ranges from −4 before to +12 h after the zero epoch (“0.0”). (a) Superposed epoch plot of the ion density measurements, with the perpendicular ion temperature over-plotted as smoothed contours. In this plot, the expected dawnward transport due to corotation is illustrated by the dashed red line. (b) Superposed epoch plot of the perpendicular ion temperature measurements, with the ion density over-plotted as smoothed contours. (c) Superposed epoch plot of the electron density. (d) Superposed epoch plot of the parallel ion temperature. Respective color palettes are given on the right side of each plot. See text for further details.
is consistent with the dense plasma events arising from sud-den access of the mid-tail plasma sheet to geosynchronous orbit. It also confirms that LLBL and magnetosheath cross-ings have been properly removed. The local time distribution of the full set of dense plasma measurements, normalized to the local time distribution of all geosynchronous obser-vations (which is essentially flat and is not shown here), is over-plotted as a dashed line with the corresponding y-axis scale to the right. This distribution shows that densities above 2 cm−3are rarely observed at geosynchronous orbit, with an
overall occurrence nearly always lower than 2%. The dense plasma observations occur largely near midnight, compatible with the distribution of dense measurements from zero epoch (solid line). However, a large occurrence is also found in the morning sector around 06:00 LT (dashed line). This feature is much less prominent in the distribution of the initial dense plasma events, from zero epoch (solid line).
The difference between the two distributions (Fig. 1b) was studied by comparing their cumulative probability dis-tributions (not shown), and quantified by means of the Kolmogorov-Smirnov test (Press et al., 1992). The largest
difference between the two cumulative distributions was found to be 18.98% (with a large significance), demonstrat-ing that the two distributions are significantly different.
In conclusion, first measurements of dense plasma are sta-tistically observed more often near midnight (Fig. 1b). Dense plasma measurements are also made with large occurrences on the dawn side, but at apparently later times. This observa-tion may, at first sight, be suggestive of a dawnward transport of the population seen close to midnight.
3.2 Location and evolution of the dense plasma events For the superposed epoch analysis results shown in Fig. 2, the MPA measurements from the 1464 events were binned and then averaged into 24 magnetic local time bins (x axis) and 96 ten-minute (epoch time) bins (y axis). The time inter-val shown for these plots spans from 4 h before zero epoch to 12 h after. Data from all operating spacecraft are used in these and subsequent superposed epoch plots. We also pre-formed the analysis using median values. The results show similar patterns and do not affect our main conclusions.
(a)
(b)
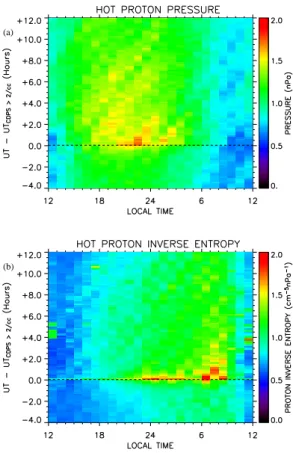
Fig. 3. Results of the superposed epoch analysis for various plasma
parameters, similar to Fig. 2. (a) Superposed epoch plot of the ion pressure. (b) Superposed epoch plot of the inverse entropy (based on ion measurements). Respective color palettes are given on the right side of each plot. See text for further details.
To facilitate comparison of Figs. 2a and b, smoothed con-tours of the ion perpendicular temperature are over-plotted on the color-coded superposed epoch plot of the ion den-sity (Fig. 2a), and vice versa for Fig. 2b. These plots show the appearance of dense plasma at geosynchronous orbit at zero epoch, predominantly close to midnight. This is consis-tent with the results from Sect. 3.1 and Fig. 1b. The dens-est plasma is observed for 1–2 h (epoch time) in the region 23:00–01:00 LT. However, the density in the midnight re-gion remains fairly high (>1 cm−3)for ∼10–12 h after zero epoch. The overall distribution of the high density plasma is seen to be slightly skewed towards dawn, on average. This is consistent with the higher occurrence of dense measurements at dawn when all measurements are taken into account (see Fig. 1b).
The dense population present near midnight at zero epoch is also found to be somewhat colder than normally observed in that region (∼5 keV compared to typical values of 7–8 keV at other epoch times near midnight). Unlike the density, the perpendicular ion temperature returns to pre-zero-epoch val-ues after only about 1–2 h (epoch time). Figure 2d shows the superposed epoch results for the parallel ion temperature. This component does not decrease much at zero epoch near midnight. A slight decrease in parallel ion temperature is
observed at dawn (05:00–10:00 MLT) near zero epoch. It may be noted that ion temperatures may be underestimated if the ion populations extend above the MPA energy range. The colder nature of the population observed at zero epoch near midnight, in comparison to the populations seen earlier and later in epoch time, does not suffer from this effect as the underestimation of the temperature should be less for colder populations.
Figure 2c shows the superposed epoch results for the hot electron density, which shows a similar behavior to that of the ion density. Two main differences may be noticed. First, low electron densities are observed on the dusk side as a re-sult of the preferential drift (both electric and magnetic) of electrons towards dawn. Secondly, the electron density ap-pears higher than the ion density from midnight to dawn in the dense plasma events. This latter observation may stem from the fact that (1) part of the ion populations are not de-tected on the dawn side of geosynchronous orbit because of the preferential (magnetic) drift of high energy ions toward dusk, and (2) there may be other populations, such as heavier ions, co-existing with the (assumed) protons (see Sect. 3.3).
Figure 3a presents the superposed epoch plot for the ion pressure (Pions=NionskBTions). The highest pressure is
cor-related with the cold, dense plasma observed near midnight. Although the temperatures there are lower, the high densities produce a large pressure. The pressure stays relatively high, but gradually decreases during the following 10 hours, as the density stays quite large and the temperature increases. The cold, dense plasma observed on the dawnside close to zero epoch (05:00–09:00 LT) does not lead to a significant pres-sure enhancement owing to particularly low temperatures.
Figure 3b gives the result of the analysis for the inverse entropy derived from ion measurements as S=Nions5/3/Pions
(where Pions=NionskBTions, and Tions is the perpendicular
ion temperature). Such a quantity emphasizes the popula-tions which are both cold and dense. It is seen that the pop-ulation detected close to midnight, near zero epoch, is in-deed unusually cold and dense. A striking feature is, how-ever, the prominence of a cold and dense population observed nearly simultaneously on the dawnside. This dense plasma observed at dawn could be the result of the dawnward trans-port of that observed near midnight. However, the population near midnight would need to drift dawnward faster than coro-tation, as will be discussed in Sect. 4. It is worth to note that this population is correlated with a decrease in the parallel ion temperature (Fig. 2d).
3.3 Isotropy of the dense plasma events
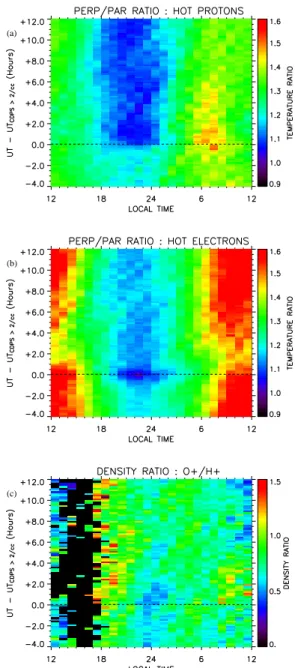
Figures 4a and b show the results of the superposed epoch analysis for the perpendicular-to-parallel temperature ratio, for the ions and electrons, respectively. These plots show that, before the zero epoch, both ions and electrons show a finite anisotropy (T⊥>Tk), which increases from midnight to
the dayside. At zero epoch (and onwards), however, both ions and electrons display a large decrease of the anisotropy
in the midnight region. This property is correlated with the arrival of the dense plasma.
Unlike the plasma sheet boundary layers, which are char-acterized by anisotropic ion distributions, the mid-tail and distant (central) plasma sheet are generally made of isotropic ion populations (Eastman et al., 1984; 1985; Nakamura et al., 1992). Ion populations observed at geosynchronous orbit may have different properties, resulting from plasma sheet processing through its inward transport (Korth et al., 1999; Thomsen et al., 2003; Denton et al., 2005). The plasma perpendicular temperature rises as the magnetic field in-creases (adiabatic heating) inward, toward geosynchronous orbit, while the parallel temperature may not increase as much as a result of precipitation (parallel to the magnetic field) and charge exchange with exospheric neutrals. As a consequence, plasma temperature anisotropy increases as the plasma is transported around the Earth, toward the dayside (Denton et al., 2005). This midnight-to-dayside feature is observed at all epoch times in the results of Figs. 4a and b.
In the event of fresh supply of plasma sheet material to geosynchronous orbit, ion and electron populations are unlikely to have experienced much precipitation or charge exchange and therefore are more isotropic (Denton et al., 2005). The isotropic nature of the dense plasma observed at zero epoch close to midnight suggests that it is made of newly injected plasma, presumably from the mid-tail region. It is further noted that the ion anisotropy (Fig. 4a) stays low for a long period after zero epoch. This long lasting prop-erty has a similar extent to that of the high density plasma mentioned in Sect. 3.2.
In the midnight region, from zero epoch onwards, the low anisotropy is seen to persist longer for ions than for electrons. This feature may be attributed to the characteristic precipita-tion time of the electrons being much shorter than that of the ions, owing to their large velocity and thus a short bounce pe-riod. This characteristic precipitation time may be compared to the characteristic transport time, which is independent of the species for electric field drift. Injected electrons thus be-come anisotropic faster than the corresponding ion popula-tion. The lower electron anisotropies near zero epoch at mid-night may indicate an enhanced convection at that time.
The population observed at dawn near zero epoch, and characterized by a large inverse entropy (Fig. 3b), also presents a large ion anisotropy (Fig. 4b). This property sug-gests that this population is different from that observed near midnight.
3.4 Composition of the dense plasma events
Although MPA is an electrostatic analyzer (E/q), with no ex-plicit mass discrimination capability, under certain circum-stances MPA measurements may also be used to assess the composition of these populations (Denton et al., 2005). Here we are interested in the potential contribution of O+ions to the measured densities. The technique described below re-quires the following conditions:
(a)
(b)
(c)
Fig. 4. Results of the superposed epoch analysis for various plasma
parameters, similar to Fig. 2. (a) Superposed epoch plot of the perpendicular-to-parallel ion temperature ratio. (b) Superposed
epoch plot of the perpendicular-to-parallel electron temperature ra-tio. (c) Superposed epoch plot of the inferred O+/H+density ratio. Respective color palettes are given on the right side of each plot. See text for further details.
1. The ion and electron populations detected in the energy range of the MPA instrument (cf. Sect. 2) must be much denser than any lower energy population also present. 2. The high energy part of the distributions (>45 keV)
make a negligible contribution to the density.
As discussed by Denton et al. (2005), the routinely com-puted “ion density” used in this study is calculated under the assumption that all the measured ions are protons. If, in fact, there is a significant admixture of heavier ions, this approach
(b) Superposed Epoch Analysis of Dst index (a) Superposed Epoch Analysis of Kp index
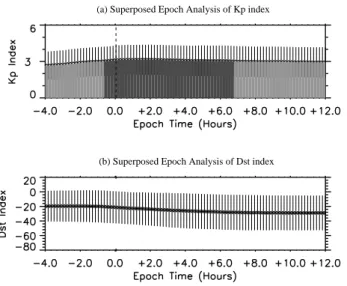
Fig. 5. Results of the superposed epoch analysis for the (a) Kpand
(b) Dstindices. Although the Kpand Dstindices have resolutions,
respectively, of 3 and 1 h, Kpand Dstvalues from all 1464 intervals
were binned and averaged into ten-minute bins to fit the results of Figs. 2, 3 and 4. Bins corresponding to an average Kpgreater or
equal to 3 are colored dark grey. The error bars show the average absolute deviations from the mean in each epoch time bin.
underestimates the heavy ion contribution to the density by a factor of the square root of the heavy ion mass (in units of the proton mass). Our estimation of the non-proton content of the plasma sheet is thus based on the assumption that the difference between the measured electron and ion densities is due to the possible presence of O+ions (neglecting
con-tributions from other ions). O+ is known to form a major population, at times, in the mid-tail plasma sheet. Because the measured electron density is the sum of electrons from all ions, charge neutrality simply yields the following equal-ity:
NHE=Ne− =NH++NO+, (1)
where NHE is the measured hot electron density, and Ne−,
NH+and NO+are, respectively, the true electron, proton and
O+densities.
With the contribution from the O+population to the total
density scaled byp(mH+/mO+), the measured ion density
with all ions assumed to be protons (NHP)is:
NHP=NH++NO+/4 . (2)
The combination of the previous two equations allows the es-timation of the true H+and O+densities, from the measured quantities, as:
NH+ =(4NHP−NHE)/3 (3)
NO+ =(NHE−NHP) ×
4
3. (4)
The inferred O+ and H+ densities were calculated in this
way for the dense plasma intervals and the ratio of O+to H+
density distributions is shown in Fig. 4c in a similar format to the previous results.
Because of the assumptions (1) and (2) on which this tech-nique is based, its application to the observations is restricted in local time. First, typical plasma sheet electrons do not have access to the duskside of geosynchronous orbit (Korth et al., 1999) and therefore the estimations described above cannot be used there. On the dawnside of the orbit, ion and electron precipitation is effective and implies finite tem-perature anisotropies, as shown previously in this section. As a result, outflows of lower energy ionospheric popula-tions may exist and the relapopula-tions described above may not be used. On the other hand, in the midnight region, where the plasma is arguably freshly injected and isotropic, the calcu-lated O+/H+density ratio can be used to estimate the relative composition of the ion populations. In the midnight region, Fig. 4c shows that the estimated O+/H+density ratio is be-low 1 before zero epoch. It goes down to a minimum when the cold and dense plasma is observed and reaches its highest values at least 2 h after zero-epoch and onward. The inter-val of lowest inferred O+/H+density ratio, at and after zero epoch, is basically the same as that of the reduced perpendic-ular ion temperature in Figs. 2a and b. It is much shorter than that of the isotropic, high density ion population (10–12 h in Figs. 2a and 4a).
3.5 Superposed epoch analyses of Kpand Dst indices
Previous studies have shown that plasma sheet access to geosynchronous orbit exhibits specific correlations with the Kpand Dst indices (Korth et al., 1999; Thomsen et al., 2002;
Denton et al., 2005). The former index is a proxy for the convection electric field strength (Thomsen, 2004) while the latter gives an estimate of the ring current strength. It is thus natural to look for potential relationships between the access of dense plasma at geosynchronous orbit and those indices.
Figure 5a shows the result of the superposed epoch analy-sis for the Kpindex. Here Kpindices were binned into
10-min intervals to fit the resolution of the other results in this study. The Kp index originally has a 3-h resolution, which
results in an important smoothing of the profile. The error bars show the average absolute deviations from the mean for each epoch time bin. These represent the spread in the dis-tributions. The actual statistical errors, for example, the av-erage absolute deviation of the mean, would be
√ N times smaller (with N =1464). Figure 5a shows that the observa-tion of the cold, dense plasma is preceded by an enhancement of the Kp index. The Kp profile increases above Kp=3,
starting about 1 h before zero epoch. It returns to values be-low Kp=3 about 6 h after zero epoch (dark grey coloring
corresponds to Kp≥3).
Figure 5b shows the results for the Dst index. The Dst
in-dex is available for intervals of 1 h. It is binned and displayed in the same manner as the Kpindex. Figure 5b shows that the
(a) (b)
EFlux perp; E = [105 − 1220] eV EFlux para; E = [105 − 1220] eV
Fig. 6. (a) Scatter plot of all temperature and density measurements (black crosses) from the region having characteristics of the cold, dense
plasma sheet (CDPS), between 23:00–01:00 LT and 00:00–00:30 epoch time. The white squares represent the temperature and density ranges which comprise 10% and 50% of the measurements, centered on the median values for each parameter. The red and green squares are equivalent and come from the measurements in the same local time range 23:00–01:00 LT, but, respectively, for the intervals −03:00–
−02:30 and 06:00–06:30 in epoch time. (b) Local time distribution of the average energy flux (cm−2s−1sr−1)measured in the morning sector, for the parallel (black) and perpendicular (red) directions and for the energy band 105–1220 eV. The error bars show the average absolute deviation from the mean in each local time bin. These data come from a subset of 121 events observed by Los Alamos spacecraft 1991-080.
of the analysis. It only drops by ∼10 nT during the interval. Thus, no enhanced ring current is measured in correlation with the dense plasma observations.
4 Discussion
In Sect. 3.1, the difference observed between the distribu-tions of initial and total dense plasma measurements (Fig. 1b) is suggestive of a later arrival of the dense population at dawn, as compared to that observed near midnight. This re-sult at first seemed consistent with the transport of the cold and dense plasma from the midnight region to the dawnside of geosynchronous orbit. However, to a first approximation, any transport of plasma from midnight to dawn at geosyn-chronous orbit would predominantly originate from corota-tion. In Fig. 2a, plasma corotation can be approximated by the red dashed line. Figure 2a thus shows that the arrival of the cold, dense plasma seen at dawn near zero epoch (most clearly seen in the inverse entropy in Fig. 3b) is well before the corotation could deliver it from a near-midnight entry. It is noted, moreover, that the minimum average temperature of ∼5 keV recorded near midnight makes the corresponding plasma unlikely to be dominated by corotation. This finding suggests two possible scenarios for the occurrence of dense plasma at dawn observed in Fig. 1b: (1) dense plasma ac-cess to geosynchronous orbit occurs all along the geosyn-chronous orbit in the midnight-to-dawn quadrant, with pos-sible temporal delays due to transport time, or (2) there ex-ists two different sources of cold and dense plasma, one in
the midnight, mid-tail plasma sheet and one in the dawnside magnetosphere. We come back to this topic later in this sec-tion.
In Sect. 3.3, we argued that the isotropy of the dense plasma population in the midnight region is an indication that it has been freshly injected from the mid-tail region (Denton et al., 2005). We showed that the cold, dense population is seen for about 1–2 h and that it has a low concentration of O+ ions (Fig. 4c). The fact that this midnight population (1) is colder and denser than the typical plasma sheet, (2) is freshly injected from the mid-tail region, and (3) has a relatively low O+concentration suggest that it has a solar wind origin, with as-yet little contribution from its coupling to the ionosphere, and that it may originate from, and thus may be called, the cold, dense plasma sheet (CDPS) (Lennartsson and Shelley, 1986; Terasawa et al., 1997; Fujimoto et al., 1998; Phan et al., 2000; Thomsen et al., 2003).
Figure 6a shows a scatter plot of the temperature and density measurements obtained within the intervals 23:00– 01:00 LT and 00:00–00:30 in epoch time, which corresponds to the main occurrence of CDPS. The white squares rep-resent the temperature and density ranges comprising 10% and 50% of these measurements, centered on the median values, for each parameter. The red and green squares are equivalents coming from the measurements in the same lo-cal time range but, respectively, for the epoch time intervals −03:00–−02:30 and 06:00–06:30. Figure 6a shows that al-though very cold (<5 keV) and dense measurements do oc-cur near zero epoch, the core of the distribution corresponds
to relatively high temperatures (>5 keV) and densities. It is overlapping with the measurements at the two other epoch time intervals (red and green squares). The median values (basically the centers of the squares) clearly show lower den-sities and higher temperatures for the other intervals (red and green) in epoch time, both before and after, when compared to the CDPS region (white). As seen in Fig. 3a, the interval 06:00–06:30 epoch time (green) shows a larger plasma pres-sure than the interval −03:00–−02:30 epoch time (red). The temperatures for all intervals are higher than typically ob-served in the more distant tail (e.g. Øieroset et al., 2005), pre-sumably owing to adiabatic heating during the inward trans-port to geosynchronous orbit.
The necessity for an enhanced convection, in order to ob-serve the CDPS at geosynchronous orbit, was suggested by Thomsen et al. (2003). Although the change in Kpis not
dra-matic, this trend is confirmed by the superposed epoch anal-ysis of the Kpindex in Fig. 5a. The short duration of the low
temperature anisotropy interval observed for the electrons, as compared to that of the ions (see Sect. 3.3), is also compatible with an enhanced convection at zero epoch. The CDPS thus seems to have access to the inner magnetosphere, through geosynchronous orbit, when enhanced convection allows its inward transport. The high plasma pressure observed for the CDPS at zero epoch (Fig. 3a) comes from the enhanced den-sity, even in the presence of reduced temperature. In other words, the enhanced pressure at zero epoch does not come from the simple compression of a hot and tenuous popula-tion but must reflect the arrival of a different populapopula-tion al-together, one that is colder and denser than those observed at other times.
The plasma sheet is a source population for the ring cur-rent (Jordanova et al., 1998; Kozyra et al., 1998). However, Fig. 5b shows that, in general, CDPS episodes do not result in storm conditions, even though they bring enhanced plasma pressure inside the geosynchronous orbit. This is presumably because the intervals of CDPS are not typically followed by sustained high levels of convection that can deliver the high-density material deep into the magnetosphere (Fig. 5a).
In the midnight region, the cold, dense plasma sheet (CDPS) is observed for approximately 1–2 h after zero epoch. After this time the temperature resumes pre-zero epoch values, although the density remains elevated. From the 3-D MPA measurements one can estimate the flow speed of the newly arriving CDPS. Although it is a difficult mea-surement to make because of the high thermal speed of the plasma, the flow calculations typically show flow speeds in the neighborhood of 20 km/s, and essentially never exceed-ing 50 km/s. For a duration of 1 hour and an inward speed of 50 km/s, one may estimate the extent of the CDPS from the mid-tail region which has passed through geosynchronous orbit to be ∼28 RE, i.e. a portion of the tail plasma sheet.
If the plasma sheet is transported to geosynchronous orbit by the onset of convection through reconnection in the mid-tail, it is interesting to note that the mid-tail reconnection pro-cess would result in the (tailward) expulsion of the CDPS lo-cated tailward of the reconnection line. Thus, only a limited
portion of the tail CDPS can be transported to the inner mag-netosphere.
It thus seems that the dense population observed between about +2 and +10 h after zero epoch in Figs. 2a and b may not actually be the CDPS. This later-arriving population has densities above the typical plasma sheet density (∼0.7 cm−3, cf. Borovsky et al., 1997) but has more typical plasma sheet temperature (cf. Fig. 2b). This population also has relatively high O+ densities, which suggests a longer period of cou-pling with the ionosphere.
We thus suggest that the entry mechanisms of the two populations, the CDPS near zero epoch and that extending up to +10 h in epoch time (hotter and still dense), may, in fact, be different. The entry mechanisms for the CDPS may relate to northward IMF conditions and may come from, for example, Kelvin-Helmoltz instability at the flank magnetopause or direct capture of magnetosheath plasma by double high-latitude dayside reconnection (see Introduc-tion). After the first 1–2 h (epoch time), the pre-existing CDPS has passed geosynchronous orbit. The still-dense but hotter population observed thereafter may originate from other solar wind plasma entry mechanisms. These, by contrast, may be related to subsequent southward IMF (Thomsen et al., 2003) and/or large solar wind density (Borovsky et al., 1998; McComas et al., 2002). Future studies will focus on the effect of solar wind parameters on geosynchronous observations, with particular emphasis on the IMF orientation and solar wind density.
The cold and dense population observed near zero epoch at dawn (Fig. 3b) shows an increase in ion anisotropy (Fig. 4a). This property may be viewed as a clue for it coming from a distinct source population. One explanation would be that this population is the low-latitude boundary layer (LLBL). It must be noted, however, that we have presumably removed magnetosheath and LLBL passes by use of density and ve-locity thresholds in our analysis. There would further be no obvious reason to observe the LLBL only at dawn. Fig-ures 2b and d show that the larger anisotropy seen in this region (Fig. 4a) stems from a decrease in parallel ion temper-ature rather than from an increase in perpendicular tempera-ture. This feature, together with the measured enhanced den-sity, may have two explanations: (1) the precipitation (and charge exchange) of parallel-flowing plasma sheet ions into the ionosphere, and (2) the presence of cold, field-aligned ions of ionospheric origin. In this latter context, the find-ing by Andr´e and Yau (1997), that more auroral ion heat-ing events (presumably associated with ion upflows) occur at dawn than at dusk, is consistent with the absence of such a clear feature at dusk in our observations (Fig. 2a).
To investigate the possible ionospheric origin of this dense population, we have analyzed the full pitch angle distribu-tion available from a subset of 121 events observed by Los Alamos spacecraft 1991-080. Figure 6b shows the average energy flux measured by MPA in the parallel (black) (aver-age of parallel and anti-parallel directions, for 20◦pitch angle bins) and perpendicular (red) directions, for the energy range
(a) (b) (c) (d) (e) 1 2 1 (f) (g) Tpar ions Tperp ions ratio Tperp/Tpar Density 00:00 02:00 04:00 06:00 22:00 Local time
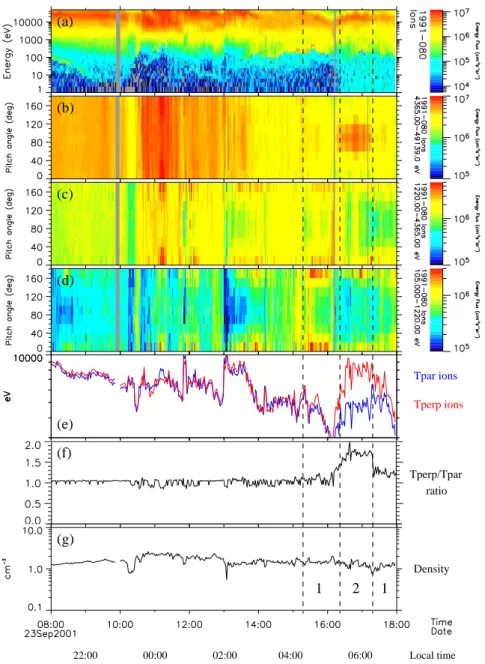
Fig. 7. Los Alamos spacecraft 1991-080 data for the interval 08:00–18:00 UT on 23 September 2001. Panel (a) shows the omni-directional
energy flux spectra for the ions. Panels (b), (c) and (d) display the pitch angle spectra of the ions for the energy ranges 4365–49139, 1220–4365 and 105–1220 eV, respectively. The magnetic field direction was found by use of the ion pressure tensor, assuming gyrotropy. Panel (e) shows the measured parallel and perpendicular ion temperatures. Panels (f) and (g) display the parallel-to-perpendicular ion temperature ratio and the ion density, respectively. Regions 1 and 2, in panel (g), are described in the text. Universal and local times are shown at the bottom.
105–1220 eV, as a function of local time in the morning sec-tor. To increase the statistics, we used all measurements from the interval 00:00–06:00 in epoch time. This interval is that of large inverse entropy in Fig. 3b. The mean absolute devia-tions are shown for each curve as error bars. Although large error bars are observed as a result of the limited statistics, it is seen that the average energy flux in the parallel (black line) direction is larger than that in the perpendicular (red line) di-rection. This shows the presence of mainly field-aligned ion populations at low energies. Such populations are most likely of ionospheric origin. Furthermore, the average energy flux
increases with local time toward dawn, in both the parallel and perpendicular directions, by a factor ∼2. This finding indicates that cold, field-aligned ionospheric populations be-come significant toward dawn.
Figure 7 shows an overview plot of the ion observations from one of the subset events from spacecraft 1991-080. An omni-directional ion energy flux spectrogram, three pitch angle spectrograms for different energy ranges, the parallel and perpendicular temperatures, their ratio, and the density are shown from top to bottom (see caption for details). The arrival of the dense plasma (>2 cm−3)is seen at ∼10:30 UT
(∼23:30 LT). From the pitch angle spectrograms for three different energy ranges, we note that the high energy pop-ulation (panel b) is relatively isotropic while the low energy population is mostly field-aligned (panel d). The medium energy range (panel c) is a combination of both. At low en-ergies, panel (d) shows the same feature as the statistical re-sults of Fig. 6b: more field-aligned ionospheric ions are ob-served toward dawn. This population is predominantly seen in region 1, as indicated in panel (g). Its presence does not lead to any significant anisotropy (panel f). The addition of a cold, field-aligned (bidirectional) population to the original plasma sheet plasma may indeed not lead to an anisotropy such that T⊥>Tk. On the other hand, panel (b) shows that
the high-energy ion population, which is of plasma sheet ori-gin, becomes mainly perpendicular to the magnetic field at dawn in region 2 (indicated in panel g). This feature is at the origin of the decrease in parallel temperature (note the lack of ionospheric material at this time) and is likely caused by field-aligned precipitation of plasma sheet ions into the ionosphere and charge exchange processes. Ion and electron precipitation in this region may induce ionospheric outflows which further help to increase the density. Future work will focus on these phenomena in more detail.
5 Conclusion
We have reported on the occurrence and properties of the cold, dense plasma sheet (CDPS) at geosynchronous orbit. We have performed a superposed epoch analysis based on 1464 events of dense (>2 cm−3 at onset) plasma observed by the MPA instruments on board the Los Alamos spacecraft between 1990 and 2002. We have investigated the charac-teristics and temporal evolution of various plasma parame-ters as a function of local time. The results show that dense plasma access to geosynchronous orbit occurs first, and pre-dominantly, near midnight. The dense plasma population observed in the midnight region is freshly injected, colder than the typical plasma sheet observed there, and has a rela-tively small inferred O+component. These findings lead us to conclude that the dense plasma population detected near midnight is the result of cold, dense plasma sheet (CDPS) in-jection from the mid-tail region. The short duration (1–2 h) of the CDPS corresponds to the passage of a substantial frac-tion of the pre-existing plasma sheet, followed by continued dense but hotter plasma, which we suggest is possibly repre-sentative of a different plasma sheet filling mechanism.
A cold and dense ion population is also observed on the dawnside of geosynchronous orbit. We demonstrated that this latter population is not the result of the dawnward trans-port of that observed near midnight. Rather, our analysis suggests that this population is made of a combination of plasma sheet and ionospheric material. It may result from coupling to the ionosphere induced by particle precipitation and charge exchange during times of enhanced convection and density.
The observation of enhanced Kpindex prior to the arrival
of the CDPS at geosynchronous orbit shows that its inward transport is probably allowed by an enhanced convection in the mid-tail, compatible with the suggestion of Thomsen et al. (2003). This dense plasma, however, does not typically result in a stronger ring current (Dst). This is consistent with
the fact that the averaged Kp index (and hence the
convec-tion) typically remains modest, or even decreases after the arrival of the CDPS. The use of a unique criterion on the ion density in the present study probably has led to the ad-mixture of different types of dense plasma events (e.g. storm and non-storm times). Future studies will focus on subsets of events defined using different criteria and on the ordering of geosynchronous observations as a function of solar wind conditions.
Acknowledgements. Work at Los Alamos was performed under the auspices of the US Department of Energy, with partial support from the NASA LWS program. We thank A. Aasnes for the use of the MPA pitch angle computing tool.
Topical Editor M. Pinnock thanks H. Hasegawa and another referee for their help in evaluating this paper.
References
Andr´e, M. and Yau, A.: Theories and observations of ion energiza-tion and outflow in the high latitude magnetosphere, Space Sci. Rev., 80, 27–48, 1997.
Bame, S. J., McComas, D. J., Thomsen, M. F., Barraclough, B. L., Elphic, R. C., Glore, J. P., Gosling, J. T., Chavez, J. C., Evans, E. P., and Wymer, F. J.: Magnetospheric plasma analyzer for spacecraft with restrained resources, Rev. Sci. Instrum., 64, No. 4, 1026–1033, 1993.
Borovsky, J. E., Thomsen, M. F., and McComas, D. J.: The super-dense plasma sheet: Plasmapheric origin, solar wind origin, or ionospheric origin?, J. Geophys. Res., 102, 22 089–22 097, 1997. Borovsky, J. E., Thomsen, M. F., and Elphic, R. C.: The driving of the plasma sheet by the solar wind, J. Geophys. Res., 103, No. A8, 17 617–17 639, 1998.
Denton, M. H., Thomsen, M. F., Korth, H., Lynch, S., Zhang, J.-Ch., and Liemohn, M. W.: Bulk plasma properties at geosyn-chronous orbit, J. Geophys. Res., 110, No. A7, A07223, doi:10.1029/2004/JA010861, 2005.
Eastman, T. E., Frank, L. A., Peterson, W. K., and Lennartsson, W.: The plasma sheet boundary layer, J. Geophys. Res., 89, No. A3, 1553–1572, 1984.
Eastman, T. E., Frank, L. A., and Huang, C. Y.: The boundary layers as the primary transport regions of the Earth’s magnetotail, J. Geophys. Res., 90, No. A10, 9541–9560, 1985.
Fujimoto, M., Terasawa, T., Mukai, T., Saito, Y., and Yamamoto, T.: Plasma entry from the flanks of the near-Earth magnetotail: Geotail observations, J. Geophys. Res., 103, 4391–4408, 1998. Hasegawa, H., Fujimoto, M., Phan, T. D., R`eme, H., Balogh, A.,
Dunlop, M. W., Hashimoto, C., and TanDokoro, R.: Rolled-up Kelvin-Helmholtz vortices and associated solar wind entry at Earth’s magnetopause, Nature, 430, 755–758, 2004.
Jordanova, V. K., Kistler, L. M., Thomsen, M. F., and Mouikis, C. G.: Effects of plasma sheet variability on the fast initial ring current decay, Geophys. Res. Lett., 30, No. 6, 1311–1314, 2003.
Jordanova, V. K., Farrugia, C. J., Janoo, L., Quinn, J. M., Torbert, R. B., Ogilvie, K. W., Lepping, R. P., Steinberg, J. T., McComas, D. J., and Belian, R. D.: October 1995 magnetic cloud and ac-companying storm activity: ring current evolution, J. Geophys. Res., 103, 79–92, 1998.
Korth, H., Thomsen, M. F., Borovsky, J. E., and McComas, D. J.: Plasma sheet access to geosynchronous orbit, J. Geophys. Res., 104, 25 047–25 061, 1999.
Kozyra, J. U., Jordanova, V. K., Borovsky, J. E., Thomsen, M. F., Knipp, D. J., Evans, D. S., McComas, D. J., and Cayton, T. E.: Effects of a high-density plasma sheet on ring current develop-ment during the November 2-6, 1993, magnetic storm, J. Geo-phys. Res., 103, 26 285–26 305, 1998.
Lennartsson, W. and Shelley, E. G.: Survey of 0.1- to 16-keV/e plasma sheet ion composition, J. Geophys. Res., 91, 3061–3076, 1986.
Lennartsson, W.: A scenario for solar wind penetration of earth’s magnetic tail based on ion composition data from the ISEE 1 spacecraft, J. Geophys. Res., 97, 19 221–19 238, 1992.
McComas, D. J., Bame, S. J., Barraclough, B. L., Donart, J. R., Elphic, R. C., Gosling, J. T., Moldwin, M. B., Moore, K. R., and Thomsen, M. F.: Magnetospheric Plasma Analyzer: Initial three-spacecraft observations from geosynchronous orbit, J. Geophys. Res., 98, 13 453–13 465 , 1993.
McComas, D. J., Valek, P., Burch, J. L., Pollock, C. J., Skoug, R. M., and Thomsen, M. F.: Filling and emptying of the plasma sheet: Remote observations with 1-70 keV energetic neutral atoms, Geophys. Res. Lett., 29, No. 22, 36-1-4, 2002.
Nakamura, M., Paschmann, G., Baumjohann, W., and Sckopke, N.: Ion distributions and flows in and near the plasma sheet boundary layer, J. Geophys. Res., 97, No. A2, 1449–1460, 1992.
Øieroset, M., Raeder, J., Phan, T. D., Wing, S., McFadden, J. P., Li, W., Fujimoto, M., R`eme, H., and Balogh, A.: Global cooling and densification of the plasma sheet during an extended period of purely northward IMF on October 22–24, 2003, Geophys. Res. Lett., 32, No. 12, L12S07, doi:10.1029/2004GL021523, 2005.
Phan, T. D., Lin, R. P., Fuselier, S. A., and Fujimoto, M.: Wind observations of mixed magnetosheath-plasma sheet ions deep inside the magnetosphere, J. Geophys. Res., 105, 5497–5505, 2000.
Press, W. H., Teukolsky, S. A., Vettering, W. T., and Flannery, B. P.: Numerical Recipes in C, Cambridge Univ. Press, New York, 1992.
Raeder, J., Berchem, J., Ashour-Abdalla, M., Frank, L. A., Patter-son, W. R., AckerPatter-son, K. L.., Kokubun, S., Yamamoto, T., and Slavin, J. A.: Boundary layer formation in the magnetotail: Geo-tail observations and comparisons with a global MHD simula-tion, Geophys. Res. Lett., 24, No. 8, 951–954, 1997.
Song, P. and Russell, C. T.: Model of the formation of the low-latitude boundary layer for strongly northward interplanetary magnetic field, J. Geophys. Res., 97, No. A2, 1411–1420, 1992. Terasawa, T., Fujimoto, M., Mukai, T., Shinohara, I., Saito, Y., Ya-mamoto, T., Machida, S., Kokubun, S., Lazarus, A. J., Steinberg, J. T., and Lepping, R. P.: Solar wind control of density and tem-perature in the near-Earth plasma sheet: WIND/GEOTAIL col-laboration, Geophys. Res. Lett., 24, No. 8, 935–938, 1997. Thomsen, M. F., Noveroske, E., Borovsky, J. E., and McComas,
D. J.: Calculation of moments from measurements by the Los Alamos magnetospheric plasma analyzer, LA Rep. LA-13566-MS, Los Alamos Nat. Lab., Los Alamos, N. M., 1999.
Thomsen, M. F., Korth, H., and Elphic, R. C.: Upper cutoff energy of the electron plasma sheet as a measure of magnetospheric con-vection strength, J. Geophys. Res., 107, No. A10, 1331, SMP25-1-18, 2002.
Thomsen, M. F., Borovsky, J. E., Skoug, R. M., and Smith, C. W.: Delivery of cold, dense plasma sheet material into the near-Earth region, J. Geophys. Res., 108, No. A4, 1151, doi:10.1029/2002JA009544, 2003.
Thomsen, M. F.: Why Kp is such a good measure
of magnetospheric convection, Space Weather, 2, doi:10.1029/2004SW000089, 2004.
Whipple, E. C.: (U,B,K) coordinates: A natural system for studying magnetospheric convection, J. Geophys., Res., 83, 4318–4326, 1978.