HAL Id: hal-00318097
https://hal.archives-ouvertes.fr/hal-00318097
Submitted on 3 Jul 2006
HAL is a multi-disciplinary open access
archive for the deposit and dissemination of
sci-entific research documents, whether they are
pub-lished or not. The documents may come from
teaching and research institutions in France or
abroad, or from public or private research centers.
L’archive ouverte pluridisciplinaire HAL, est
destinée au dépôt et à la diffusion de documents
scientifiques de niveau recherche, publiés ou non,
émanant des établissements d’enseignement et de
recherche français ou étrangers, des laboratoires
publics ou privés.
Wuhan during geomagnetic storms
G. Li, B. Ning, W. Wan, B. Zhao
To cite this version:
G. Li, B. Ning, W. Wan, B. Zhao. Observations of GPS ionospheric scintillations over Wuhan during
geomagnetic storms. Annales Geophysicae, European Geosciences Union, 2006, 24 (6), pp.1581-1590.
�hal-00318097�
Ann. Geophys., 24, 1581–1590, 2006 www.ann-geophys.net/24/1581/2006/ © European Geosciences Union 2006
Annales
Geophysicae
Observations of GPS ionospheric scintillations over Wuhan during
geomagnetic storms
G. Li1,2,3, B. Ning1, W. Wan1, and B. Zhao1,2,3
1Institute of Geology and Geophysics, Chinese Academy of Sciences, Beijing, China 2Wuhan Institute of Physics and Mathematics, CAS, Wuhan, China
3Graduate School of Chinese Academy of Sciences, Beijing, China
Received: 12 December 2005 – Revised: 15 March 2006 – Accepted: 19 April 2006 – Published: 3 July 2006
Abstract. During the two geomagnetic storms which
oc-curred on 1 October 2002 and 22 January 2004, the strong ionospheric scintillations of the GPS L1 band were observed at Wuhan station (30.6◦N, 114.4◦E, 45.8◦Dip), which is sit-uated near the northern crest of the equatorial ionosphere anomaly. We found that the intense scintillations were as-sociated with the main phases of the storms and were co-located with the enhancement of the equatorial ionization anomaly (EIA); the co-existence of large- and small-scale ir-regularities at post-midnight was also found. The results may be relevant regarding the influence of the equatorial iono-spheric eastward electric field during geomagnetic storms. On the other hand, GPS L1 band scintillations were not ob-served during the other two similar storms on 16 July 2003 and 20 November 2003. One of the reasons is probably that the sporadic E layer observed at the storms inhibited the gen-eration of spread F by changing the Pedersen conductivity and suppressing the upward plasma drift.
Keywords. Ionosphere (Ionospheric irregularities;
Mid-latitude ionosphere) – Magnetospheric physics (Storms and substorms)
1 Introduction
Sometimes when a radio signal acts on the disturbed iono-sphere, the received signal will show rapid fluctuations in amplitude and phase which are not consistent with the source strength or modulation. This so-called scintillation is at-tributable to electron density irregularities primarily in the ionospheric E and F regions (Yeh and Liu, 1982). Scin-tillations observed at low latitudes are primarily controlled by the generation and growth of irregularities over the mag-netic equator, where the effects of upward plasma E×B drift
Correspondence to: G. Li
(gzlee@mail.iggcas.ac.cn)
and more effective ion recombination at lower altitudes re-sult in a steep gradient of electron density on the bottom-side F region. When the altitude of the F region is high enough or the bottom-side background electron density gra-dients are large enough to overcome recombination effects, the Rayleigh-Taylor instability mechanism initiates a growth in plasma fluctuations. An upward moving bubble of de-pleted plasma is produced, which rises and eventually trans-forms itself into a plethora of smaller irregularities. By ex-amining quantitatively the influence of the pre-midnight spo-radic E (Es) layer on the daily and hourly development of equatorial spread F (ESF), and calculating changes in the flux tube-integrated Pedersen conductivity as it affects the growth rate of the Rayleigh-Taylor instability, Andrew et al. (2002) concluded that Es layers might change the Pedersen conduc-tivity ratio and the growth rate of ESF. At auroral area, struc-tured F-region density gradients are the primary instability source (Basu et al., 1993). Contrary to the high and low lat-itudes, the mid-latitude ionosphere is generally regarded as a less active scintillation environment, especially at L-band frequencies, and is considered to be absent of scintillations.
Recent studies indicate that the mid-latitude region is more complicated than previously thought. Foster et al. (2002, 2005) observed plumes of greatly enhanced total electron content (TEC) during the intense geomagnetic storms of 31 March 2001 and 30–31 October 2003. By observing GPS L1 amplitude scintillations in the mid-latitude region, Ledvina et al. (2002) concluded that this storm-enhanced density (SED) structure plays a major role in the formation of irregularities. Moreover, Basu et al. (2005) found two dis-tinct classes of plasma processes that produce mid-latitude ionospheric irregularities associated with auroral plasma pro-cess and SED gradients during the geomagnetic storm of 30 October 2003.
Some mechanisms for mid-latitude irregularities were also investigated. Perkins (1973) presented a model that was used to explain the mid-latitude structures. Later, Hamza (1999)
9
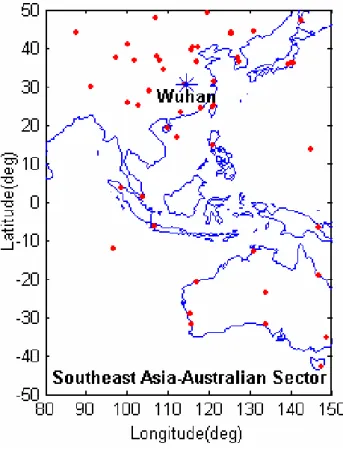
Figure. 1. The dots show the geographic distribution of GPS receivers that were used in our TEC
calculation. The “*” marks the location of Wuhan station.
Fig. 1. The dots show the geographic distribution of the GPS re-ceivers that were used in our TEC calculation. The “*” marks the location of Wuhan station.
revisited the Perkins instability and introduced two new ele-ments. Recently, Tsunoda and Cosgrove (2001) pointed out that the F layer and the sporadic E layer in the nighttime mid-latitude ionosphere must be considered electro-dynamically as a coupled system (Haldoupis et al., 1996; Tsunoda, 1998; Cosgrove and Tsunoda, 2001, 2002a, 2002b, 2003, 2004; Cosgrove et al., 2004).
In this paper, we investigate both the amplitude and phase scintillations of the GPS L1 band observed at the low-middle latitude station Wuhan (30.6◦N, 114.4◦E, 45.8◦Dip) during a period of intense geomagnetic storms, together with GPS TEC maps and Digisonde measurements. The observational results show that intensified scintillations are seen associated with the enhancement of the equatorial ionization anomaly (EIA) during the main phase of the geomagnetic storm. In addition, no scintillation is observed to be accompanied by the appearance of an Es layer during whole process of a ge-omagnetic storm. It seems that the existence of the Es layer inhibits the generation of spread-F. Current theories are used to interpret the observed results.
The paper is organized as follows. In Sect. 2, observa-tional methods and data are described. In Sect. 3, analyzed results are given. Discussion and conclusions are presented in Sect. 4.
2 Data resources
In September 2002, a modified GPS receiver for record-ing the amplitude and phase of the L1 signal was set up at Wuhan. The receiver is a NovAtel Euro4 dual-frequency re-ceiver version with OEM4 card and special firmware, which also yields the value of ionospheric TEC. The amplitude scintillation is monitored by computing the S4 index, which is the standard deviation of the received power normalized by its mean value. In our study, it is derived from the detrended received signal intensity. A fixed choice of a 0.1 Hz, 3 dB-cutoff frequency, for both phase and amplitude filtering, has been used here. A low phase noise, oven-controlled crys-tal oscillator performs the phase measurements by monitor-ing the standard deviation of the detrended carrier phase. Then phase scintillation (Phi-Sigma) is computed (Van et al., 1993). In all the cases in this paper, only the signals com-ing from satellites with an elevation angle greater than 30◦ and with a time of lock greater than 180 s were taken into ac-count. The virtual height of the F layer, h0F, the peak height of F layer, hmF2, the critical frequency of the F layer, foF2, and virtual height of the sporadic E layer, h0Es, are measured by Digisonde-256 at the Wuhan station.
GPS data for TEC maps are obtained from a GPS network in the China, Southeast Asia and Australia regions. Due to the fact that observations at lower elevation angles have passed through a longer path through the ionosphere than those at high elevation, the slant TEC values were approx-imated into the equivalent vertical TEC values by assuming a thin-shell ionosphere at 400 km. Then through the GPS network, a nearest interpolation (by setting the value of an interpolated point to the value of the nearest existing data point) was employed to yield a TEC variation along geo-graphical longitude 110◦E (LT≈UT+8), with a spatial res-olution of about 2.5◦. Thus, we obtained our TEC (Latitude versus UT) map (Zhao et al., 2005). The sampling interval of the TEC data for mapping is 30 min. The distribution of the GPS receivers is given in Fig. 1. Since vertical electron den-sity distribution is generally not constant along the ray path, it should be pointed out that the calculation of TEC is per-haps only a rough approximation. It has been estimated that TEC can be in error by 10–20% when an elevation-dependent scaling factor is used at low elevation angles (5–10◦), and in regions of significant TEC gradients (Klobuchar et al., 1993). But for studying large-scale TEC variation, especially under conditions of intense geomagnetic disturbance, this approxi-mation is enough for identifying common storm features (Ho et al., 1998). To show more clearly the TEC variation, we subtracted the 27-day smooth average value of TEC, and then obtained its relative deviation (RTEC):
RT EC(U T ) = T EC(U T ) − T EC(U T ) T EC(U T ) .
Geomagnetic storms are characterized by a prolonged de-pression of the horizontal component (H) of the Earth’s
G. Li et al.: Observations of ionospheric scintillations over Wuhan during storms 1583
10
Figure. 2a. Bz component of the interplanetary magnetic field in geocentric-solar-magnetospheric
(GSM) coordinates provided by the Advanced Composition Explorer (ACE) spacecraft (top panel, left) and Dst index (middle panel, left) obtained from CDAWeb and SPIDR; Phase scintillation index (Phi-Sigma, middle panel, left) and Amplitude scintillation index (S4, bottom panel, left) measured from all GPS satellite signals observed at Wuhan; F layer peak height (hmF2, top panel, right), F layer virtual height (h'F, middle panel, right), F layer critical frequency (foF2, middle panel, right) and sporadic E layer virtual height (h'Es, bottom panel, right) obtained from Digisonde measurements at Wuhan for the period 30 September – 2 October, 2002.
(a)
11
Figure. 2b. Latitudinal variation of TEC along geographic longitude 110
°E for 30 September (top
panel, left), 1 October (middle pane, left), 2 October (bottom panel, left), 2002, and RTEC along
geographic longitude 110
°E for 30 September (top panel, right), 1 October (middle pane, right), 2
October (bottom panel, right), 2002, show the
equatorial ionization anomaly
(EIA)
development.
(b)
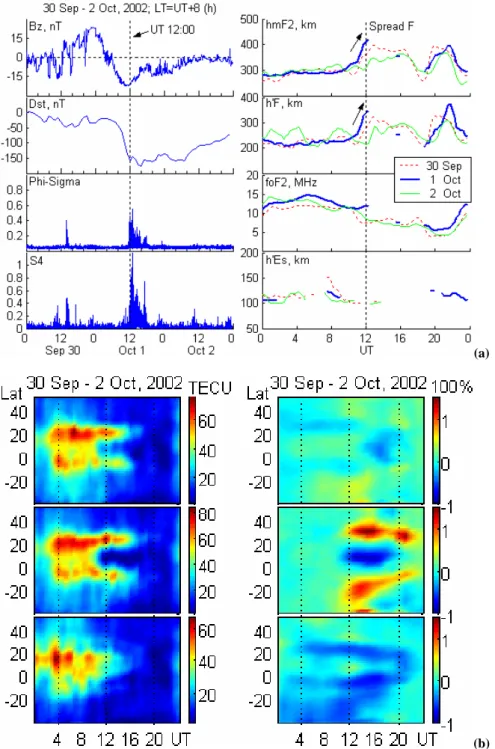
Fig. 2. (a) Bzcomponent of the interplanetary magnetic field in geocentric-solar-magnetospheric (GSM) coordinates provided by the Ad-vanced Composition Explorer (ACE) spacecraft (top panel, left) and Dst index (middle panel, left) obtained from CDAWeb and SPIDR; Phase scintillation index (Phi-Sigma, middle panel, left) and Amplitude scintillation index (S4, bottom panel, left) measured from all GPS satellite signals observed at Wuhan; F layer peak height (hmF2, top panel, right), F layer virtual height (h0F, middle panel, right), F layer critical frequency (foF2, middle panel, right) and sporadic E layer virtual height (h0Es, bottom panel, right) obtained from Digisonde mea-surements at Wuhan for the period 30 September–2 October 2002. (b) Latitudinal variation of TEC along geographic longitude 110◦E for 30 September (top panel, left), 1 October (middle pane, left), 2 October (bottom panel, left), 2002, and RTEC along geographic longi-tude 110◦E for 30 September (top panel, right), 1 October (middle pane, right), 2 October 2002 (bottom panel, right), show the equatorial ionization anomaly (EIA) development.
12
Figure. 3a. Bz component of IMF, Dst index, Phi-Sigma and S4 index; hmF2, h'F, foF2 and h'Es for the period 21 – 23 January, 2004.
(a)
13
Figure. 3b. Latitudinal variation of TEC (left) and RTEC (right) along geographic longitude
110
°E for 21 January (top panel), 22 January (middle panel) and 23 January (bottom panel), 2004,
show the
EIA
development.
(b)
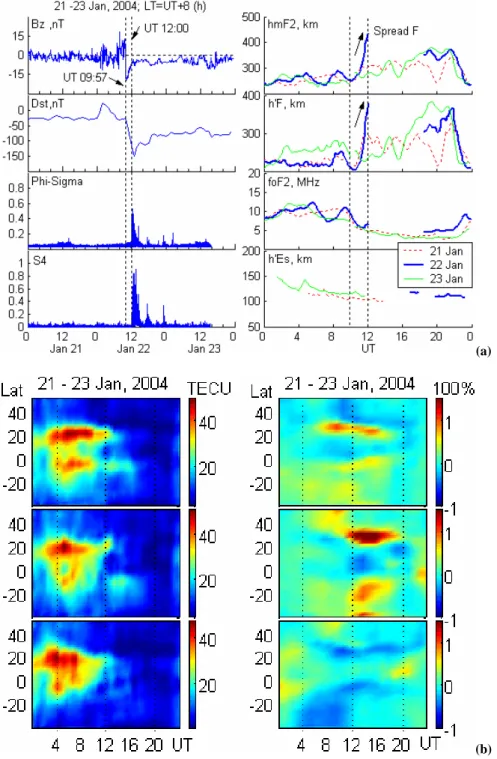
Fig. 3. (a) Bzcomponent of IMF, Dst index, Phi-Sigma and S4 index; hmF2, h0F, foF2 and h0Es for the period 21–23 January 2004. (b) Latitudinal variation of TEC (left) and RTEC (right) along geographic longitude 110◦E for 21 January (top panel), 22 January (middle panel) and 23 January 2004 (bottom panel), show the EIA development.
magnetic field. The depression in H is characterized by the geomagnetic index Dst which lies between –100 to –200 nT
for intense storms and less (–200) for very intense storms. The southward turning of the interplanetary magnetic field (IMF) Bz ensures the transportation of solar wind energy
into the Earth’s magnetosphere, which is the primary cause
for the formation of geomagnetic storms (Allen et al., 1989; Tsurutani et al., 1992; Gonzalez et al., 1999). The Dst
in-dex is obtained from the Space Physics Interactive Data Re-source and IMF Bzis obtained from Coordinated Data
Anal-ysis Web.
G. Li et al.: Observations of ionospheric scintillations over Wuhan during storms 1585
14
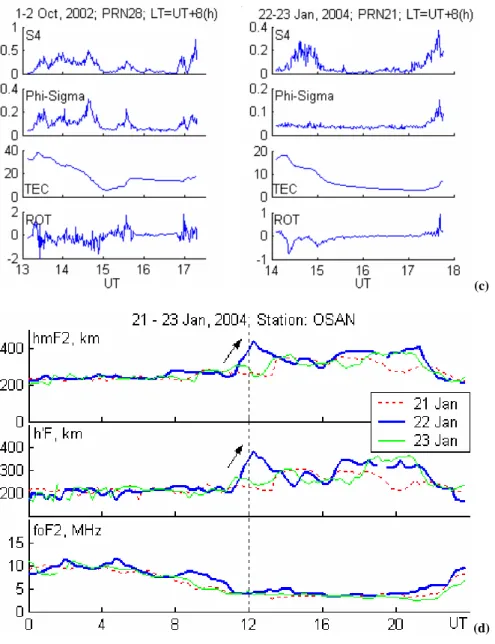
Figure. 3c. Plots at every 1-minute interval of (1) S4 index (2) Phi-Sigma index (3) TEC (4) rate of TEC (ROT) for PRN 28 on 1 – 2 October, 2002 and PRN 21 on 22 – 23 January, 2004.
(c)
15
Figure. 3d. Increases in hmF2 and h
'F observed at OSAN (37.1
°N,
127.0
°E
) on 22 January,
2004 provide an evidence of uplift of F layer (Data obtained from SAO database).
(d)
Fig. 3. Continued. (c) Plots at every 1-min interval of (1) S4 index (2) Phi-Sigma index (3) TEC (4) rate of TEC (ROT) for PRN 28 on 1–2 October, 2002 and PRN 21 on 22–23 January 2004. (d) Increases in hmF2 and h0F observed at OSAN (37.1◦N, 127.0◦E) on 22 January 2004 provide evidence of the rise in the F layer (Data obtained from SAO database).
3 Results
3.1 Storm 1 and 2: 1 October 2002 and 22 January 2004 Here we combine the scintillations of two similar events in constructing a picture of the prompt effects associated with magnetospheric disturbances on a low-middle latitude. In Fig. 2a, the left four panels show the Bz component of
IMF, Dst, phase and amplitude scintillation indices; hmF2,
h0F, foF2 and h0Es are presented in the right four panels for 30 September–2 October 2002. Figure 3a shows the same parameters for 20–22 January 2004. Both events are marked by major negative IMF Bz and a post-sunset steep height
increase of h0F and hmF2. The uplifting of F layer results
in spread F and hence intense amplitude and phase scintilla-tions.
The enhancement of EIA over the longitude 110◦E is
ob-served during each event. As shown in Figs. 2b and 3b, in comparing the 3 days, a clear EIA enhancement is seen at about 10:00 UT during the two storms, and the EIA en-hancement of storm 1 and 2 extending to about 22:00 and 18:30 UT respectively relative to the quiet day. This behav-ior is likely associated with the intensification of the foun-tain effect, due to the penetration of an eastward electric field into the equatorial ionosphere, which forced a large amount of plasma to be uplifted at the magnetic equator and
subsequently diffused along the magnetic field line toward higher latitudes. For both events, Digisonde station at Wuhan registered a very significant increase of hmF2 and h0F,
fol-lowed by the occurrence of strong spread F (seen as dif-fuse F-region traces in ionograms). On 22 January 2004, Digisonde station at OSAN (37.1◦N, 127.0◦E) simultane-ously observed the same increase (Fig. 3d) in hmF2 and h0F. Figure 3c presents the results for PRN 28 on 1 October 2002 and PRN 21 on 22 January 2004. A close comparison of S4, TEC and ROT (rate of change of TEC per minute, Pi et al., 1997; Basu et al., 1999) for single PRN indicates that the enhanced scintillation structures correspond well with fluctuations of ROT. From Fig. 3c we can find that at post-midnight, moderate scintillations still exist with TEC fluctu-ations.
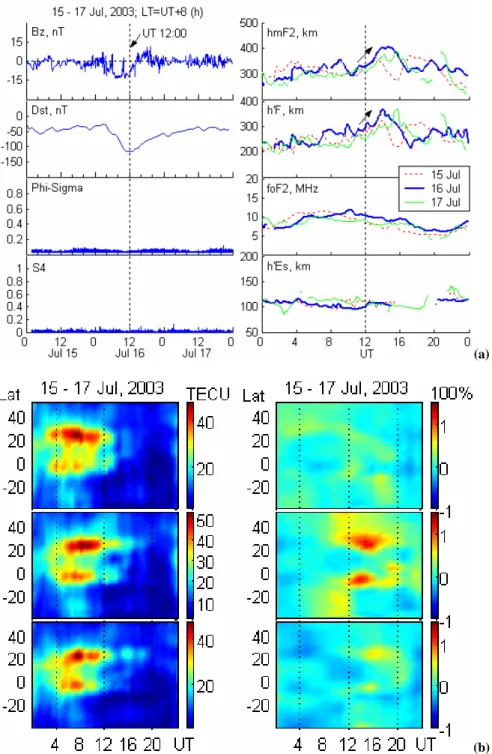
3.2 Storm 3 and 4: 16 July and 20 November 2003 In comparison to intense scintillation activity during storms 1 and 2, no scintillation was observed during the storms oc-curred on 16 July 2003 and 20 November 2003. Figures 4 and 5 show IMF Bz, Dst, Phi-Sigma, S4, hmF2, h0F, foF2,
h0Es indices and TEC maps for the two events, respectively. As shown in Fig. 4a, during storm 3, it is evident that as time advances, IMF Bzturned southward at around 02:00 UT
on 16 July 2003. Except for several northward excursions, it remained negative for several hours. Dst reached its
maxi-mum –117 nT at 12:00 UT on 16 July. Comparing the 3 days, Fig. 4b shows that the EIA began to intensify at 10:00 UT and this lasted until 18:00 UT during the storm day, similar to storms 1 and 2. But measurements of hmF2 and h0F show a weak increase which started at 10:20 UT and finished at 17:00 UT, and the sporadic E layer (h0Es) was present when the F layer rose. The weak increase of the F layer was proba-bly caused by a storm-induced enhancement of the eastward electric field, but the increase was not apparent; this is pre-sumably the reason why the concurrent existence of the Es layer inhibited the upward plasma drift.
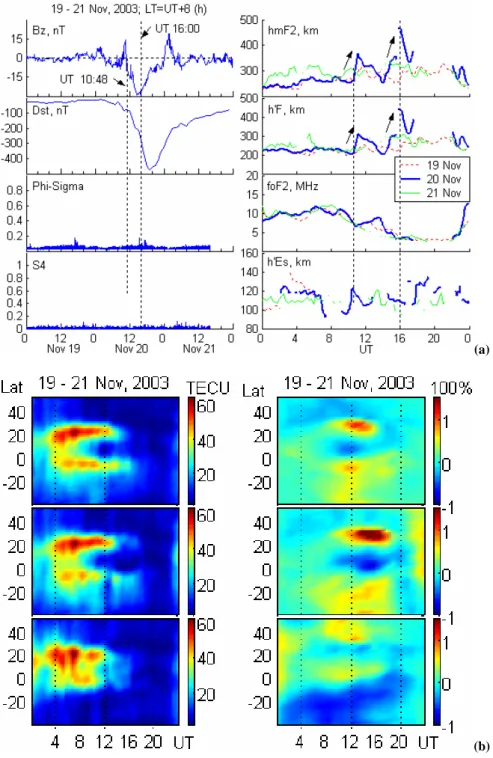
For storm 4, Fig. 5a illustrates that IMF Bz turned
southward at 02:20 UT on 20 November 2003, and then turned northward at 10:00 UT on 20. After approximately 50 min, IMF Bz became further southward at 10:48 UT on
20 November, and remained negative until 00:10 UT on 21 November. Dst became much depressed and reached its
maximum at –472 nT at 19:00 UT on 20 November. The EIA is also shownto be enhanced at around 11:00 UT on 20 November and this ended at about 17:00 UT on 20 November (Fig. 5b). hmF2 and h0F show two large incre-ments during 11:00–14:00 UT and 14:00–17:00 UT, respec-tively. It is likely that an eastward penetration electric field to the first elevation of the F layer when IMF Bzturned
south-ward, and the second elevation which during the midnight sector could be the result of a disturbance dynamo electric field (Blanc and Richmond, 1980; Fejer and Emmert, 2003).
The sporadic E layer (h0Es) also exists when the F layer rose
during storm 4.
For these two events, the EIA intensification can be likely seen during the storm day as storms 1 and 2. The height variation of the F layer is not apparent relative to the adja-cent 2 days for storm 3. For storm 4, hmF2 and h0F show two increments. But the scintillation activity was essentially dormant. The S4 index and phase scintillation index (Phi-Sigma) rarely exceed 0.1. The reason is presumably that the existence of the Es layer in the post-sunset inhibits the up-ward plasma drift and leads to a significant suppression of spread F.
4 Discussions and conclusions
Some excellent work on ionospheric scintillations during storms has been published. Dabas et al. (1989), Aarons et al. (1991, 1997) found that Dstvariations are the best criteria
to determine the development of the equatorial irregularities. Numerous works present the experimental and theoretical re-lations between the solar wind parameters and the auroral ionosphere. The studies of Zmuda and Armstrong (1974), Iigima and Potemra (1978), Foster et al. (1989) and other authors concluded that the field-aligned currents (FAC) con-stitute a major interconnection between the magnetosphere and the polar ionosphere. In theory, Zakharov et al. (1989), Denisenko and Zamai (1992) had shown that the electric fields from the FAC could penetrate to the equatorial iono-sphere and explain the equatorial electric field variations, as well as Kikuchi et al. (1996), Sizova (2002), using geo-magnetic data, and Sizova and Pudovkin (2000), using iono-spheric data had proved the penetration. According to the model of Sizova and Pudovkin (2000), electric fields of the field-aligned currents penetrate through the mid-latitude to the low-latitude ionosphere and create the additional equa-torial electric fields. Under the additional eastward electric field, the height of the F region rises high enough where scin-tillation irregularities can be generated.
Although the virtual height of the F layer h0F observa-tions does not differentiate between the effects of an eastward electric field or of an equatorward surge of the neutral wind, Tanaka (1986) once analyzed the storm-time ionospheric re-sponse and provided criteria for differentiating between the effects of electric fields and winds. The equatorial anomalies are created as an eastward electric field uplifts the equatorial ionosphere, which subsequently diffuses down the magnetic field to produce density enhancements at somewhat higher latitudes. The response to winds propagating equatorward from a high-latitude disturbance, however, is characterized by increases in h0F which travel from north to south with noticeable time dispersions and no change in foF2 or TEC. From storms 1 to 4, significant changes in TEC, as well as an enhancement of the EIA were observed. These provide
G. Li et al.: Observations of ionospheric scintillations over Wuhan during storms 1587
16
Figure. 4a. Bz component of IMF, Dst index, Phi-Sigma and S4 index; hmF2, h'F, foF2 and h'Es for the period 15 – 17 July, 2003.
(a)
17
Figure. 4b. Latitudinal variation of TEC (left) and RTEC (right) along geographic longitude
110
°E for 15 July (top panel), 16 July (middle panel) and 17 July (bottom panel), 2003, show the
EIA
development.
(b)
Fig. 4. (a) Bz component of IMF, Dst index, Phi-Sigma and S4 index; hmF2, h0F, foF2 and h0Es for the period 15–17 July, 2003. (b) Latitudinal variation of TEC (left) and RTEC (right) along geographic longitude 110◦E for 15 July (top panel), 16 July (middle panel) and 17 July (bottom panel), 2003, show the EIA development.
evidences of a concentration of a storm-enhanced eastward electric field.
As we can see from Bz, Dst, Phi-Sigma, S4, hmF2, h0F
and h0Es dynamics presented in Figs. 2a–5a, the events of 16 July 2003 and 20 November 2003 did not exhibit any strong spread F or scintillation activity, while the events of
1 October 2002 and 22 January 2004 demonstrated the in-tense scintillation signatures associated with the presence of the spread F; it appears that the existence of the sporadic E layer has significant suppression effect on spread F and in-hibits the process required for the growth of plasma irreg-ularities. The modulation of the ESF occurrence by the Es
18
Figure. 5a. Bz component of IMF, Dst index, Phi-Sigma and S4 index; hmF2, h'F, foF2 and h'Es for the period 19 – 21 November, 2003.
(a)
19
Figure. 5b. Latitudinal variation of TEC (left) and RTEC (right) along geographic longitude
110
°E for 19 November (top panel), 20 November (middle panel) and 21 November (bottom
panel), 2003, show the
EIA
development.
(b)
Fig. 5. (a) Bzcomponent of IMF, Dst index, Phi-Sigma and S4 index; hmF2, h0F, foF2 and h0Es for the period 19–21 November 2003. (b) Latitudinal variation of TEC (left) and RTEC (right) along geographic longitude 110◦E for 19 November (top panel), 20 November (middle panel) and 21 November (bottom panel), 2003, show the EIA development.
layer was first proposed by Tsunoda (see Sultan, 1996); when a sporadic E layer develops, its contribution to the Peder-sen conductivity may also become significant. Stephan et al. (2002) showed that the Es layer can change the Pedersen conductivity ratio and thus the growth rate of the gravita-tional Rayleigh–Taylor instability (GRT); the magnitude of
the change is dependent on the plasma densities, as well as the height and time of Es layer occurrence.
By using GPS ionospheric scintillations, TEC measure-ments and Digisonde data to investigate the responses of the ionosphere to the geomagnetic storms of 1 October 2002, 16 July 2003, 20 November 2003, and 22 January 2004, we
G. Li et al.: Observations of ionospheric scintillations over Wuhan during storms 1589 observed a prompt uplifting of the ionospheric F layer at
low-middle latitude, related to the occurrence of the eastward penetration electric field or the disturbance dynamo elec-tric field during storms. Intense scintillation occurred and even extended up to post-midnight with the co-existence of large- and small-scale irregularities during 1 October 2002 and 22 January 2004. It is proposed that an enhancement of the eastward electric field may intensify the upward drift of plasma, followed by transport to higher latitude. Then the irregularities associated with spread F can be generated, and ionospheric scintillations can be observed there. But for the storm on 16 July 2003 the uplifting of the ionospheric F layer was not apparent relative to the adjacent 2 days; for the storm on 20 November 2003, hmF2 and h0F show two increments. Both of them did not generate spread F and to scintillations. The reason is probably that the sporadic E layer played a role in the generation of the ionospheric scintillation by changing the Pederson conductivity ratio and suppressing the upward plasma drift, thus reducing the growth rate of the irregulari-ties associated with spread-F. Also, we should point out that there may be other reasons for example, the eastward electric field perturbation is not strong enough to elevate the F layer enough. The relationship between the Es layer and spread F is perhaps one of the keys to predicting ionospheric scintil-lation during a period of intense geomagnetic activity. This needs to be further studied and more detail investigations are required.
Acknowledgements. The authors acknowledge IGS for providing the GPS data in the web site. The authors also express their thanks to the CDAWeb for providing ACE satellite data. The Dstdata were obtained from SPIDR. The ionospheric Digisonde data at OSAN were obtained from SAO database. This research was supported by National Natural Science Foundation of China (40574072) and the KIP Pilot Project (KZCX3-SW-144) of Chinese Academy and Sci-nences.
Topical Editor M. Pinnock thanks X. Pi and another referee for their help in evaluating this paper.
References
Aarons, J.: The role of the ring current in the generation or inhibi-tion of equatorial F-layer irregularities during magnetic storms, Radio Sci., 26, 1131–1149, 1991.
Aarons, J., Mendillo, M., and Yantonsca, R.: GPS phase fluctu-ations in the equatorial region during sunspot minimum, Radio Sci., 32, 1535–1550, 1997.
Allen, J., Frank, L., Sauer, H., and Reiff, P.: Effects of the March, 1989 solar activity. EOS. Transactions, AGU 70, 1479–1488, 1989.
Basu, Su., Basu, S., Eastes, R., Huffman, R. E., Daniell, E., Chaturvedi, P. K., Valladares, C. E., and Livingston, R. C.: Re-mote sensing of auroral E-region plasma structures by radio, radar, and UV techniques at solar minimum, J. Geophys. Res., 98 (2), 1589–1602, 1993.
Basu, S., Groves, K. M., Quinn, J. M., and Doherty, P.: A compari-son of TEC fluctuations and scintillations at Ascension Island, J. Atmos. Terr. Phys., 61, 1219–1226, 1999.
Basu, Su., Basu, S., Makela, J. J., Sheehan, R. E., MacKenzie, E., Doherty, P., Wright, J. W., Keskinen, M. J., Pallamraju, D., Pax-ton, L. J., and Berkey, F. T.: Two components of ionospheric plasma structuring at mid latitudes observed during the large magnetic storm of October 30, 2003, Geohpys. Res. Lett., 32, L12S06, doi:10.1029/2004GL021669, 2005.
Blanc, M. and Richmond, A. D.: The ionospheric disturbance dy-namo, J. Geophys. Res., 85 (A4), 1669–1686, 1980.
Cosgrove, R. B. and Tsunoda, R. T.: Polarization electric fields sus-tained by closed-current dynamo structures in midlatitude spo-radic E, Geophys. Res. Lett., 28, 1455–1458, 2001.
Cosgrove, R. B. and Tsunoda, R. T.: Wind-shear-driven, closed current dynamos in midlatitude sporadic E, Geophys. Res. Lett., 29(2), 1020, doi:10.1029/2001GL013697, 2002a.
Cosgrove, R. B. and Tsunoda, R. T.: A direction-dependent instabil-ity of sporadic-E layers in the nighttime midlatitude ionosphere, Geophys. Res. Lett., 29(18), 1864, doi:10.1029/2002GL014669, 2002b.
Cosgrove, R. B. and Tsunoda, R. T.: Simulation of the nonlin-ear evolution of the sporadic-E layer instability in the night-time midlatitude ionosphere, J. Geophys. Res., 108(A7), 1283, doi:10.1029/2002JA009728, 2003.
Cosgrove, R. B. and Tsunoda, R. T.: Instability of the E-F cou-pled nighttime midlatitude ionosphere, J. Geophys. Res., 109, A04305, doi:10.1029/2003JA010243, 2004.
Cosgrove, R. B., Tsunoda, R. T., Fukao, S., and Yamamoto, M.: Coupling of the Perkins instability and the sporadic E layer in-stability derived from Physical arguments, J. Geophys. Res., 109, A06301, doi:10.1029/2003JA010295, 2004.
Dabas, R. S., Lakshmi, D. R., and Reddy, B. M.: Effect of geo-magnetic disturbances on VHF nighttime scintillation activity at equatorial and low latitudes, Radio Sci., 4, 563–573, 1989. Denisenko, V. V. and Zamay, S. S.: Electric fields in the equatorial
ionosphere, Planet. Space Sci., 40, 941–952, 1992.
Fejer, B. G.: Low-latitude ionospheric disturbance electric field effects during the recovery phase of the 19–21 October 1998 magnetic storm. J. Geophys. Res., 108 (A12), 1454, doi:10.1029/2003JA010190, 2003.
Foster, J. C., Fuller-Rowell, T., and Evans, D. S.: Quantitative patterns of large-scale field-aligned currents in the auroral iono-sphere, J. Geophys. Res., 94, 2555–2564, 1989.
Foster, J. C., Erickson, P. J., Coster, A. J., Goldstein, J., and Rich, F. J.: Ionospheric signatures of plasmaspheric tails, Geophys. Res. Lett., 29(13), 1623, doi:10.1029/2002GL015067, 2002. Foster, J. C. and Rideout, W.: Midlatitude TEC enhancements
during the October 2003 superstorm, Geophys. Res. Lett., 32, L12S04, doi:10.1029/2004GL021719, 2005.
Gonzalez, W. D., Tsurutani, T. B., and Gonzalez, A. C.: Interplane-tary origin of geomagnetic storms, Space Sci. Rev., 88, 529–562, 1999.
Haldoupis, C., Schlegel, K., and Farley, D. T.: An explanation for Type 1 radar echoes from the midlatitude E region ionosphere, Geophys. Res. Lett., 23(1), 97–100, 1996.
Hamza, A. M.: Perkins instability revisited, J. Geophys. Res., 104(10), 22567–22575, 1999.
Ho, C. M., Mannucci, A. J., Sparks, L., Pi, X., Lindqwister, U. J.,
Wilson, B. D., Iijima, B. A., and Reyes, M. J.: Ionospheric total electron content perturbations monitored by the GPS global net-work during two northern hemisphere winter storms, J. Geophys. Res., 103, A11, 26 409–26 420, 1998.
Iigima, T. and Potemra, T. A.: Large-scale characteristics of the field-aligned currents associated with substorms, J. Geophys. Res., 83, 599–615, 1978.
Kikuchi, T., Luehr, H., Kitamura, T., Saka, O., and Schlegel, K.: Direct penetration of the polar electric field to the equator dur-ing a DP event as detected by the auroral and equatorial mag-netometer chains and the EISCAT radar, J. Geophys. Res., 101, 17 161–17 173, 1996.
Klobuchar, J. A., Basu, S., and Doherty, P.: Potential limitations in making absolute ionospheric measurements using dual frequency radio waves from GPS satellites, in Proceedings of the Seventh International Ionospheric Effects Symposium, edited by: Good-man, J., SRI International, Arlington, Va., 187, 1993.
Ledvina, B. M., Makela, J. J., and Kintner, P. M.: First observa-tions of intense GPS L1 amplitude scintillaobserva-tions at midlatitude, Geophys. Res. Lett., 29(14), 1659, doi:10.1029/2002GL014770, 2002.
Perkins, F.: Spread F and ionospheric currents, J. Geophys. Res., 78, 218–226, 1973.
Pi, X., Mannucci, A. J., Lindqwister, U. J., and Ho, C. M.: Monitor-ing of global ionospheric irregularities usMonitor-ing the worldwide GPS network, Geophys. Res. Lett., 24(18), 2283–2286, 1997. Sizova, L. Z. and Pudovkin, M. I.: Disturbances of the daytime
equatorial ionosphere associated with the Bz-component of inter-planetary magnetic field, Geomagn. Aeron., 40, 246–249, 2000. Sizova, L. Z.: The field-aligned currents effect on the equatorial geomagnetic field variations, Adv. Space. Res., 30, 2247–2252, 2002.
Stephan, A.W., Colerico, M., Mendillo, M., Reinisch, B. W., and Anderson, D.: Suppression of equatorial spread F by sporadic E, J. Geophys. Res., 107(A2), 1021, doi:10.1029/2001JA000162, 2002.
Sultan, P. J.: Linear theory and modeling of the Rayleigh-Taylor in-stability leading to the occurrence of equatorial spread F, J. Geo-phys. Res., 101, 26, 875–891, 1996.
Tanaka, T.: Low-latitude ionospheric disturbances: results for March 22, 1979, and their general characteristics, Geophys. Res. Lett., 13, 1399–1402, 1986.
Tsunoda, R.: On polarized frontal structures, type-1 and quasi-periodic echoes in midlatitude sporadic E, Geophys. Res. Lett., 25(14), 2614–2644, 1998.
Tsunoda, R. T. and Cosgrove, R. B.: Coupled electrodynamics in the nighttime midlatitude ionosphere, Geophys. Res. Lett., 28(22), 4171–4174, 2001.
Tsurutani, B. T., Gonzalez, W. D., Tang, F., and Lee, Y. T.: Great magnetic storms, Geophys. Res. Lett., 19, 73–76, 1992. Van Dierendonck, A. J., Hua, Q., and Klobuchar, J.: Ionospheric
scintillation monitoring using commercial single frequency C/A code receivers, Proceedings of ION GPS 93, Salt Lake City, UT, 22–24 September, 1333–1342, 1993.
Yeh, K. C. and Liu, C. H.: Radio wave scintillations in the iono-sphere, Proc. IEEE, 70 (4), 324–360, 1982.
Zhao, B., Wan, W., and Liu, L.: Responses of equatorial anomaly to the October–November 2003 superstorms, Ann. Geophys., 23, 693–706, 2005.
Zmuda, A. J. and Armstrong, J. S.: The diurnal variation of the region of vector magnetic field changes associated with field-aligned currents, J. Geophys. Res., 79, 2501–2502, 1974.