HAL Id: hal-00296921
https://hal.archives-ouvertes.fr/hal-00296921
Submitted on 14 Mar 2006
HAL is a multi-disciplinary open access
archive for the deposit and dissemination of
sci-entific research documents, whether they are
pub-lished or not. The documents may come from
teaching and research institutions in France or
abroad, or from public or private research centers.
L’archive ouverte pluridisciplinaire HAL, est
destinée au dépôt et à la diffusion de documents
scientifiques de niveau recherche, publiés ou non,
émanant des établissements d’enseignement et de
recherche français ou étrangers, des laboratoires
publics ou privés.
Impact of the assimilation of conventional data on the
quantitative precipitation forecasts in the Eastern
Mediterranean
N. Mazarakis, V. Kotroni, K. Lagouvardos, S. Music, S. Nickovic
To cite this version:
N. Mazarakis, V. Kotroni, K. Lagouvardos, S. Music, S. Nickovic. Impact of the assimilation of
conventional data on the quantitative precipitation forecasts in the Eastern Mediterranean. Advances
in Geosciences, European Geosciences Union, 2006, 7, pp.237-242. �hal-00296921�
SRef-ID: 1680-7359/adgeo/2006-7-237 European Geosciences Union
© 2006 Author(s). This work is licensed under a Creative Commons License.
Advances in
Geosciences
Impact of the assimilation of conventional data on the quantitative
precipitation forecasts in the Eastern Mediterranean
N. Mazarakis1, V. Kotroni1, K. Lagouvardos1, S. Music2, and S. Nickovic2,*
1National Observatory of Athens, Institute of Environmental Research and Sustainable Development, Athens, Greece 2Euro-Mediterranean Centre on Insular Coastal Dynamics, University of Malta, Valletta, Malta
*now at: World Meteorological Organization, Geneva, Switzerland
Received: 22 November 2005 – Revised: 6 January 2006 – Accepted: 10 January 2006 – Published: 14 March 2006
Abstract. This study is devoted to the evaluation of the role
of assimilation of conventional data on the quantitative pre-cipitation forecasts at regional scale. The conventional data included surface station reports as well as upper air observa-tions. The analysis was based on the simulation of 15 cases of heavy precipitation that occurred in the Eastern Mediter-ranean. The verification procedure revealed that the inges-tion of conveninges-tional data by objective analysis in the initial conditions of BOLAM limited area model do not result in a statistically significant improvement of the quantitative pre-cipitation forecasts.
1 Introduction
In the frame of this study, an objective analysis scheme has been applied to assimilate conventional data into the ini-tial conditions used by a limited area model. The scheme is based on the Bratseth method of successive corrections (Bratseth, 1986) that converges toward the solution obtained by optimum interpolation method. This method has several advantages. It is a physically sound method that can be eas-ily applied and it is computationally not expensive. This technique applies correlation functions for the forecast er-rors to derive weights, which depend on the distances be-tween observations and model grid points. After a number of iterations of the scheme, the length scale of the correlation functions is further reduced for subsequent iterations in order to speed up the convergence of the scheme towards smaller scales.
The conventional data used in this study include surface station data as well as rawinsondes from the synoptic net-work. The location of both surface and upper air stations used for the data assimilation is fiven in Fig. 1. The Global
Correspondence to: N. Mazarakis
(nickmaz@meteo.noa.gr)
Forecast System (GFS/NCEP) analysis fields are used as background fields (1st guess) into which the observations are assimilated. The resulting new analyses are used as initial conditions for BOLAM hydrostatic model. This model is then used to produce high resolution weather forecasts over Greece and part of the surrounding countries.
The impact of the data assimilation is evaluated for fif-teen cases of heavy and widespread precipitation that oc-curred over Greece in the period 2002–2003. For each case both the control simulations (without any assimilation) and those were data assimilation has been applied, are used for the verification of the quantitative precipitation forecasts over Greece, part of Southern Bulgaria and West Turkey.
2 The successive correction method
The successive correction method is based on the application of two iterative equations that give estimates of the variables at both the grid points (Eq. 1) and the observation points (Eq. 2): fin+1=fin+ nobs P k=1 wikn(fk0−fkn) nobs P K=1 wnik+σ2 n (1) fjn+1=fjn+ nobs P K=1 (wnik+ε2δkj)(fk0−fkn) nobs P K=1 wikn +σ2 n (2)
Here f is a model variable, n is the iteration counter, and i refers to grid points and k, j refer to observational points. The analysis is initialized with the background field, so fi0=fibwhere fibis the background field evaluated at the
238 N. Mazarakis et al.: Impact of the assimilation of conventional data
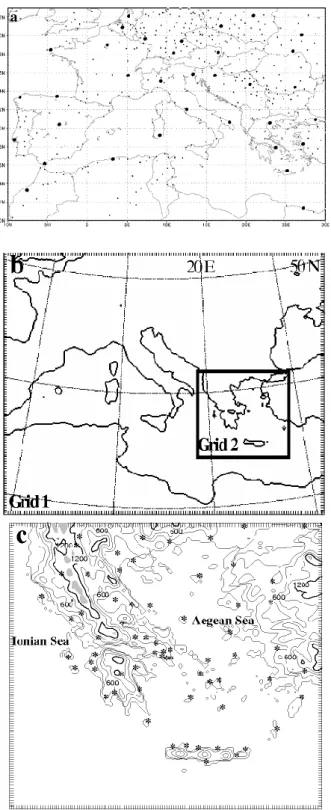
Fig. 1. (a) Location of the surface and upper-air stations (denoted
by small and large dots respectively) used in the assimilation pro-cedure; (b) Horizontal extension of BOLAM coarse (Grid 1) and fine (Grid 2) grids. The rectangle denotes the position of the fine grid. (c) Orography of the fine grid. Elevation contours are given at 300 m interval, bold line denotes the 1200 m elevation contour and gray shading the heights exceeding 1500 m. Stars denote the position of the rain-gauges.
ith grid point, and fi0the corresponding zeroth iteration es-timate. Then the gridded field is modified by the analysis of local data into the model grid. In Eq. (1) fin is the nth iteration estimation at the grid point i, fk0is the kth obser-vation, fkn is the value of the nth field estimate evaluated at the observational point k (obtained by interpolation from the surrounding grid points), wikn is the weight and σn2is the squared ratio of observation to background error, while nobs
is the number of observations within a distance R from the grid point i.
The analysis is also performed at the observational points, following Eq. (2), which allows additional interpolation to be avoided. The analysis values at the observational points are obtained by a bilinear interpolation. In Eq. (2), fjnis the
nth iteration estimation at the observational point j and δkj
is the Kronecker delta which is zero unless k=j . For the initial iteration fj0equals the background value interpolated to the observational point. This step results in convergence to optimal interpolation due to inclusion of error statistics in the Bratseth weights. The solution will converge if sufficient iterations over the grid are performed.
The Bratseth weights are assumed to be Gaussian func-tions that tend to zero with increasing observation distance from the analysis point:
wnik =e −r2ik
2R2nβ(p
i, pj)
where rik2 is the squared distance between the observation point k and the grid point i, β(pi, pj)is the vertical
corre-lation between pressure levels pi and pj. The radii of
in-fluence R are changed by a constant factor at each iteration:
Rn+2 1=γ R2n. The analysis is made in two scans. For the first scan, γ =1, with which only the large scales are captured. In the second scan, some iterations are made with γ <1 as an at-tempt to resolve smaller scale systems in the assimilation. In areas where the analysis converges after the first scan, there will be no corrections in the second scan. The advantage of the SCM is that it includes error statistics that provide a blend between the observation and background error. For relatively small observation error and large background error, the anal-ysis will tend to converge toward the observations and for relatively large observation errors, the background field will be weighted more heavily.
Within an iteration the influence of each observation on the surrounding grid points is calculated, and thus the computa-tional time is proporcomputa-tional to the number of observations. To reach a result close to the optimal result 5–10 iterations are usually needed to reach a result close to the optimal one when observations represent the scale of the analysis. Slower con-vergence may be found in areas where the observations are close, when there are large differences between the observa-tions and the error statistics. These differences have to be reduced either by modifying their statistical properties. The observations that are too incompatible with their neighboring ones have to be rejected.
The SCM represents a simple tool to perform objective analysis that is fast, flexible and computationally inexpen-sive.
3 Model set-up
The numerical simulations performed in the frame of this study were made using BOLAM hydrostatic model. The most recent version of BOLAM is based on previous versions of the model described in detail by Buzzi et al. (1994, 1997, 1998), Buzzi and Foschini (2000). Since precipitation is the parameter that is verified in this paper, some information on the way the model treats resolved and parameterized precip-itation is given in the following. Namely, the microphysical scheme implemented in BOLAM is coded mainly on the ba-sis of the transformation process models described in Schultz (1995). The scheme includes five hydrometeor categories: cloud ice, cloud water, rain, snow, and graupel. The sub-grid scale precipitation is treated in BOLAM following the Kain-Fritsch convective parameterization scheme (Kain and Fritsch, 1993). In the version of Kain-Fritsch scheme im-plemented in BOLAM, an additional modification, regarding the delaying of downdraft occurrence (Spencer and Stensrud, 1998) has been introduced. Namely, the first downdraft is de-layed by about 30 min from the onset of new convection.
BOLAM model is used for operational weather forecast-ing at the National Observatory of Athens (NOA) since 1999. A recent evaluation of these operational forecasts in the Mediterranean region is given in Lagouvardos et al. (2003) with very encouraging results concerning mainly precipita-tion forecasts. The operaprecipita-tional model chain at NOA includes two one-way nested grids:
– The coarse grid consists of 135×110 points with a 0.21 deg horizontal grid interval (∼23 km) centred at 41◦N latitude and 15◦E longitudes, covering the area of the Mediterranean and Southern Europe (Fig. 1a).
– The fine grid consists of 140×128 points with a 0.06 deg horizontal grid interval (∼6.5 km), centred at 38◦N latitude and 24◦E longitude (approximately the position of Athens). The fine grid covers the Greek peninsula with its maritime areas expanding from the Ionian Sea in the west up to the Turkish coasts in the east (Fig. 1b). In the vertical, 30 sigma-levels are used in the coarse grid and 40 in the fine grid, while the model top has been set at about 10 hPa on both grids. The vertical resolution is higher in the boundary layer, and becomes coarser from the top of the boundary later up to the model top.
The GFS/NCEP gridded analysis fields and 6 h interval forecasts, at 1.25 deg lat/lon horizontal grid increment, are used to initialise the model and to nudge the boundaries of the coarse grid during the simulation period. The orography fields are derived from a 30 resolution terrain data file pro-vided by USGS.
The operational runs are initialised every day with the 00:00 UTC GFS analysis. The duration of the simulation is
72 h for the coarse grid, and 66 h for the inner grid starting at 06:00 UTC of the same day. In the following, the opera-tional runs are referred to as OPER while the corresponding forecasts with assimilation of conventional data (surface and upper air observations) as ASSIM.
4 Statistical evaluation of precipitation forecasts
The statistical verification of precipitation fields is based on the calculation of the following statistical measures:
– the area bias B, defined as: B = F
O
where F is the number of stations for which the model pre-dicted precipitation amount exceeded a certain threshold and
Ois the number of stations that recorded at least the selected threshold.
– the threat score T S, defined as:
T S = CF
F + O − CF
where CF is the number of stations where the rainfall from model forecast is equal to the observed one (Correct Fore-cast). A threat score equal to 1 is a perfect result, while 0 is the lowest possible value.
– the equitable threat score ET S, defined as:
ET S = CF − R
F + O − CF − R
where R is a random forecast defined as the product of F and
O, divided by the total number N of verified stations:
R = F O N
The ET S is equivalent to T S with a correction to remove the bias from random hits.
It is noted that both threat scores (T S and ET S) are pro-vided in order to ease the comparison with previous pub-lished studies on precipitation verification. These statistical measures are used extensively for evaluation of model fore-casts of precipitation (e.g. Mesinger et al., 1990; Mesinger, 1996; Belair et al., 2000; Lagouvardos et al., 2003). In the framework of this study, bias and equitable threat scores are calculated for six distinct threshold values of precipitation: 0.1, 1, 2.5, 5, 10 and 20 mm.
The verification of accumulated precipitation has been per-formed for two 24-h periods, one from t+06 to t+30 forecast hours and the second from t+18 to t+42 forecast hours, for fifteen cases of widespread precipitation over Greece during the winter period of 2002 and 2003. In all cases the observed precipitation is verified against both the coarse and the fine grid forecasted precipitation provided by both experiments
240 N. Mazarakis et al.: Impact of the assimilation of conventional data
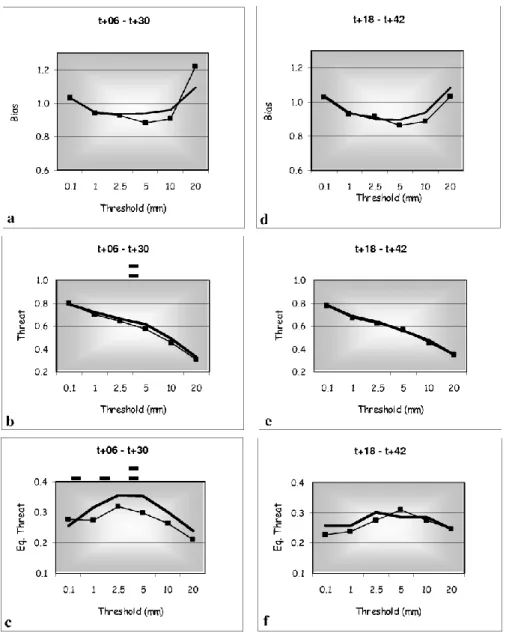
Fig. 2. (a) Bias scores for various precipitation thresholds (in mm) for the first verification period (t+06 to t+30) of BOLAM fine grid,
averaged over the fifteen analysed cases. The bold solid line denotes results of the OPER simulations and the thin line with solid rectangles the results of the ASSIM simulations. Single bar on the top of the graph denotes a statistically significant improvement at 90% and double bar at 95% confidence level for the ASSIM experiment. (b) As in (a), except for the threat score. (c) As in (a), except for the equitable threat score (d) As in (a), except for the second verification period (t+18 to t+42) (e) As in (d), except for the threat score (f) As in (d), except for the equitable threat score.
(OPER and ASSIM). Statistical significance of the differ-ences of the results from the two experiments is tested with a paired t-test. For the verification procedure the model pre-cipitation at the four closest points to each rain-gauge site are averaged, weighted by the inverse of their squares distance from the rain-gauge. On average 70 rain-gauge stations are used for each rain event. The average number of observations per event is 51 for the 0.1 mm threshold, 45 for the 1 mm, 39 for the 2.5 mm, 34 for the 5 mm, 24 for the 10 mm and 12 for the >20 mm threshold.
Figure 2 presents the results of the verification statistics, averaged over the fifteen cases analysed in this study for the
fine grid model forecasts and for the two 24-h periods (ac-cumulated precipitation from t+06 to t+30 in Figs. 2a–c and from t+18 to t+42 in Figs. 2d–f). Inspection of these figures leads to the following remarks:
1. BIAS score for both experiments in the lowest (0.1 mm) and high threshold (20 mm) is larger than the perfect score 1 (Figs. 2a, d). It shows a model tendency to over-estimate the very light and the large precipitation. For the medium precipitation amounts the OPER curve is closer to 1 than ASSIM but this difference is not statis-tically significant.
Fig. 3. 24-h accumulated precipitation ending at 18:00 UTC 19
Oc-tober 2003 as measured by the rain gauge network.
2. The THREAT score values (Figs. 2b, e) are very close for both experiments and for all precipitation thresholds, especially for the period t+18 to t+42 (Fig. 2f). For the first forecast period (i.e. t+06 to t+30, Fig. 2b) the OPER curve shows better results but the differences are not statistically significant with the exception of the 5 mm threshold were the ASSIM results were worst (at 95% significance level).
3. As it concerns ET S, for the first forecast period there is an improvement for ASSIM experiment only for the 0.1 mm precipitation threshold but this is not statisti-cally significant (Fig. 2c). The differences between the two experiments are statistically significant for the pre-cipitation thresholds of 1, 2.5 and 5 mm with a 90% confidence level. For the second forecast period, differ-ences between the two simulations are not statistically significant (Fig. 2g). In general, the results of ASSIM are worse than those of OPER.
5 Example of case studies
As discussed in Sect. 3, no statistically significant change was found through the implementation of the assimilation method, as in general the OPER statistical results are better than those obtained by the ASSIM simulations. An excep-tion was observed on the 18 October 2003 case, were there was an improvement of precipitation forecasts in the ASSIM simulations.
During this period, Northwestern Greece was influenced by a low–pressure system moving from Italy towards West Greece. Figure 3 presents the 24-h precipitation measured from the rain gauges from 18:00 UTC 18 October 2003
end-Fig. 4. (a) 24-h accumulated precipitation ending at 18:00 UTC 19
October 2003 on BOLAM fine grid for (a) OPER, and (b) ASSIM. Contour interval is every 10 mm. (b) As in (a), except for the AS-SIM simulation.
ing at 18:00 UTC 19 October 2003. This rainfall exceeded 60 mm at 4 stations around the 40◦N latitude line.
The next two figures (Figs. 4a, b) present the 24-h accu-mulated precipitation predicted by the OPER and the ASSIM experiments for the same period. The OPER accumulated precipitation field reproduced single maxima in Albania and the largest amount of precipitation in Northwest Greece does not exceed 40 mm. The ASSIM accumulated precipitation was closer to reality since the reproduced precipitation max-ima (purple colours in Fig. 4b) were closer to the 40◦N lat-itude line. In Kastoria, the 75 mm of rain recorded by the rain gauge compares better with the 56 mm forecasted by the ASSIM simulation than the 23 mm forecasted by the OPER simulation.
6 Concluding remarks
In the frame of this study, a statistical evaluation of the impact of assimilation of conventional data into the initial fields used by a limited area model has been performed. This evaluation was made on the precipitation forecasts of the model fine grid (covering Greece and part of the sur-rounding countries) for a selection of 15 rain events. The
242 N. Mazarakis et al.: Impact of the assimilation of conventional data
statistical evaluation of the simulations with (ASSIM) and without (OPER) data assimilation was based on the calcula-tion of standard verificacalcula-tion scores (bias, threat, ET S). The results have shown that there is not statistical improvement of the quantitative precipitation forecasts through the assim-ilation of conventional data. For most of the scores and for both verified periods the OPER simulations outperform the ASSIM ones and mainly for the ET S score. These results are in line with the results reported in Ferretti and Faccani (2005) who also found a poor improvement on rainfall from the assimilation of a large number of surface and upper air data for a case study in the Alpine region.
On the other hand the data used in this study are not dense as they are provided by the synoptic network. In the recent literature, it has been pointed out that the use of radar and satellite data has a larger impact on the verification scores (Gallus and Segal, 2001; Lagouvardos and Kotroni, 2005). It is therefore in the authors plans to continue this study and evaluate the impact on quantitative precipitation forecasts from the assimilation of non-conventional data, such as radar and/or satellite observations.
Acknowledgements. This work has been jointly financed by the
European Union (75%) and the Greek Ministry of Development (25%) in the framework of the program “Competitiveness – Pro-motion of Excellence in Technological Development and Research – Excellence in Research Centers, Action 3.3.1”, (MIS64563). The Hellenic National Meteorological Service is kindly acknowledged for providing the observed precipitation data used in this study. The authors are also grateful to NCEP (USA) for providing GFS initial and forecast field data, which allowed the operational use of meteorological model at NOA and to ECMWF for providing the surface and upper air data assimilated into the model.
Edited by: L. Ferraris
Reviewed by: anonymous referee
References
Bratseth, A.: Statistical interpolation by means of successive cor-rections, Tellus, 38A, 439–447, 1986.
Buzzi, A., Fantini, M., Malguzzi, P., and Nerozzi, F.: Validation of a limited area model in cases of Mediterranean cyclogenesis: surface fields and precipitation scores, Meteorol. Atmos. Phys., 53, 137–153, 1994.
Buzzi, A., Cadelli, R., and Malguzzi, P.: Low level jet simulation over the Antarctic ocean, Tellus, 49A, 263–276, 1997.
Buzzi, A., Tartaglione, N., and Malguzzi, P.: Numerical simula-tions of the 1994 Piedmont flood: role of orography and moist processes, Mon. Wea. Rev., 126, 2369–2383, 1998.
Buzzi, A. and Foschini, L.: Mesoscale meteorological features as-sociated with heavy precipitation in the southern Alpine region, Meteorol. Atmos. Phys., 72, 131–146, 2000.
Ferretti, R. and Faccani, C.: Data Assimilation of high density ob-servations Part II: Impact on the precipitation for the MAP/SOP IOP2b, Q. J. R. Meteorol. Soc., 131A, 43–62, 2005.
Gallus, W. A and Segal, M.: Impact of improved initialization of mesoscale features on convective system rainfall in 10-km Eta simulations, Wea. Forecasting, 16, 680–696, 2001.
Kalnay, E.: Atmospheric Modeling, Data Assimilation and Pre-dictability, Cambridge, 2003.
Kain, J. S. and Fritsch, J. M.: A one-dinensional entrain-ing/detraining plume model and its application in convective pa-rameterization, J. Atmos. Sci., 47, 2784–2802, 1990.
Kain, J. S. and Fritsch, J. M.: Convective parameterization for mesoscale models: The Kain-Fritsch scheme, The Representa-tion of Cumulus in numerical models, Meteor. Monogr., No. 46, Amer. Meteorol. Soc., 165–177, 1993.
Lagouvardos, K. and Kotroni, V.: Improvement of high resolution weather forecasts through humidity adjustment, based on satel-lite data, Q. J. R. Meteorol. Soc., 131, 2695–2712, 2005. Lagouvardos, K., Kotroni, V., Koussis, A., Feidas, C., Buzzi, A.,
Malguzzi, P.: The meteorological model BOLAM at the National Observatory of Athens: assessment of two-year operational use, J. Appl. Meteorol., 42, 1667–1678, 2003.
Mesinger, F., Black, T. L., Plummer, D. W., and Ward, J. H.: Eta model precipitation forecasts for a period including tropical storm Allison, Wea. Forecasting, 5, 483–493, 1990.
Mesinger, F.: Improvements in Quantitative Precipitation Forecasts with the ETA Regional Model at the National Centers for Envi-ronmental Prediction: The 48-Km Upgrade, Bull. Amer. Meteo-rol. Soc., 2637–2649, 1996.
Music, S. and Nickovic, S.: Implementation of the ICoD data as-similation system appropriate for high-resolution modeling in the meteorological models used in the I.E.R.S.D./N.O.A., Final Project report, Malta, 2003.
Gronas, S. and Midtbo, K. H.: Operational Multivariate Analyses by Successive Corrections, Collection of Papers Presented at the WMO/IUGG NWP Symposium Tokyo, 4–8 August 1986, 61– 74, 1986.
Spencer, P. L. and Stensrud, D. J.: Flash flood events: importance of the subgrid representation of convection., Mon. Wea. Rev., 126, 2884–2912, 1998.