HAL Id: hal-00317479
https://hal.archives-ouvertes.fr/hal-00317479
Submitted on 31 Jan 2005
HAL is a multi-disciplinary open access
archive for the deposit and dissemination of
sci-entific research documents, whether they are
pub-lished or not. The documents may come from
teaching and research institutions in France or
abroad, or from public or private research centers.
L’archive ouverte pluridisciplinaire HAL, est
destinée au dépôt et à la diffusion de documents
scientifiques de niveau recherche, publiés ou non,
émanant des établissements d’enseignement et de
recherche français ou étrangers, des laboratoires
publics ou privés.
near magnetic noon
R. W. Sims, S. E. Pryse, W. F. Denig
To cite this version:
R. W. Sims, S. E. Pryse, W. F. Denig. Spatial structure of summertime ionospheric plasma near
magnetic noon. Annales Geophysicae, European Geosciences Union, 2005, 23 (1), pp.25-37.
�hal-00317479�
SRef-ID: 1432-0576/ag/2005-23-25 © European Geosciences Union 2005
Annales
Geophysicae
Spatial structure of summertime ionospheric plasma near magnetic
noon
R. W. Sims1,*, S. E. Pryse1, and W. F. Denig2
1Institute of Mathematical and Physical Sciences, University of Wales Aberystwyth, SY23 3BZ, UK
2Space Vehicles Directorate, Air Force Research Laboratory, Hanscom AFB, Massachusetts, USA
*now at: Medical Physics Directorate, University Hospital of North Staffordshire, ST4 7LN, UK
Received: 10 October 2003 – Revised: 14 May 2004 – Accepted: 2 July 2004 – Published: 31 January 2005 Part of Special Issue “Eleventh International EISCAT Workshop”
Abstract. Results are presented from a multi-instrument
study of the spatial distribution of the summertime, polar ionospheric electron density under conditions of relatively
stable IMF Bz<0. The EISCAT Svalbard radar revealed a
region of enhanced densities near magnetic noon that, when comparing radar scans from different local times, appeared to be spatially confined in longitude. This was identified as the tongue-of-ionisation (TOI) that comprised photoionisation of sub-auroral origin that is drawn poleward into the polar cap by the anti-sunward flow of the high-latitude convection. The TOI was bounded in longitude by high-latitude troughs; the pre-noon trough on the morning side with a minimum near
78◦N and the post-noon trough on the afternoon side with
a minimum at 80◦N. Complementary measurements by
ra-dio tomography, the SuperDARN radars, and a DMSP satel-lite, together with comparisons with earlier modelling work, provided supporting evidence for the interpretation of the density structuring, and highlighted the role of plasma con-vection in the formation of summertime plasma distribution. Soft particle precipitation played only a secondary role in the modulation of the large summertime densities entering the polar cap.
Key words. Ionosphere (Plasma convection; Plasma
temperature and density; Polar ionosphere)
1 Introduction
The polar ionosphere is a highly-structured medium that comprises electron density irregularities on a wide range of horizontal spatial scales (Tsunoda, 1988). The current study is concerned with dayside F-region density structures on horizontal scales of tens to hundreds of kilometers in Correspondence to: S. E. Pryse
(sep@aber.ac.uk)
the magnetic noon sector under conditions of Interplane-tary Magnetic Field (IMF) Bz<0. Of particular interest is the tongue-of-ionisation (TOI), transporting photoionisation from sub-auroral latitudes into the polar cap, that separates the high-latitude density troughs in the pre- and post-noon time sector.
The source of the large polar electron densities has been investigated during the past twenty years, and early ground-based observations of polar F-region ionisation under
condi-tions of IMF Bz<0 have revealed patches of high electron
density (Buchau et al., 1983, 1988). Soft-particle precipita-tion in sub-polar regions has been cited as a possible source for polar ionisation, with the less energetic incoming parti-cles giving rise to enhanced density at high altitudes where the lifetime of plasma is sufficiently long for it to be trans-ported over the polar cap (Weber et al., 1984). In this in-stance, it was suggested that there may be sufficient time for the plasma density to build-up if sunward convecting flux-tubes move along the cusp region for tens of minutes before turning anti-sunward into the polar cap. However, it is now widely accepted that the bulk of the ionisation within the po-lar cap originates from the transport of photoionisation from sub-auroral latitudes, and not direct soft particle precipitation in the vicinity of the cusp (Knudsen, 1974; Kelly and Vick-rey, 1984; Whalen, 1994). Foster (1984) presented average maps of convection and F-region electron density at auroral latitudes from the Chatanika radar. A region of enhanced photoionisation was observed to form in the post-noon time sector near a region of flow stagnation. This region of en-hancement subsequently formed a tongue, similar to that first identified by Sato (1959), that was observed to move through the cleft and populate the polar cap with fresh F-region plasma near magnetic noon. Further detailed studies using incoherent scatter radar observations support photoion-isation convection poleward through the cleft as a source of polar-cap ionisation (Foster, 1993, and references therein).
More recently, a multi-instrument approach by Pryse et al. (2004) presented circumstantial evidence for the TOI in the magnetic noon sector. Radio tomographic imaging identi-fied a ridge of enhanced densities at sub-auroral latitudes that were suggested to form in a region of slow-moving plasma slightly poleward of a region of stagnation. To the authors knowledge there have been no EISCAT observations of the latitudinal structure of the TOI in the literature.
Several authors have cited possible mechanisms for the creation of patches from the continuous plasma stream of the TOI. Sojka et al. (1994) used the Time-Dependent Iono-spheric Model (TDIM) to illustrate how temporal variations
in IMF By can cause the shearing of the TOI into features
consistent with polar patches (Crowley, 1996). Rodger et al. (1994) described how high-velocity flow channel events are able to cause enhanced rates of plasma recombination that effectively fragments the ionisation into patches. Anderson et al. (1988) suggested that an expansion of the high-latitude convection pattern into a region of photoionisation at sub-auroral latitudes, and then its subsequent contraction, could give rise to patch-like structures in the polar cap. A variation by Lockwood and Carlson (1992) suggested that the expan-sion of the convection pattern could be controlled by pulsed dayside magnetopause reconnection. Soft particle precipita-tion within the cusp may also contribute to patch formaprecipita-tion, although there remains controversy surrounding the extent to which it modulates the electron density (Walker et al., 1999;
Smith et al., 2000; Nielsen et al., sumitted, 20031) . The
UT and seasonal modulation of polar patches has been mod-elled by Sojka et al. (1994) where patches were most marked during winter solstice between 20:00–24:00 UT. Subsequent modelling during winter conditions investigated the effects
of IMF By and the location of the observing site (Bowline
et al., 1996). These results suggested that the patches, and hence TOI, were most marked between 17:00–22:00 UT but were almost absent near magnetic noon during conditions of IMF By>0 at Ny ˚Alesund. However, a multi-instrument case study by Pryse et al. (2004) provided circumstantial evidence for the TOI above Svalbard near magnetic noon in winter, and whilst the patch-to-background ratio measured was con-siderably less than that predicted for 17:00–22:00 UT, it was
broadly in agreement with the ratio modelled at Ny ˚Alesund
and with the patch criterion of Crowley (1996) of density two-fold above background.
Regions of depleted F-region electron density that bound the TOI at sub-polar latitudes are referred to as high-latitude density troughs (Whalen, 1994). These troughs are discussed in the review paper by Rodger et al. (1992) where the roles of flow stagnation and enhanced electric fields are cited as being important for their formation. Unlike the main, mid-latitude trough that has a reasonably well-defined morphol-ogy (Moffett and Quegan, 1983), the high-latitude troughs are less studied and not so-well understood, owing to the lack
1Nielsen, C., Moen, J., Carlson, H., Oksavik, K., Gallop, P., and
Denig, W.: Patch formation in relation to cusp auroral activity, Ann. Geophys. submitted, 2003.
of observations in remote and inhospitable locations. One of the largest databases was recorded during the International Geophysical Year 1958 when an extensive array of ground-based sounders were used to provide maps of foF2 over ex-tended areas. Data from the high-latitude sites were consid-ered by Whalen (1987, 1989, 1994) in the investigation of high-latitude troughs in relation to high-latitude convection. Whalen (1987) identified a longitudinal variation in a trough location, attributed to the offset between the geomagnetic co-ordinate system, in which the high-latitude convection pattern resides, and the geographic coordinate system. Sub-sequently, Whalen (1989) proposed that these troughs oc-cur in regions where the sunward convective flow was car-rying low-density plasma from the nightside to displace re-gions of high-density daytime plasma. The relationship be-tween these density troughs and the TOI was then reported by Whalen (1994), who suggested that the maximum den-sity of the ridge of ionisation that comprises the TOI had a seasonal dependence consistent with ionisation by solar radi-ation, and a local time dependance that was consistent with the transport from elsewhere rather than local production.
Several incoherent scatter observations have presented re-gions of depleted F-region electron density near the noon
sector. In these experiments the high-latitude trough
oc-curred on sunward convecting field lines equatorward of the convection reversal boundary (CRB) in both the pre- and post-noon time sectors (Kelly and Vickrey, 1984; Foster and Doupnik, 1984; Foster et al., 1989). However, the review by Rodger et al. (1992) suggested that although the high-latitude trough does occur on sunward convecting field lines in the post-noon time sector, it often occurs in close proximity to the CRB and 30 keV electron trapping boundary in the pre-noon time sector. Radio tomography has imaged the latitu-dinal structure of the post-noon high-latitude trough under quiet geomagnetic conditions (Pryse et al., 1998). Compar-ison of the trough location with the Izmiran electrodynamic model (IZMEM) suggested that the trough was coincident with a regime of sunward convective flow in the post-noon time sector. Recent tomographic studies suggest that the post-noon trough is a persistent feature in winter, residing entirely within a regime of sunward return convective flow (Sims, 2003), with its poleward wall being modulated by soft auroral precipitation and the equatorward wall governed by photoionisation.
The results presented in this paper focus on the large-scale spatial structure of the dayside summertime ionosphere made by the EISCAT Svalbard radar (ESR) broadly between 06:30–09:30 UT on the 26 August 2000. The geomagnetic
conditions during this period were quiet, with a Kpindex of
1+. A new aspect are observations of electron density along the TOI bounded on either side by the pre- and post-noon high-latitude troughs. Simultaneous observations by radio tomography, the SuperDARN HF radars and a satellite from the Defence Meteorological Satellite Program (DMSP) con-stellation have provided additional support for the interpreta-tion of the density structures.
0 4 -4 0 4 -4 0 4 -4 05:00 06:00 07:00 08:00 09:00 B x (n T ) B y (n T ) B z (n T )
ACE IMF – 26 August 2000
Time (UT)
Figure 1:
21
Fig. 1. The three components of the IMF measured by the ACE spacecraft upstream in the solar wind between 05:00–09:00 UT on 26 August
2000.
2 Experimental observations
2.1 Interplanetary Magnetic Field
The three components of the IMF measured by the ACE spacecraft between 05:00–09:00 UT are shown in the three panels of Fig. 1. Of particular interest to the current study is
the negative Bzcomponent of between −2 and −5 nT during
the interval 05:00–08:20 UT, commensurate with equatorial magnetopause reconnection. At this time there is a weak
trend in the By component from −2 to +2 nT with multiple
zero crossings, centered approximately at 07:00 UT. The Bx
component is positive, apart from a brief negative excursion around 06:50 UT. The spacecraft was positioned upstream of
the Earth in the solar wind at approximately 240 RE, where
it measured an essentially constant solar wind velocity of
390 kms−1. Simple calculations estimate the time delay
be-tween these observations and the corresponding ionospheric response to be approximately 67 min, with more detailed calculations using a procedure similar to that described by Lockwood et al. (1989) suggesting a time delay closer to 73 min. For the time scales appropriate to this study a time delay of 70 min has been used.
2.2 Electron density at auroral and sub-auroral latitudes
2.2.1 EISCAT Svalbard radar
The EISCAT Svalbard radar (78.2◦N, 16.1◦E, 75.0◦MLAT,
113.1◦MLON) was operating in the NOON UK special
pro-gramme mode broadly between 06:30–09:30 UT. The steer-able 32-m antenna scanned from north-to-south of zenith along the local geographic meridian in cycles of approx-imately twenty minutes. Each meridional scan comprises 38 pointing directions corresponding to latitudinal steps of
0.19◦at an altitude of 300 km. The measured electron
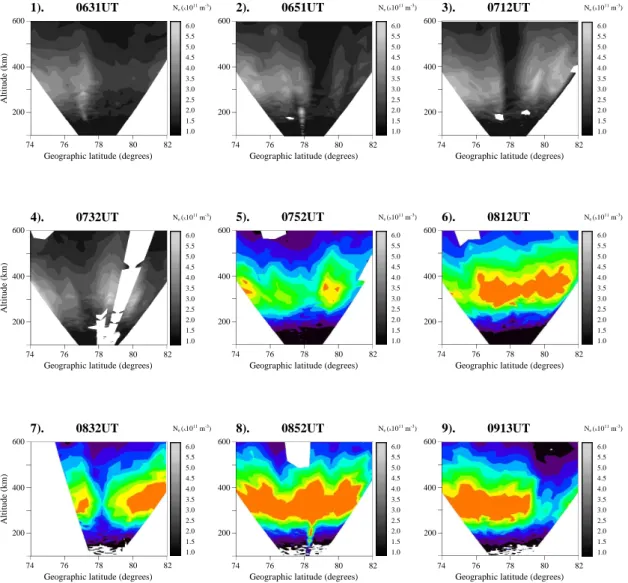
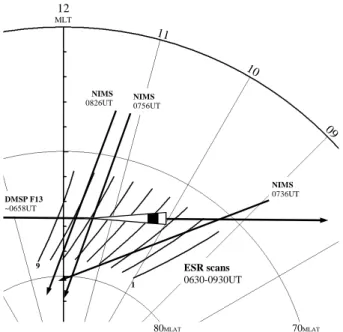
den-sities and temperatures, post-integrated over 2 scan positions for improved signal-to-noise ratio, are shown in Figs. 2 and 3, respectively. The 300-km ray-path intersection for succes-sive radar scans are shown on a MLAT versus MLT polar grid broadly between 09:00–13:00 MLT in Fig. 4, with the first and last scan labelled 1 and 9, respectively. The alignment of successive radar scans away from the magnetic meridian is due to the geographic scanning operation of the radar, rotat-ing the northern part of the scan to the east of the magnetic pole and the southern part of the scan to the west, resulting in each scan spanning a small (<1 h) MLT region.
The first two electron density scans starting at 06:31 UT
A lt it ude ( km )
Geographic latitude (degrees)
74 76 78 80 82 600 400 200 1). 0631UT 6.0 5.5 5.0 4.5 4.0 3.5 3.0 2.5 2.0 1.5 1.0 Ne (x1011 m-3) A lt it ude ( km )
Geographic latitude (degrees)
74 76 78 80 82 600 400 200 4). 0732UT 6.0 5.5 5.0 4.5 4.0 3.5 3.0 2.5 2.0 1.5 1.0 Ne (x1011 m-3 )
Geographic latitude (degrees)
74 76 78 80 82 600 400 200 2). 0651UT 6.0 5.5 5.0 4.5 4.0 3.5 3.0 2.5 2.0 1.5 1.0 Ne (x1011 m-3)
Geographic latitude (degrees)
74 76 78 80 82 600 400 200 3). 0712UT 6.0 5.5 5.0 4.5 4.0 3.5 3.0 2.5 2.0 1.5 1.0 Ne (x1011 m-3)
Geographic latitude (degrees)
74 76 78 80 82 600 400 200 5). 0752UT 6.0 5.5 5.0 4.5 4.0 3.5 3.0 2.5 2.0 1.5 1.0 Ne (x1011 m-3)
Geographic latitude (degrees)
74 76 78 80 82 600 400 200 6). 0812UT 6.0 5.5 5.0 4.5 4.0 3.5 3.0 2.5 2.0 1.5 1.0 Ne (x1011 m-3) A lt it ude ( km )
Geographic latitude (degrees)
74 76 78 80 82 600 400 200 7). 0832UT 6.0 5.5 5.0 4.5 4.0 3.5 3.0 2.5 2.0 1.5 1.0 Ne (x1011 m-3)
Geographic latitude (degrees)
74 76 78 80 82 600 400 200 8). 0852UT 6.0 5.5 5.0 4.5 4.0 3.5 3.0 2.5 2.0 1.5 1.0 Ne (x1011 m-3)
Geographic latitude (degrees)
74 76 78 80 82 600 400 200 9). 0913UT 6.0 5.5 5.0 4.5 4.0 3.5 3.0 2.5 2.0 1.5 1.0 Ne (x1011 m-3) Figure 2:
22
Fig. 2. Electron densities measured by the ESR during successive latitudinal scans of the radar beam in the NOOK UK special programme
broadly between 06:30-09:30 UT on 26 August 2000. The start time for each scan where the radar beam is at its most northerly position is shown on the figure.
poleward of 78.0◦N (∼75.0◦MLAT) with increased levels of
nearer 2.5×10¹¹m−3at the northern extreme of the
field-of-view. A broad region of enhanced F-region electron densities occur at lower latitudes with evidence for finer structuring
broadly between 76.0◦–78.0◦N (∼73.0◦–75.0◦MLAT). The
striking feature in the third scan starting at 07:12 UT is the abrupt appearance of a dense patch of plasma at high alti-tudes and latialti-tudes located between 78.5◦–81.5◦N (∼75.5◦–
78.5◦ MLAT) near 10:30 MLT in the pre-noon time
sec-tor (see Fig. 4). This feature has a maximum density of
5.5×10¹¹m−3at a height of 360 km with a relatively sharp
bottomside density profile near 250 km. Its presence pro-duces a narrow density trough just to the south of some
1.0◦ latitude wide, with a peak density of 1.5×10¹¹m−3.
The dense patch of plasma and narrow density trough are observed at slightly lower latitudes and altitudes by the next radar scan starting at 07:32 UT, with electron densities
of 6.0×10¹¹m−3and 2.5×10¹¹m−3, respectively. Twenty
minutes later during the radar scan starting at 07:52 UT the density trough is no longer discernable from the surrounding ionospheric structure. A relatively uniform region of elec-tron density now extends over the entire latitudinal field-of-view with a small gradient in the F-region peak increasing in height with latitude. This gradient is much clearer by the scan starting at 08:12 UT, where electron densities in excess
of 6.0×10¹¹m−3generally extend from low to high latitudes
along the scan. There is some evidence for the modulation of this band of high densities on smaller spatial scales, and a hint of a poleward edge to the ionisation at the northern extreme of the field-of-view. The electron densities
con-tinue to increase to nearly 9.0×10¹¹m−3by the scan
start-ing at 08:52 UT, with detailed analysis suggeststart-ing no signif-icant latitudinal structure. This region of very high densi-ties is interrupted only with the abrupt appearance of a
den-sity trough near 78.0◦N (∼75.0◦MLAT) during the scan at
A lt it ude ( km )
Geographic latitude (degrees)
74 76 78 80 82 600 400 200 1). 0631UT A lt it ude ( km )
Geographic latitude (degrees)
74 76 78 80 82 600
400
200
4). 0732UT
Geographic latitude (degrees)
74 76 78 80 82 600
400
200
2). 0651UT
Geographic latitude (degrees)
74 76 78 80 82 600
400
200
3). 0712UT
Geographic latitude (degrees)
74 76 78 80 82 600
400
200
5). 0752UT
Geographic latitude (degrees)
74 76 78 80 82 600 400 200 6). 0812UT Te (K) 4000 3680 3360 3040 2720 2400 2080 1760 1440 1120 800 Te (K) 4000 3680 3360 3040 2720 2400 2080 1760 1440 1120 800 Te (K) 4000 3680 3360 3040 2720 2400 2080 1760 1440 1120 800 Te (K) 4000 3680 3360 3040 2720 2400 2080 1760 1440 1120 800 Te (K) 4000 3680 3360 3040 2720 2400 2080 1760 1440 1120 800 Te (K) 4000 3680 3360 3040 2720 2400 2080 1760 1440 1120 800 A lt it ude ( km )
Geographic latitude (degrees)
74 76 78 80 82 600
400
200
7). 0832UT
Geographic latitude (degrees)
74 76 78 80 82 600
400
200
8). 0852UT
Geographic latitude (degrees)
74 76 78 80 82 600 400 200 9). 0913UT Te (K) 4000 3680 3360 3040 2720 2400 2080 1760 1440 1120 800 Te (K) 4000 3680 3360 3040 2720 2400 2080 1760 1440 1120 800 Te (K) 4000 3680 3360 3040 2720 2400 2080 1760 1440 1120 800 Figure 3:
23
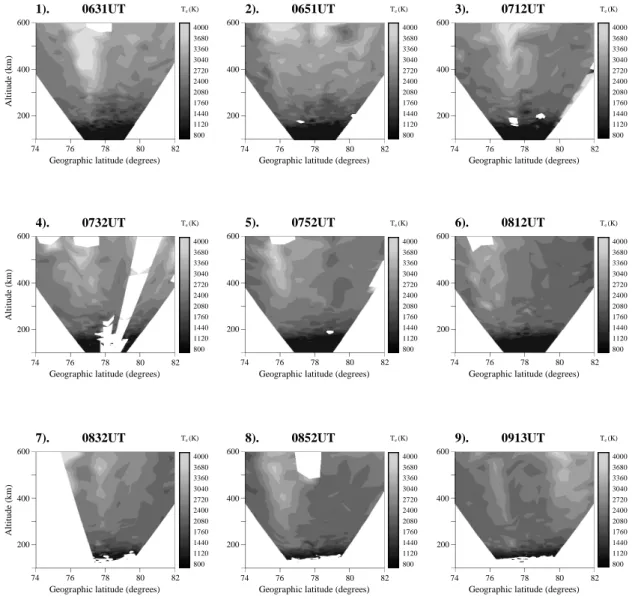
Fig. 3. Electron temperatures measured by the ESR corresponding to the electron densities presented in Fig. 2.
scan starting at 09:13 UT this extended region of high
elec-tron densities has a pronounced poleward edge near 79.5◦N
(∼76.5◦MLAT). Further north there is a density trough
cen-tered at 80.0◦N (∼77.0◦MLAT) with a poleward wall at the
northern extreme of the field-of-view.
Corresponding measurements of the electron temperature indicates that a region of precipitation occurs broadly
be-tween 76.0◦–78.0◦N (∼73.0◦–75.0◦MLAT) throughout the
interval of interest (Nilsson et al., 1994). The precipitation is relatively soft and exhibits variability in both location and magnitude, generally becoming latitudinally confined with time. This is shown in the 3040-K contour between the first and eighth radar scan that decreases from around 2.0◦to 1.0◦ in latitudinal extent at an altitude of 400 km. A separate event is observed during the scan starting at 08:32 UT, where a region of enhanced electron temperatures occur at high al-titudes just south of zenith. Whilst this region is relatively weak it is clearly distinct from the soft precipitation fur-ther south. Away from regions of precipitation the electron
temperatures are generally cool and are likely to represent background levels. There is, however, a region of enhanced electron temperatures during the final scan at 09:13 UT in the northern field-of-view that exhibits a sharp equatorward
edge near 79.5◦N (∼76.5◦MLAT).
In light of the electron temperature measurements, and taking into account radar geometry (see Fig. 4), it is clear that the dense patch of plasma observed at 07:12 UT in the pre-noon sector was not being produced in-situ by soft parti-cle precipitation at the time of observation, but comprised cold solar-produced ionisation that had convected into the radar beam. This interpretation is re-enforced by the high altitude of the enhancement and its relatively sharp bottom-side profile, with plasma having recombined at the lower altitudes but remaining at high altitudes where the lifetime is longer. The appearance of this dense patch of plasma in the ESR field-of-view coincides with a weakening negative
Bycomponent of the IMF that may modify the entry region
12 MLT 11 10 80MLAT NIMS 0736UT NIMS 0756UT NIMS 0826UT ESR scans 0630-0930UT 1 9 70MLAT DMSP F13 ~0658UT 09 Figure 4: 24
Fig. 4. Plot showing the geometry of the observations on a MLAT
versus MLT polar grid. The location of the ESR radar beam during successive radar scans is shown broadly between 09:00–13:00 MLT with labels indicating the starting position of the first (1) and last (9) radar scan. Also shown are the trajectories of three northbound NIMS satellites at 07:36 UT, 07:56 UT and 08:26 UT where the arrows indicate the direction of satellite motion. The dusk-to-dawn trajectory of the DMSP F13 satellite is shown by the thick hori-zontal black line, with the black arrow at the pre-noon extent of the trajectory indicating the direction of satellite motion. The white triangle with a small black shaded region superimposed on the satel-lite trajectory broadly between 10:00–11:00 MLT indicates the ex-tent of the ion dispersion signature and region of cusp precipitation, respectively.
1994). The appearance of this patch produced a narrow den-sity trough at slightly lower latitudes with no evidence for in-creased chemical recombination in measurements of the ion
temperature (not shown). At lower latitudes between 76.0◦–
78.0◦N (∼73.0◦-75.0◦MLAT) structured electron densities
are being produced in-situ by soft particle precipitation. A transition into the noon sector is observed during the sixth radar scan starting at 08:12 UT, where latitudinally extended regions of higher electron densities are observed essentially across the field-of-view. This can partly be at-tributed to increased levels of solar EUV ionisation as the radar approaches local geographic noon (see Fig. 4), but the lack of any significant horizontal gradients in electron den-sity suggests this feature is the TOI in the magnetic noon sec-tor. The increasing peak height with latitude can be attributed to both the geometrical effect of increasing solar zenith an-gle with latitude, and the plasma recombination rate at lower altitudes as the ionisation is drawn into the polar cap to form the TOI. The role of soft particle precipitation in modulating the electron density at lower latitudes appears to be having only a secondary effect on the density structure, attributed to its superposition on such a large background density levels in
70 72 74 76 78 80
Geographic Latitude (Degrees) 200 400 600 800 Height (km) 0.5 0.5 0.5 0.5 1.0 1.0 1.5 1.5 1.5 2.0 2.0 2.0 2.0 2.5 2.5 2.5 2.5 3.0 3.0 3.0 3.0 3.5 3.5 3.5 3.5 4.0 4.0 4.0 4.0 4.5 4.5 5.0 5.0 5.5
Tomographic Image: 26 Aug 2000 07:36 UT Electron Density x 1011 m-3 0 2 4 6 8 10 Electron Density (x 10 11 m -3) 70 72 74 76 78 80
Geographic Latitude (Degrees) 200 400 600 800 Height (km) 0.5 0.5 0.5 0.5 1.0 1.0 1.5 1.5 2.0 2.0 2.0 2.0 2.5 2.5 2.5 2.5 3.0 3.0 3.0 3.0 3.5 3.5 3.5 3.5 4.0 4.0 4.0 4.0 4.5 4.5 5.0 5.0
Tomographic Image: 26 Aug 2000 07:56 UT Electron Density x 1011 m-3 0 2 4 6 8 10 Electron Density (x 10 11 m -3) 70 72 74 76 78 80
Geographic Latitude (Degrees) 200 400 600 800 Height (km) 1 1 1 1 2 2 2 2 3 3 3 3 4 4 4 4 5 5 5 6 6 7 7 8 8 8 9
Tomographic Image: 26 Aug 2000 08:26 UT Electron Density x 1011 m-3 0 2 4 6 8 10 Electron Density (x 10 11 m -3)
Figure 5:
25
Fig. 5. Tomographic images of the spatial distribution of electron
density during three satellite passes crossing a latitude of 75.0◦N
at 07:36 UT (upper panel), 07:56 UT (centre panel) and 08:26 UT (lower panel) plotted as a function of height and geographic latitude.
summertime. The only anomaly is the marked density trough observed during the scan starting at 08:32 UT that is likely to be associated with the weak trend in IMF By. This effect will be considered further in the discussion. The transition from the noon to the post-noon sectors is identified by the apparent pronounced poleward edge of the TOI in the scan starting at 09:13 UT with a density trough at the higher latitudes. The
enhanced electron temperatures within this trough are con-sistent with the expected decrease in electron cooling rate in regions of depleted electron density (Banks and Kockarts, Academic Press, New York, 1973).
2.2.2 Radio tomography
Supporting information for the latitudinal distribution of electron density is provided by the radio tomography ex-periment operated by the University of Wales, Aberystwyth
(Pryse, 2003). The tomography experiment comprises a
chain of four receivers in Northern Scandinavia that monitor phase coherent signals from the polar orbiting satellites in the Navy Ionospheric Monitoring System (NIMS), previously know as the Navy Navigational Satellite System (NNSS), that enables the measurement of total electron content along a large number of intersecting satellite-to-receiver ray-paths. Inversion of the data yields the distribution of electron den-sity over a meridional section of the polar ionosphere (for example Walker et al., 1998). Three satellite passes
inter-sected 75.0◦N at 07:36 UT, 07:56 UT and 08:12 UT and
the reconstructed electron densities are shown in the three
panels of Fig. 5. The 300-km ray-path intersection for
these satellite passes are shown in magnetic coordinates in Fig. 4. The first tomographic image corresponding to the satellite pass at 07:36 UT is shown in the upper panel of Fig. 5. The tomographic image shows the spatial distribu-tion of electron density in the pre-noon time sector broadly between 09:00–12:00 MLT (see Fig. 4). A density trough
with a minimum density of 3.5×10¹¹m−3 is centered at
77.0◦N (∼75.0◦ MLAT) with a broad region of enhanced
electron densities at lower latitudes. To the north of the trough is a patch of plasma between 77.5◦-81.0◦N (∼75.5◦–
78.3◦MLAT) with a maximum density of 6.0×10¹¹m−3.
The second tomographic image corresponding to the satel-lite pass at 07:56 UT is shown in the middle panel of Fig. 5. The tomographic image shows the spatial distribution of electron density in the magnetic noon sector between 11:00– 12:00 MLT (see Fig. 4). A broad region of enhanced electron densities extend from low-to-high latitudes along the image characteristic of the TOI. The continued increase in electron density within the TOI is observed during the third tomo-graphic image at 08:26 UT, where peak densities now reach 9.0×10¹¹m−3(lower panel of Fig. 5), with a hint of decreas-ing densities at the northern extreme of the image.
Comparison with ESR observations suggests that the spa-tial distribution imaged by tomography is consistent with the transition between the pre- and post-noon time sector. The
pre-noon density trough and dense patch between 77.5◦–
81.0◦N (∼75.5◦–78.3◦ MLAT) during the satellite pass at
07:36 UT is very similar to that observed by the ESR in both the radar scans starting at 07:12 UT and 07:32 UT. The observation of the TOI in the noon sector in the to-mographic images at 07:56 UT and 08:26 UT is consistent with corresponding ESR observations in time at 07:52 UT and 08:12 UT respectively. The decreasing densities with in-creasing latitude in the northern extreme of the tomographic
image at 08:26 UT is in agreement with the slight depletion observed at the northern extreme of the ESR scan starting at 08:12 UT. This edge effect is most pronounced during a later ESR scan starting at 09:13 UT, where a density trough at very high latitudes is suggested to mark a transition into the post-noon time sector. The absolute densities measured by tomography are in good agreement with ESR observations during the interval of interest, although the peak height is not so well reproduced, becoming progressively displaced in al-titude in comparison to ESR observations. The discrepancy in the altitude is attributed to the incomplete observing geom-etry of tomography that leads to reduced information about the vertical profile of the ionisation distribution. Whilst this affects all reconstructions to some extent, it has its most pro-nounced effect where there is a lack of horizontal structure, such as the last two images (Pryse et al., 1998).
2.3 High-latitude plasma flow
2.3.1 SuperDARN HF radars
Observations by the SuperDARN network of HF radars have been used to estimate the global high-latitude convection pat-tern throughout the interval of interest (Greenwald et al., 1990). Line-of-sight velocity measurements were used to constrain IMF-dependant empirical convection models based on statistically derived convection patterns by Ruohoniemi and Greenwald (1996), to obtain a map of the electric po-tential (Ruohoniemi and Greenwald, 1998). Selected out-puts are shown in Fig. 6 for four time periods covering the transition between the pre- and post-noon time sectors iden-tified by the ESR. These plots were chosen where there was sufficient backscatter within the Svalbard region, although this was not possible for the final period between 09:10– 09:12 UT. The electric potentials have been plotted on a MLAT versus MLT polar grid, equivalent to that shown in Fig. 4, with magnetic noon at the top of each output. The location of zenith and extent of the ESR scan corresponding to each output is shown on the figure by the red marker and black line, respectively.
Of interest in the current study is a clear two-cell convec-tion pattern that is consistent with the pertinent IMF
condi-tions (Cowley, 1998). The weak trend in the Bycomponent
shown in Fig. 1 is likely to have a secondary effect by in-troducing asymmetries into the convection pattern (Cowley and Lockwood, 1992). At the beginning of the interval of
interest the By component is negative and the entry region
is expected to be rotated towards earlier MLTs. This is ob-served with the output at 06:40–06:42 UT, where flows in
excess of 600 ms−1are directed towards the post-noon
sec-tor. As the Bycomponent weakens and approaches zero the
convection pattern becomes much more symmetrical around magnetic noon. This is observed during the next output at
08:10–08:12 UT, where flows in excess of 500 ms−1are
di-rected along the noon-midnight meridian. Subsequently the
Bycomponent becomes weakly positive which would cause
-03 -03 -03 -03 -09 -09 -09 -15 03 03 09 09 15 21 0 m/s 1000 1000 04 nT 49 kV APL MODEL 4<BT<6 Bz-/By-26 Aug 2000 06:40:00 - 06:42:00 UT -03 -03 -09 -09 -09 -15 -15 -21 -21 -27 03 03 03 09 09 15 0 m/s 1000 1000 03 nT 66 kV APL MODEL 0<BT<4 Bz-26 Aug 2000 08:10:00 - 08:12:00 UT -03 -03 -03 -03 -09 -09 -09 -15 -21 03 03 09 09 15 21 0 m/s 1000 1000 03 nT 61 kV APL MODEL 0<BT<4 Bz-26 Aug 2000 08:30:00 - 08:32:00 UT -03 -03 -03 -03 -09 -09 -09 -15 -15 -15 -21 -21 -27 03 03 03 09 09 15 0 m/s 1000 1000 04 nT 68 kV APL MODEL 4<BT<6 Bz-/By+ 26 Aug 2000 09:10:00 - 09:12:00 UT
a). 0640-0642UT
b). 0810-0812UT
c). 0830-0832UT
d). 0910-0912UT
Figure 6:
26
Fig. 6. Selected electric potential maps derived from line-of-sight velocity measurements from the SuperDARN HF radars broadly between
06:30–09:30 UT on 26 August 2000.
observed during the third output at 08:30–08:32 UT and the fourth output at 09:10–09:12 UT, albeit with much less
scat-ter, where flows in excess of 400 ms−1are directed into the
pre-noon sector.
During the first output between 06:40–06:42 UT the ESR is located to the west of the expected location of the TOI, where it observes the spatial distribution of electron density in the pre-noon time sector. Comparison with the electric potentials suggests that the dense patch of plasma at high-latitudes during the radar scan starting at 07:12 UT occurs on antisunward convecting field lines, consistent with the in-terpretation that it comprises solar-produced ionisation that
is entering the polar cap as a TOI. The narrow density trough at slightly lower latitudes also appears to reside on antisun-ward convecting field lines, whereas the structured electron densities further south are broadly coincident with the centre of the pre-noon convection cell. As the ESR moves closer to magnetic noon between 08:10–08:12 UT the radar beam be-comes aligned essentially along the noon-midnight magnetic meridian. Measurements of the IMF from the ACE
space-craft during this period suggest that the By component is of
very weak magnitude (see Fig. 1). A region of high electron densities spans the entire latitudinal range of the scan during this time period that are interpreted as being the TOI. The
F13
26 Aug 2000
102 103 104 102 103 104 -1500 0 1500 Sunward Antisunward HOR-C 102 104 106ELECTRON FLUX particles/(cm 2 s sr eV) 100 102 104 ION FLUX particles/(cm 2 s sr eV) M/SEC ENERGY (eV) Electrons Ions 24900 6:55 75.6 12.5 24960 6:56 75.6 11.6 25020 6:57 74.7 10.7 25080 6:58 73.2 9.90 25140 6:59 71.2 9.20 25200 7:00 68.7 8.80 UT(SEC) HH:MM MLAT MLT
Figure 7:
27
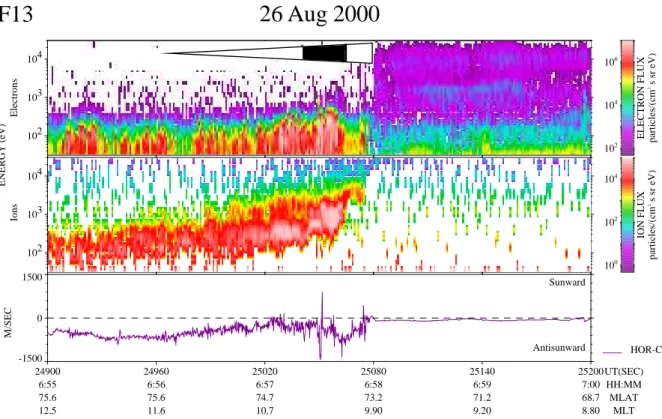
Fig. 7. Electron and ion flux spectra (upper two panels) and the horizontal component of cross-track ion drift (lower panel) for the pass of
the DMSP F13 satellite between 06:55–07:00 UT. The extent of the ion dispersion is shown at the top of the electron spectra panel by the white triangle, consistent with Fig. 4.
Bycomponent subsequently becomes positive, and the entry
region is observed to rotate to later MLTs during the outputs at 08:30–08:32 UT and 09:10–09:12 UT. During the latter output the ESR radar is located within the post-noon time
sector where the TOI is observed to extend to 79.5◦N with
a density trough located further north. Comparison with the electric potentials suggests that this density trough is coinci-dent with plasma well-inside the post-noon convection cell. Measurements of the component of ion velocity along the line-of-sight of the ESR radar beam (not shown) throughout the time interval are consistent with SuperDARN observa-tions.
2.3.2 Defence Meteorological Satellite Program
Further experimental support for the anticipated convec-tion pattern was provided by measurements made by the F13 satellite of the Defence Meteorological Satellite Pro-gramme (DMSP). The satellite followed an essentially east-to-west trajectory across the dayside ionosphere crossing
magnetic noon near 75.6◦ MLAT at 06:55 UT. Of
particu-lar interest is the pre-noon section of this satellite pass that is shown in magnetic co-ordinates in Fig. 4 by the
hori-zontal black line. Measurements of the cross-track
hori-zontal component of ion drift along the satellite trajectory is shown in the lower panel of Fig. 7. The negative val-ues between 06:55–06:58 UT indicate that an antisunward flow component was measured as the satellite passed from
the noon to the pre-noon time sector broadly between 75.6◦–
73.2◦MLAT and 12:30–09:54 MLT, consistent with
Super-DARN observations (Fig. 6a). An abrupt weakening of the
antisunward component is observed near 73.2◦MLAT with
near-zero values thereafter. Whilst it is possible that the abrupt weakening of the flow may have occurred as the satel-lite trajectory aligned with the direction of plasma flow, the persistence of the low values to lower latitudes is likely to suggest that the satellite has moved out of the high-latitude convection regime to that at lower latitudes.
Complementary measurements of the electron and ion spectra shown in the top two panels of Fig. 7 show characteristics of cusp precipitation (Newell and Meng,
1988). Ion energies of ∼103eV and electron energies of
∼102eV occur between 74.2◦–73.7◦MLAT within a region
of ion dispersion. This precipitation, embedded within a region of antisunward plasma flow, provides evidence for
magnetopause reconnection during IMF Bz<0 conditions
(Newell and Meng, 1991, 1995). The extent of the disper-sion signature is shown by the white triangle, directed oppo-site to satellite motion, superimposed on the satellite trajec-tory in Fig. 4 and above the electron spectra panel in Fig. 7.
The base of the triangle near 73.2◦ MLAT and 09:54 MLT
indicates the location of a drop-out of ∼keV electrons and equatorward edge of energetic ion precipitation, whereas the
apex of the triangle near 75.2◦MLAT and 11:30 MLT
12 MLT 11 10 80MLAT 70MLAT 09 T O I e n try Photoionisation ESR scans Figure 8: 28
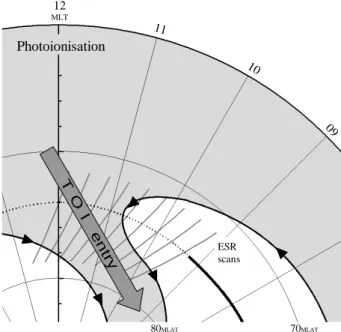
Fig. 8. Summary schematic showing the main observed features
on a MLAT versus MLT polar grid during the By>0 and Bz<0
conditions near the end of the time interval. Superimposed are con-vection streamlines with the large grey arrow indicating the entry of the TOI, flanked by depletions in electron density on its pre- and post-noon sides.
The black shaded section near the base of the triangle in-dicates the location of cusp precipitation. The drop-out of
∼keV electrons near 73.2◦MLAT is in close proximity to the
30 keV electron trapping boundary identified by a NOAA 15 satellite 10 min previously (not shown). These boundaries may be used as a proxy for the open/closed magnetic field-line boundary (OCLFB) (Sotirelis et al., 1998; Moen et al., 1996, 1998).
Comparison with ESR observations indicate that the re-gion of ion dispersion and cusp precipitation is coincident with the region of soft precipitation observed by the radar
between 76.0◦–78.0◦N (∼73.0◦–75.0◦MLAT) that resulted
in structured F-region electron densities. The drop-out of
∼keV electrons and the abrupt weakening of antisunward
plasma flow are both coincident with the equatorward edge of the region of structured electron densities. This suggests that both the dense patch of plasma and resulting narrow density trough subsequently observed by the ESR occur on open, antisunward convecting field lines, consistent with Su-perDARN observations.
3 Discussions and Conclusions
ESR observations have been presented of large-scale spa-tial structure in the summertime dayside ionospheric plasma
under conditions of IMF Bz<0. Multi-instrument
observa-tions from radio tomography, a DMSP satellite and the Su-perDARN radars have been used to distinguish between spa-tial and temporal changes in the structuring of the density
features. Interplanetary and geomagnetic conditions during the period of interest were relatively constant, allowing the study to focus on the spatial distribution of plasma. A weak
trend of increasing IMF Bydid, however, give rise to a
tem-poral variation in density as IMF Bychanged polarity, but its effect was only of secondary importance to the study. Central to the study were observations of the tongue-of-ionisation transporting plasma from sub-auroral latitudes into the po-lar cap identified by the ESR as it rotated beneath what are essentially fixed features. Inspection of successive radar scans revealed that the TOI was extended in latitude but con-fined in longitude, being flanked on the dawn and dusk sides by depletions in electron density. Earlier modelling studies (Bowline et al., 1996) have provided images of such spatial structure, but observations of the latitudinal structure of such features to substantiate the model output have been few in this remote and inhospitable region of the globe.
To aid the interpretation of the measurements from the different instruments, the distribution of photoionisation ob-served during the study has been plotted in geomagnetic co-ordinates in Fig. 8. The figure is similar to that shown in Fig. 4, containing only the location of the ESR radar scans, and has been constructed for By>0 and Bz<0 conditions
near the end of the time interval. It shows the entry of
photoionisation into the pre-noon time sector with regions of depleted densities (no shading) flanking the TOI on its pre- and post-noon sides. Superimposed are thick black ar-rowed curves that represent the possible high-latitude con-vection pattern consistent with SuperDARN and DMSP ob-servations and the theoretical convection patterns by Cowley (1998). The thick black curve at the centre of the pre-noon convection cell extending to approximately 09:15 MLT indi-cates the likely location of the non-reconnecting segment of the OCLFB, whereas the dashed line thereafter indicates the broad location of soft particle precipitation identified by both the ESR and a DMSP satellite.
The peak height of dayside F-region summertime plasma is expected to increase with latitude as the solar zenith an-gle increases. Simple calculations at an altitude of 300 km indicate that the solar zenith angle increases from
approx-imately 61.0◦–66.0◦between 74.0◦–82.0◦N along the
geo-graphic scanning meridian of the ESR near magnetic noon. According to Chapman theory this would produce a gradi-ent in the peak height with latitude that would increase by approximately 18% that of the F-region scale height over the latitude range of interest. This represents only a small increase in peak height along the ESR field-of-view that is consistent with the observations of the TOI (Fig. 2). This gradient may also be attributed to the chemical recombina-tion processes becoming increasingly important at higher lat-itudes where the rate of photoionisation decreases. These loss processes will remove ionisation from lower F-region altitudes much more quickly than at higher altitudes, owing to the much lower neutral particle density, enabling plasma at F-region altitudes to have a lifetime of many hours. In ad-dition to the peak height, the peak density of the F-region is also expected to exhibit a latitudinal gradient with electron
density decreasing with increasing latitude. Simple calcula-tions based on Chapman theory indicate that the ionisation production rate will decrease by some 15% over the lati-tude range of interest, although the observed peak electron density within the TOI remained relatively uniform. There is, however, some evidence for in-situ production by soft-particle precipitation, causing the slight modulation of the large dayside summertime densities. Thus, the uniformity of the peak F-region electron density supports plasma transport from lower latitudes as being important for creating the TOI. The TOI is interrupted in the scan starting 08:32 UT by the appearance of a localised density trough at a latitude of
78.0◦N (∼75.0◦MLAT), commensurate with that of the
pre-noon high-latitude trough of earlier scans. Its appearance
may be attributed to the weak trend in the By component,
with positive values after about 08:30 UT rotating the pre-noon density trough and the entry of the TOI to later MLTs. Modelling studies by Bowline et al. (1996), using the Utah State University TDIM model, investigated the spatial dis-tribution of electron density under IMF Bz<0 conditions for
both IMF By polarities. Figure 7 of their paper, for IMF By
positive, shows the lower densities of the pre-noon trough extending to later MLTs and the TOI entering the polar cap from the post-noon time sector. The reappearance of the un-interrupted TOI in the ESR scan starting at 08:52 UT is then attributed to the radar “catching up” with the TOI at later MLTs.
Within the pre-noon time sector the radar is likely to ob-serve a cross section of the TOI rather than align along the feature. The cross section is first observed north of zenith during the radar scan starting at 07:12 UT and subsequently at lower latitudes and altitudes during successive scans. Al-though this feature is observed at an early UT, the enhance-ment is attributed to an intersection through a mature region of the TOI that had entered the polar cap near the magnetic noon meridian at an earlier time that has subsequently been drawn antisunward by high-latitude convection into the field-of-view of the ESR in the pre-noon sector (see Fig. 8). The low electron temperatures of the enhancement are in accord with plasma produced at an earlier time, and the high altitude of the feature is consistent with recombination processes that remove the plasma from lower F-region altitudes. This effect can be seen in successive scans starting at 07:12 UT, where the altitude of the feature decreases and the density of the enhancement increases as the radar moves towards magnetic noon under a relatively unchanging ionospheric spatial struc-ture.
The TOI cross section in the scan starting 07:12 UT gives a TOI-to-background density of some 2.2, where the peak
value was taken as 5.5×10¹¹m−3 and the background has
been taken at 2.5×10¹¹m−3before the main appearance of
the feature in the scan starting at 06:51 UT. The modelling study of Sojka et al. (1994) investigated polar ionisation patches and their density in relation to the background level.
The patches were created by temporal changes in IMF By,
al-lowing the comparison of their patch-to-background ratio to the TOI-to-background ratio determined in the current study.
For the pertinent summer conditions the model found that patches of high density were most marked between 06:00– 09:00 UT, with a patch-to-background ratio of about 1.5, much lower than the observed value of the current study. The subsequent study of Bowline et al. (1996) that took into
ac-count the polarity of IMF Byand the location of the
observ-ing station, suggested that patches at Ny ˚Alesund were most
marked between the pre-noon to noon time sectors,
specif-ically between 08:00–09:00 UT for positive Byand 07:00–
09:00 UT for negative By (Fig. 7 of Bowline et al., 1996).
In these cases the patch-to-background ratios were 2.4 and 2.2, respectively, in good agreement with that observed in the current study. The modelled ratio is very similar for both
IMF By polarities in the summer, being most marked
gen-erally between 07:00–09:00 UT. This is broadly consistent with the results presented earlier by Sojka et al. (1994), al-though the ratio reported by Bowline et al. (1996) is much higher.
The appearance of the density enhancement in the pre-noon time sector in the ESR radar scan starting at
07:12 UT produces a narrow density trough near 78.0◦N
(∼75.0◦MLAT) with a minimum density of 1.5×10¹¹m−3.
The trough persists during the next radar scan starting at 07:32 UT with normal levels of both the ion and electron temperature. Inspection of SuperDARN and DMSP observa-tions suggests that the trough resides on open, antisunward convecting field lines just north of the OCFLB and region of soft particle precipitation. This is contrary to observations of the high-latitude density trough by ground-based sounding experiments (Whalen, 1989) and radar measurements (Fos-ter and Doupnik, 1984), where it was suggested to occur on sunward convecting field lines. The review paper by Rodger et al. (1992) suggested that the high-latitude trough in the pre-noon time sector may occur near the CRB. Another clas-sification of trough is cited by Rodger et al. (1992) to rep-resent a normal ionosphere between adjacent polar patches. These troughs occur deep in the polar cap with normal val-ues of both electron and ion temperature. It is likely that the trough in the current study falls into the same classification, although in this instance it is not delineated by adjacent po-lar patches but a region of photoionisation constituting the TOI at its poleward edge and a region of structured plasma created by soft precipitation at its equatorward edge.
The transition into the post-noon sector is identified in the ESR scan starting at 09:13 UT, where the TOI exhibits a clear poleward edge at the higher latitudes of the field-of-view. To the north is a density trough, with coincident en-hanced electron temperatures, that is consistent with electron cooling in regions of depleted electron densities (Banks and Kockarts, Academic Press, New York, 1973). The trough
has a minimum density of around 3.5×10¹¹m−3 centered
near 80.0◦N (∼77.0◦ MLAT). This transition into the
post-noon regime is supported by the SuperDARN electric po-tential maps with the radar observing entirely within the dusk convection cell (see Fig. 6d). The transportation of low densities from the nightside by high-latitude convec-tion plays a role in the formaconvec-tion of the trough, consistent
with ground-based observations by Whalen (1987, 1989) and radar measurements by Foster and Doupnik (1984); Foster et al. (1989). The modelled plasma distribution of Bowline et al. (1996) indicates the locations of the pre- and
post-noon high-latitude troughs during positive IMF By
condi-tions around 70.0◦ MLAT and 78.0◦ MLAT, respectively,
some 8.0◦apart. Whilst the observations in the current study
indicate a smaller displacement of around 2.0◦, the pre-noon
trough was clearly at a lower latitude than the post-noon trough.
In summary, the ESR has provided unique observations of the high-latitude large-scale plasma structure in summer un-der conditions of Bz<0, in particular the TOI and the pre- and post-noon high-latitude troughs. These are in general agree-ment with modelling by the Utah State University Group un-der similar conditions. The multi-instrument observations of the current study, and their comparison with the model out-put, indicate the dominance of the high-latitude convection pattern in structuring the plasma. Further observations of the spatial structure of the TOI are required to establish the de-pendance of its location with season, IMF orientation and amount of solar ionisation, and to address the details of the processes responsible for the structuring of plasma.
Acknowledgements. Financial support for the project was provided
by the UK Particle Physics and Astronomy Research Council un-der grant PPA/G/O/2001/00012. The assistance of the University of Tromsø and the Norwegian Polar Research Institute in the to-mographic measurements is gratefully acknowledged. SuperDARN radar facility is funded by National Research Programs of the UK, Sweden, Finland, France, USA, Canada, Japan, South Africa and Australia; the figures presented here were provided by M. Lester from the University of Leicester. EISCAT is an international facility supported by the national science councils of Finland, France, Ger-many, Japan, Norway, Sweden and the United Kingdom. The ACE data were provided by N. Ness and obtained from the CDAWeb, NASA.
Topical Editor M. Lester thanks two referees for their help in evaluating this paper.
References
Anderson, D., Buchau, J., and Heelis, R.: Origin of density en-hancements in the winter polar cap ionosphere, Radio Sci., 23, 513–519, 1988.
Banks, P. and Kockarts, G.: Aeronomy, Academic Press, New York, 1973.
Bowline, M., Sojka, J., and Schunk, R.: Relationship of theoretical patch climatology to polar cap patch observations, Radio Sci., 31, 635–644, 1996.
Buchau, J., Reinisch, B., Weber, E., and Moore, J.: Structure and dynamics of the winter polar cap F region, Radio Sci., 18, 995– 1010, 1983.
Buchau, J., Reinisch, B., Anderson, D., Weber, E., and Dozois, C.: Polar cap plasma convection measurements and their relevance to the modelling of the high-latitude ionosphere, Radio Sci, 23, 521–536, 1988.
Cowley, S.: Excitation of flow in the Earth’s Magnetosphere-Ionosphere system: observations by incoherent-scatter radar, in:
Polar Cap Boundary Phenomenon, edited by Moen, J., Egeland, A., and Lockwood, M., NATO Advanced Study InstituteSeries, Kluwer Academic Press, Dordrecht, The Netherlands, 127–140, 1998.
Cowley, S. and Lockwood, M.: Excitation and decay of So-lar wind-driven flows in the magnetosphere-ionosphere system, Ann. Geophys., 10, 103–115, 1992.
Crowley, G.: Critical review of ionospheric patches and blobs, in: URSI Review of Radio Science 1993–1996, edited by Stone, W. R., published for the International Union of Radio Science by the Oxford University Press, 619–648, 1996.
Foster, J.: Ionospheric signatures of magnetospheric convection, J. Geophys. Res., 89, 855–865, 1984.
Foster, J.: Storm time plasma transport at middle and high latitudes, J. Geophys. Res., 98, 1675–1689, 1993.
Foster, J. and Doupnik, J.: Plasma convection in the vicinity of the polar cusp, J. Geophys. Res., 89, 9107–9113, 1984.
Foster, J., Yeh, H.-C., Holt, J., and Evans, D.: Two-dimensional mapping of dayside convection, in: Electromagnetic Couping in the Polar Clefts and Caps, edited by Sandholt, P. and Egeland, A., Kluwer Academic, Boston, Mass., 115–125, 1989.
Greenwald, R., Baker, K., Ruohoniemi, J., Dudeney, J., Pinnock, M., Mattin, N., Leonard, J., and Lepping, R.: Simultaneous con-jugate observations of dynamic variations in high-latitude
day-side convection due to changes in IMF By, J. Geophys. Res., 95,
8057–8072, 1990.
Kelly, J. and Vickrey, J.: F-region ionospheric structure associated with anti-sunward flow near the dayside polar cusp, Geophys. Res. Lett., 11, 907–910, 1984.
Knudsen, W.: Magnetospheric convection and the high latitude F2 ionosphere, J. Geophys. Res., 79, 1046–1055, 1974.
Lockwood, M. and Carlson, H.: Production of polar-cap electron-density patches by transient magnetopause reconnection, Geo-phys. Res. Lett., 19, 1731–1734, 1992.
Lockwood, M., Sandholt, P., Cowley, S., and Oguti, T.: Interplane-tary magnetic-field control of the dayside auroral activity and the transfer of momentum across the dayside magnetopause, Planet. Space Sci., 37, 1347–1365, 1989.
Moen, J., Evans, D., Carlson, H., and Lockwood, M.: Dayside mov-ing auroral transients related to LLBL dynamics, Geophys. Res. Lett., 23, 3247–3250, 1996.
Moen, J., Lorentzen, D., and Sigernes, F.: Dayside moving auro-ral forms and bursty proton auroauro-ral events in relation to parti-cle boundaires observed by NOAA-12, J. Geophys. Res., A7, 14 855–14 863, 1998.
Moffett, R. and Quegan, S.: The mid-latitude trough in the electron-concentration of the ionospheric F-layer – A review of obser-vations and modeling, J. Atmos. and Terr. Phys., 45, 315–343, 1983.
Newell, P. and Meng, C.-I.: The cusp and the cleft/LLBL: Low-altitude identification and statistical local time variation, J. Geo-phys. Res., A12, 14 549–14 556, 1988.
Newell, P. and Meng, C.-I.: Ion acceleration at the equatorward edge of the cusp: Low-altitude observations of patchy merging, Geophys. Res. Lett., 18, 1829–1832, 1991.
Newell, P. and Meng, C.-I.: Cusp low-energy ion cutoffs: A survey and implications for merging, J. Geophys. Res., 100, 21 943– 21 951, 1995.
Nilsson, H., Kirkwood, S., Eliasson, L., and Norberg, O.: The iono-spheric signature of the cusp: A case study using Freja and the Sondrestrom radar, Geophys. Res. Lett., 21, 1923–1926, 1994. Pryse, S.: Radio tomography: A new experimental technique,
Sur-veys in Geophysics, 24, 1–38, 2003.
Pryse, S., Kersley, L., Williams, M., and Walker, I.: The spatial structure of the dayside ionospheric trough, Ann. Geophys., 16, 1169–1179, 1998,
SRef-ID: 1432-0576/ag/1998-16-1169.
Pryse, S., Sims, R., Moen, J., Kersley, L., Lorentzen, D., and Denig, W.: Evidence for solar production as a source of polar-cap plasma, Ann. Geophys., 22, 1093–1102, 2004,
SRef-ID: 1432-0576/ag/2004-22-1093.
Rodger, A., Moffett, R., and Quegan, S.: The role of ion drift in the formation of ionization troughs in the midlatitude and high-latitude ionosphere – A review, J. Atmos. Terr. Phys., 54, 1–30, 1992.
Rodger, A., Pinnock, M., Dudeney, J., Baker, K., and Greenwald, R.: A new mechanism for polar patch formation, J. Geophys. Res., 99, 6425–6436, 1994.
Ruohoniemi, J. and Greenwald, R.: Statistical patterns of high-latitude convection obtained from Goose Bay HF radar obser-vations, J. Geophys. Res., 101, 21 743–21 763, 1996.
Ruohoniemi, J. and Greenwald, R.: The response of high-latitude convection to a sudden southward IMF turning, Geophys. Res. Lett., 25, 2913–2916, 1998.
Sato, T.: Morphology of ionospheric F2disturbances in the polar
regions, Rep. Ionos. Space Res. Jpn., 13, 91–104, 1959. Sims, R.: Signatures of Magnetospheric Processes in the
High-Latitude Dayside Ionosphere, Ph.D thesis UWA, 2003.
Smith, A., Pryse, S., and Kersley, L.: Polar patches observed by ESR and their possible origin in the cusp region, Ann. Geophys., 18, 1043–1053, 2000,
SRef-ID: 1432-0576/ag/2000-18-1043.
Sojka, J., Bowline, M., and Schunk, R.: Patches in the polar iono-sphere: UT and seasonal dependance, J. Geophys. Res., 99, 14 959–14 970, 1994.
Sotirelis, T., Newell, P., and Meng, C.-I.: Shape of the open-closed boundary of the polar cap as determined from observations of precipitating particles by up to four DMSP satellites, J. Geophys. Res., 103, 399–406, 1998.
Tsunoda, R.: High-latitude F-region irregularities – A review and synthesis, Rev. Geophys., 26, 719–760, 1988.
Walker, I., Moen, J., Mitchell, C., Kersley, L., and Sandholt, P.: Ionospheric effects of magnetopause reconnection observed us-ing ionospheric tomography, Geophys. Res. Lett, 25, 293–296, 1998.
Walker, I., Moen, J., Kersley, L., and Lorentzen, D.: On the possi-ble role of cusp/cleft precipitation in the formation of polar-cap patches, Ann. Geophys., 17, 1298–1305, 1999,
SRef-ID: 1432-0576/ag/1999-17-1298.
Weber, E., Buchau, J., Moore, J., Sharber, J., Livingston, R., Win-ningham, J., and Reinisch, B.: F-layer ionization patches in the polar-cap, J. Geophys. Res., 89, 1683–1694, 1984.
Whalen, J.: Daytime F-layer trough observed on a macroscopic scale, J. Geophys. Res., 92, 2571–2576, 1987.
Whalen, J.: The daytime F-layer trough and its relation to
ionospheric-magnetospheric convection, J. Geophys. Res., 94, 17 169–17 184, 1989.
Whalen, J.: Properties of the F layer plasma in the midday throat ridge and trough, Radio Sci., 29, 219–230, 1994.