Why COVID-19 Silent Hypoxemia Is Baf
fling to Physicians
Martin J. Tobin, Franco Laghi, and Amal JubranDivision of Pulmonary and Critical Care Medicine, Hines Veterans Affairs Hospital and Loyola University of Chicago Stritch School of Medicine, Hines, Illinois
Abstract
Patients with coronavirus disease (COVID-19) are described as exhibiting oxygen levels incompatible with life without dyspnea. The pairing—dubbed happy hypoxia but more precisely termed silent hypoxemia—is especially bewildering to physicians and is considered as defying basic biology. This combination has attracted extensive coverage in media but has not been discussed in medical journals. It is possible that coronavirus has an idiosyncratic action on receptors involved in chemosensitivity to oxygen, but well-established pathophysiological mechanisms can account for most, if not all, cases of silent hypoxemia. These mechanisms include the way dyspnea and the respiratory centers respond to low levels of oxygen, the way the prevailing carbon dioxide tension (PaCO2) blunts the brain’s response
to hypoxia, effects of disease and age on control of breathing, inaccuracy of pulse oximetry at low oxygen saturations, and temperature-induced shifts in the oxygen dissociation curve. Without knowledge of these mechanisms, physicians caring for patients with hypoxemia free of dyspnea are operating in the dark, placing vulnerable patients with COVID-19 at considerable risk. In conclusion, features of COVID-19 that physiciansfind baffling become less strange when viewed in light of long-established principles of respiratory physiology; an understanding of these mechanisms will enhance patient care if the much-anticipated second wave emerges.
Keywords:COVID-19; control of breathing; dyspnea; hypoxemia; pulse oximetry
Case Report Vignettes
Patient MD, a 64-year-old man, tested positive for severe acute respiratory syndrome coronavirus 2 (SARS-CoV-2), and coronavirus disease (COVID-19) was diagnosed. While the patient was receiving 6 L/min oxygen by nasal cannula, his oxygen saturation as measured by pulse oximetry (SpO2) was 68%, and arterial blood gas revealed oxygen tension (PaO2) of37 mm Hg, carbon dioxide tension (PaCO2) of 41 mm Hg, and oxygen saturation (SaO2) of 75%. On questioning, he consistently denied any difficulty with breathing. On examination, he was comfortable and not using accessory muscles of respiration. Comorbidities included diabetes mellitus,
hypertension, coronary artery disease and bypass surgery, left carotid endarterectomy, and renal transplantation.
Patient RM, a 74-year-old man, tested positive for SARS-CoV-2, and COVID-19 was diagnosed. While he was receiving 15 L/min oxygen by reservoir mask, his SpO2 was 62%, and arterial blood gas revealed a PaO2of 36 mm Hg, a PaCO2of 34 mm Hg, and an SaO2of 69%. On questioning, he consistently denied any difficulty with breathing (including while drinking). On examination, he was comfortable and not using accessory muscles of respiration. He did not have any comorbidities.
Patient EF, a 58-year-old man, tested positive for SARS-CoV-2, and COVID-19 was diagnosed. While receiving a high-flow
nasal cannula, his SpO2was 76%, and arterial blood gas revealed a PaO2of 45 mm Hg, a PaCO2of 38 mm Hg, and an SaO2of 83%. On questioning, he consistently denied any difficulty with breathing. On examination, he was comfortable and using his cell phone. He had no known comorbidities.
Background
The Wall Street Journal considers it a medical mystery as to why“large numbers of Covid-19 patients arrive at hospitals with blood-oxygen levels so low they should be unconscious or on the verge of organ failure. Instead they are awake, talking—not struggling to breathe” (1). Science judges
( Received in original form June 3, 2020; accepted in final form June 15, 2020 )
This article is open access and distributed under the terms of the Creative Commons Attribution Non-Commercial No Derivatives License 4.0 (http:// creativecommons.org/licenses/by-nc-nd/4.0/). For commercial usage and reprints, please contact Diane Gern ([email protected]).
Supported by the National Institute of Nursing Research (grant R01-NR016055) and Merit Review Award from the Veterans Administration Research (1 I01 RX002803-01A1).
Correspondence and requests for reprints should be addressed to Martin J. Tobin, M.D., Division of Pulmonary and Critical Care Medicine, Edward Hines Jr. VA Hospital, 111N, 5000 South 5th Avenue, Hines, IL 60141. E-mail: [email protected].
Am J Respir Crit Care Med Vol 202, Iss 3, pp 356–360, Aug 1, 2020 Copyright© 2020 by the American Thoracic Society
Originally Published in Press as DOI: 10.1164/rccm.202006-2157CP on June 15, 2020 Internet address: www.atsjournals.org
the lack of patient discomfort at extraordinarily low blood-oxygen
concentrations as defying basic biology (2). Writing in The New York Times, Dr. Levitan, with 30 years of emergency medicine experience, notes“A vast majority of Covid pneumonia patients I met had remarkably low oxygen saturations at triage—seemingly incompatible with life— but they were using their cellphones . . . they had relatively minimal apparent distress, despite dangerously low oxygen levels” (3). Despite this extensive coverage in the news media, the topic has not been addressed in medical journals.
Several factors explain why oxygen readings and lack of dyspnea in patients with COVID-19 are baffling to physicians, including the effect of hypoxia on the respiratory centers, the effect of PaCO2 on the ventilatory response to hypoxia, the hypoxia threshold that precipitates dyspnea, the limited accuracy of SpO2below 80%, shifts in the oxygen dissociation curve, the tolerance of low oxygen levels, and the definition of hypoxemia.
Dyspnea and Control of
Breathing
Viral infection of the respiratory system typically provokes inflammation and stimulation of sensory receptors, inducing
transmission of afferent impulses to the respiratory centers (4). If the virus involves the alveoli, it may produce hypoxemia (5). The presence of dyspnea would be no physiological surprise in either situation. Surprise would arise only if sensory afferents or hypoxemia elicited significant stimulation of the respiratory centers and the patient did not develop dyspnea (6).
Unpleasant breathing can be recognized only by a patient; it is purely a subjective symptom (6). Caregivers commonly equate physical signs— tachypnea, tachycardia, and facial expression— with dyspnea. This is wrong. Patients vary widely in behavioral responses to discomfort. As with pain, physical signs may overestimate or underestimate patient discomfort (7).
The respiratory centers are exquisitely sensitive to CO2(7). Small increases in
PaCO2rapidly evoke large increases in minute ventilation ( _VE); an increase in
PaCO2of 10 mm Hg produces an amount of respiratory discomfort that cannot be tolerated for even a few minutes (8). Abnormal lung mechanics also provoke dyspnea but considerably less than hypercapnia does (7).
Hypoxemia produces dyspnea through the stimulation of the carotid bodies, which send signals to the medulla oblongata (9). The resulting increase in respiratory center output is transmitted down to the phrenic nerves and diaphragm, causing increased
_VE(10). Heightened medullary center
activity is concurrently transmitted up to the cerebral cortex. It is this cortical projection (corollary discharge) that produces the unpleasant sensation of dyspnea (7).
The ventilatory response to hypoxia is characterized as a hyperbolic curve (11).
_VEis unchanged as PaO2drops from 90 to 60 mm Hg; further decreases in PaO2 provoke an exponential increase in _VE
(Figure 1). Moosavi and colleagues (12) observed that the amount of hypoxia required to induce the ventilatory response to hypoxia is equivalent to that required to induce dyspnea. A fall in end-tidal PO2to less than 60 mm Hg
elicited a strong increase in dyspnea in only half of subjects (12). The ventilatory and dyspnea responses to hypoxia are heavily influenced by the prevailing PaCO2. Severe hypoxia elicits an effective increase in ventilation only when background PaCO2 exceeds 39 mm Hg (12, 13).
We undertook an informal poll of 58 hospitalists, emergency physicians, and intensivists, inquiring whether they had seen patients who might be regarded as having silent hypoxemia or“happy hypoxia” (the term used by newspapers). Of 37
respondents, 15 did not provide useful data. Nineteen patients had arterial blood gas measurements; of these, 16 patients had a PaO2of less than 60 mm Hg and
communicated to a physician that they were not experiencing difficulty with breathing. Seven of the 16 patients had PaCO2concentrations above 39 mm Hg (range, 41–49), which, combined with PaO2 of less than 60 mm Hg, would be expected to induce dyspnea; we considered these patients to have probable silent hypoxemia (see above vignette for patient MD). Nine patients had PaCO2concentrations below 39 mm Hg (range, 29–37), which can blunt the respiratory centers; we do not
categorize these patients as having silent hypoxemia (see patient RM and EF vignettes).
A disproportionate number of patients with COVID-19 are elderly and have diabetes (14). Both factors blunt the response of the respiratory control system to hypoxia. The ventilatory response to hypoxia is decreased by 50% in people older than 65 years (15, 16). Given that the dyspnea response to hypoxia parallels the ventilatory response (12), it is likely that older patients with COVID-19 are more prone to silent hypoxemia. All but two of our seven patients with probable silent hypoxemia were 64 years or older (age range, 59–85 yr). The ventilatory response to hypoxia is decreased by more than 50% in diabetes (17, 18). Individuals with diabetes also have a 1.8-fold impaired ability to perceive respiratory sensations (19). A further confounding factor is the broad range in respiratory drive between individuals (20). The chemical drive to breathe (in response to hypercapnia and hypoxia) exhibits as much as 300–600% variation between one subject and the next (20–23). This wide variability in respiratory drive is another factor that explains why some patients with hypoxia do not develop dyspnea.
Hypoxemia as a Threat to Life
Physicians are fearful of hypoxemia, and many view saturations between 80% and 35 30 25 20 15 10 5 120 100 80 60 40 V E liters/min STPD PAO2 mm Hg Figure 1. The ventilatory response to progressive isocapnic hypoxia in a healthy subject. Little change in _VEis noted until alveolaroxygen tension (PAO2) falls to 60 mm Hg, and
thereafter the response is very steep. Each data
point represents the mean value for PAO2and _VE
for three successive breaths. Adapted by permission from Reference 11. STPD = standard temperature and pressure dry.
85% as life threatening. We served as volunteers in an experiment probing the effect of hypoxemia on breathing patterns; our pulse oximeter displayed an SpO2of 80% for over an hour, and we were not able to sense differences between an SpO2 of 80% and an SpO2 of 90% (24). In investigations on control of breathing and oximeter accuracy, subjects experience an SpO2of 75% (12), or briefly 45% (25), without serious harm. Tourists on drives to the top of Mount Evans near Denver experience oxygen saturations of 65% for prolonged periods; many are comfortable, whereas some sense dyspnea (25).
Pulse Oximetry
Pulse oximetry estimates SaO2 by illuminating the skin and measuring changes in light absorption of oxyhemoglobin and reduced Hb (26). Pulse oximetry–estimated saturation (SpO2) can differ from true SaO2(measured with a CO-oximeter) by as much as64% (5). Pulse oximetry is considerably less accurate at SaO2 of less than 80%, partly because of the challenge in obtaining human calibration data (and guarding of information through trade secrets and patent protection). SpO2 underestimated true SaO2by 7% in all three patients in the
above vignettes. In subjects exposed to profound hypoxemia in a hypobaric chamber, there was a resulting PaO2of 21.6–27.8 mm Hg (27). The mean difference and limits of the agreement between pulse oximetry SpO2and true SaO2 were25.8 6 16%; when SpO2 was displayed as less than 40%, 80% of simultaneous SaO2values were 10% higher (some were 30% higher) (28) (Figure 2).
Pulse oximetry is less reliable in critically ill patients than in healthy volunteers. In critically ill patients, the 95% limit of agreement between SpO2and SaO2 was64.02%, and the difference between SpO2and SaO2over time was not reproducible (in magnitude or direction) (29). Pulse oximetry is less accurate in black than in white patients (2.45 times less accurate at detecting>4% difference between SpO2and SaO2) (30). Claims that patients with COVID-19 had oxygenation levels incompatible with life may have arisen because caregivers are not aware that pulse oximeters are inherently inaccurate at low saturations and further impacted by critical illness and skin pigmentation.
Shifts in Oxygen Dissociation
Curve
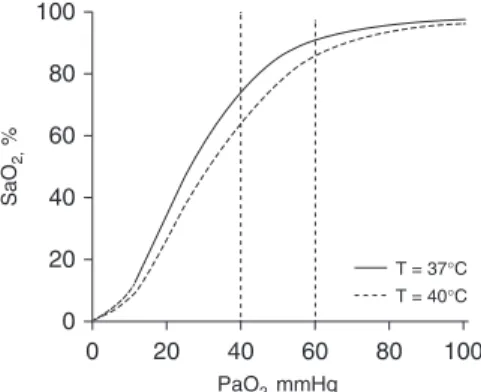
A shift in the oxygen dissociation curve is another confounding factor. Fever, prominent with COVID-19, causes the curve to shift to the right; any given PaO2 will be associated with a lower SaO2 (Figure 3). At a temperature of 378C, a PaO2 of 60 mm Hg (at normal pH and PaCO2) will be accompanied by an SaO2 of 91.1%. Temperature elevation to 408C will produce an SaO2of 85.8% (5.3% decrease) (31). Respective numbers for a PaO2of 40 mm Hg are an SaO2 of 74.1% at a temperature of 378C and an SaO2of 64.2% at a temperature of 408C (9.9% decrease) (31). These shifts produce substantial desaturations without change in chemoreceptor stimulation (because carotid bodies respond only to PaO2and not SaO2) (9)—another factor contributing to silent hypoxemia.
Mechanism of Silent
Hypoxemia
Given that patients with COVID-19 exhibit several unusualfindings, it is possible the
virus has an idiosyncratic effect on the respiratory control system.
ACE 2 (angiotensin-converting enzyme 2), the cell receptor of SARS-CoV-2, the virus responsible for COVID-19, is expressed in the carotid body, the site at which chemoreceptors sense oxygen (32). ACE2 receptors are also expressed in nasal mucosa. Anosmia-hyposmia occurs in two-thirds of patients with COVID-19 (33), and the olfactory bulb provides a passage along which certain coronaviruses enter the brain (34). Whether SARS-CoV-2 gains access to the brain through the olfactory bulb and contributes to the association between anosmia-hyposmia and dyspnea (33) and whether ACE2 receptors play a role in the depressed dyspnea response in COVID-19 remain to be determined.
Science (2) links silent hypoxemia with the development of thrombi within the pulmonary vasculature. Increased
thrombogenesis has been noted in patients with COVID-19 (35). Thrombi within the pulmonary vasculature can cause severe hypoxemia, and dyspnea is related to pulmonary vascular obstruction and its consequences (36). Dyspnea can also arise from the release of histamine or stimulation of juxtacapillary receptors within the pulmonary vasculature. No biological mechanism exists, however, whereby thrombi in the pulmonary vasculature cause blunting of dyspnea (producing silent hypoxemia). 40 50 60 70 80 90 100 SaO2 % S pO 2 % 100 40 20 60 80 0
Figure 2. Scatterplot of the relationship between estimated oxygen saturation from pulse
oximetry (SpO2) and SaO2from blood gas analysis
in healthy subjects exposed to profound
hypoxemia in a hypobaric chamber (PaO2,
21.6–27.8 mm Hg). Each subject is represented by a different symbol. The dashed line is the line of identity, and the solid line is the regression line. Adapted by permission from Reference 28.
0 20 40 60 80 100 PaO2, mmHg SaO 2, % 100 40 20 60 80 0 T = 37qC T = 40qC
Figure 3. Relationship between arterial oxygen
tension (PaO2) and percentage saturation of
hemoglobin with oxygen (SaO2) at temperature
378C (continuous line) and 408C (dashed line),
with a constant pH 7.40 and PCO2of 40 mm Hg
(generated with digital subroutine of Kelman
[31]). At a PaO2of 60 mm Hg, SaO2is 91.1% at
378C and decreases to 85.8% at 408C. At a PaO2
of 40 mm Hg, SaO2is 74.1% at 378C and
De
finition of Hypoxemia
Stedman’s Medical Dictionary defines hypoxemia as“subnormal oxygenation of arterial blood, short of anoxia” (37). Clinicians, however, need to be mindful of the inverse relationship between PaO2and age; a PaO2of 66 mm Hg can be normal in an 80-year-old person (38, 39). In the 1990s, hypoxemia was commonly viewed as low PaO2, and FIO2was excluded from consideration (40, 41). Pierson, for example, specified that a mechanically ventilated patient with acute respiratory distress syndrome receiving 100% oxygen and a PaO2of 80 mm Hg should not be labeled hypoxemic (42).There is, of course, no pure essentialist definition of hypoxemia—merely a usage (40). To arrive at a present-day nominalist definition of hypoxemia, it appears that few physicians view hypoxemia in the same manner as Pierson. In our informal poll of physicians caring for patients with
COVID-19, we specified “I am NOT looking for oxygen requirements, like the number of liters being delivered.” Yet 77.3% of the respondents provided considerable detail on the amount of supplemental oxygen, and 36.4% viewed an SpO2of 90% or higher as compatible with hypoxemia. Although a more detailed investigation is necessary, it appears that physicians today commonly define hypoxemia in terms of the amount of oxygen being supplied to a patient.
Judging severity of hypoxemia on the basis of supplemental oxygen is inherently problematic because FIO2is impossible to estimate unless a patient is intubated or breathing room air. With a nasal cannula at 2 L/min, FIO2ranges between 24% and 35% (43). To minimize risk of hypoxemia, physicians frequently prescribe oxygen at an amount far exceeding physiological needs. Given theflatness of the upper oxygen dissociation curve, a pulse oximetry reading of 95% can signify a PaO2of
anywhere between 60 and 200 mm Hg (26, 44)—values that signify markedly different amounts of gas-exchange impairment, especially in a patient receiving a high FIO2.
Given that hypoxemia is at the very heart of the most severe cases of COVID-19, one wonders if the lack of a widely accepted definition of hypoxemia contributes to some of the confusion and counterclaims associated with the disease.
In conclusion, COVID-19 has engendered many surprises, but features that baffle physicians are less strange when contemplated through the lens of long-established principles of respiratory physiology (45).n
Author disclosures are available with the text of this article at www.atsjournals.org.
Acknowledgment: The authors thank Dr. Marina Saad for the construction of the oxygen dissociation curve based on the digital subroutine of Kelman.
References
1. Toy S, Roland D. Some doctors pull back on using ventilators to treat Covid-19. The Wall Street Journal 2020 May 11.
2. Couzin-Frankel J. The mystery of the pandemic’s ‘happy hypoxia’.
Science 2020;368:455–456.
3. Levitan R. The infection that’s silently killing coronavirus patients. The New York Times 2020 Apr 20.
4. Preas HL II, Jubran A, Vandivier RW, Reda D, Godin PJ, Banks SM, et al. Effect of endotoxin on ventilation and breath variability: role of cyclooxygenase pathway. Am J Respir Crit Care Med 2001;164:620–626. 5. Tobin MJ. Basing respiratory management of COVID-19 on physiological
principles. Am J Respir Crit Care Med 2020;201:1319–1320.
6. Tobin MJ. Dyspnea: pathophysiologic basis, clinical presentation, and management. Arch Intern Med 1990;150:1604–1613.
7. Banzett RB, Similowski T, Brown R. Addressing respiratory discomfort in the ventilated patient. In: Tobin MJ, editor. Principles and practice of mechanical ventilation, 3rd ed. New York: McGraw-Hill Inc.; 2012. pp. 1265–1280.
8. Banzett RB, Lansing RW, Evans KC, Shea SA. Stimulus-response characteristics of CO2-induced air hunger in normal subjects. Respir Physiol 1996;103:19–31.
9. Tobin MJ, Laghi F, Jubran A. Ventilatory failure, ventilator support, and ventilator weaning. Compr Physiol 2012;2:2871–2921.
10. Tobin MJ, Gardner WN. Monitoring of the control of ventilation. In: Tobin MJ, editor. Principles and practice of intensive care monitoring, New York: McGraw-Hill, Inc.; 1998. pp. 415–464. 11. Weil JV, Byrne-Quinn E, Sodal IE, Friesen WO, Underhill B, Filley GF,
et al. Hypoxic ventilatory drive in normal man. J Clin Invest 1970;49:
1061–1072.
12. Moosavi SH, Golestanian E, Binks AP, Lansing RW, Brown R, Banzett RB. Hypoxic and hypercapnic drives to breathe generate equivalent levels of air hunger in humans. J Appl Physiol (1985) 2003;94: 141–154.
13. Mohan R, Duffin J. The effect of hypoxia on the ventilatory response to
carbon dioxide in man. Respir Physiol 1997;108:101–115. 14. Richardson S, Hirsch JS, Narasimhan M, Crawford JM, McGinn T,
Davidson KW, et al.; and the Northwell COVID-19 Research Consortium. Presenting characteristics, comorbidities, and
outcomes among 5700 patients hospitalized with COVID-19 in the New York City area. JAMA 2020;323:2052–2059.
15. Kronenberg RS, Drage CW. Attenuation of the ventilatory and heart rate responses to hypoxia and hypercapnia with aging in normal men.
J Clin Invest 1973;52:1812–1819.
16. Peterson DD, Pack AI, Silage DA, Fishman AP. Effects of aging on ventilatory and occlusion pressure responses to hypoxia and
hypercapnia. Am Rev Respir Dis 1981;124:387–391.
17. Nishimura M, Miyamoto K, Suzuki A, Yamamoto H, Tsuji M, Kishi F, et al. Ventilatory and heart rate responses to hypoxia and hypercapnia in patients with diabetes mellitus. Thorax 1989;44: 251–257.
18. Weisbrod CJ, Eastwood PR, O’Driscoll G, Green DJ. Abnormal ventilatory responses to hypoxia in Type 2 diabetes. Diabet Med 2005;22:563–568.
19. O’Donnell CR, Friedman LS, Russomanno JH, Rose RM. Diminished perception of inspiratory-resistive loads in insulin-dependent diabetics. N Engl J Med 1988;319:1369–1373.
20. Tobin MJ, Mador MJ, Guenther SM, Lodato RF, Sackner MA. Variability of resting respiratory drive and timing in healthy subjects. J Appl Physiol (1985) 1988;65:309–317.
21. Swenson ER, Duncan TB, Goldberg SV, Ramirez G, Ahmad S, Schoene RB. Diuretic effect of acute hypoxia in humans: relationship to hypoxic ventilatory responsiveness and renal hormones. J Appl Physiol (1985) 1995;78:377–383.
22. Matsuzawa Y, Fujimoto K, Kobayashi T, Namushi NR, Harada K, Kohno H, et al. Blunted hypoxic ventilatory drive in subjects susceptible to high-altitude pulmonary edema. J Appl Physiol (1985) 1989;66:
1152–1157.
23. McGurk SP, Blanksby BA, Anderson MJ. The relationship of hypercapnic ventilatory responses to age, gender and athleticism.
Sports Med 1995;19:173–183.
24. Jubran A, Tobin MJ. Effect of isocapnic hypoxia on variational activity
of breathing. Am J Respir Crit Care Med 2000;162:1202–1209.
25. Bickler PE, Feiner JR, Lipnick MS, Batchelder P, MacLeod DB, Severinghaus JW. Effects of acute, profound hypoxia on healthy humans: implications for safety of tests evaluating pulse oximetry or tissue oximetry performance. Anesth Analg 2017; 124:146–153.
26. Jubran A. Pulse oximetry. In: Tobin MJ, editor. Principles and practice of intensive care monitoring, New York: McGraw-Hill, Inc.; 1998. pp. 261–287. 27. Ottestad W, Hansen TA, Pradhan G, Stepanek J, Høiseth LØ, K˚asin JI. Acute hypoxia in a simulated high-altitude airdrop scenario due to oxygen system failure. J Appl Physiol (1985) 2017;123:1443–1450.
28. Ottestad W, K˚asin JI, Høiseth LØ. Arterial oxygen saturation, pulse
oximetry, and cerebral and tissue oximetry in hypobaric hypoxia. Aerosp Med Hum Perform 2018;89:1045–1049.
29. Van de Louw A, Cracco C, Cerf C, Harf A, Duvaldestin P, Lemaire F, et al. Accuracy of pulse oximetry in the intensive care unit. Intensive Care Med 2001;27:1606–1613.
30. Jubran A, Tobin MJ. Reliability of pulse oximetry in titrating supplemental oxygen therapy in ventilator-dependent patients. Chest 1990;97:1420–1425.
31. Kelman GR. Digital computer subroutine for the conversion of oxygen tension into saturation. J Appl Physiol 1966;21:1375–1376. 32. Fung ML. Expressions of angiotensin and cytokine receptors in the
paracrine signaling of the carotid body in hypoxia and sleep apnea.
Respir Physiol Neurobiol 2015;209:6–12.
33. Sedaghat AR, Gengler I, Speth MM. Olfactory dysfunction: a highly prevalent symptom of COVID-19 with public health significance. Otolaryngol Head Neck Surg 2020;5:194599820926464.
34. Netland J, Meyerholz DK, Moore S, Cassell M, Perlman S. Severe acute respiratory syndrome coronavirus infection causes neuronal death in the absence of encephalitis in mice transgenic for human ACE2. J Virol 2008;82:7264–7275.
35. Wichmann D, Sperhake J-P, L ¨utgehetmann M, Steurer S, Edler C,
Heinemann A, et al. Autopsyfindings and venous thromboembolism
in patients with COVID-19: a prospective cohort study. Ann Intern Med [online ahead of print] 6 May 2020; DOI: 10.7326/M20-2003. 36. Sanchez O, Caumont-Prim A, Riant E, Plantier L, Dres M, Louis B, et al.
Pathophysiology of dyspnoea in acute pulmonary embolism: a cross-sectional evaluation. Respirology 2017;22:771–777.
37. Stedman, Lathrop T. Stedman’s medical dictionary, 25th ed. Baltimore: Williams & Wilkins; 1990. p. 756.
38. Sorbini CA, Grassi V, Solinas E, Muiesan G. Arterial oxygen tension in relation to age in healthy subjects. Respiration 1968;25:3–13. 39. Malmberg P, Hedenstr ¨om H, Fridriksson HV. Reference values for gas
exchange during exercise in healthy nonsmoking and smoking men.
Bull Eur Physiopathol Respir 1987;23:131–138.
40. West JB. Pulmonary pathophysiology. Baltimore: Williams and Wilkins; 1977. p. 158.
41. Murray JF. The normal lung, 2nd ed. Philadelphia: WB Saunders; 1986. p. 253.
42. Pierson DJ. Pathophysiology and clinical effects of chronic hypoxia. Respir Care 2000;45:39–51, [Discussion pp, 51–53.]
43. Bazuaye EA, Stone TN, Corris PA, Gibson GJ. Variability of inspired oxygen concentration with nasal cannulas. Thorax 1992;47:609–611. 44. Severinghaus JW. Simple, accurate equations for human blood O2
dissociation computations. J Appl Physiol Respir Environ Exerc Physiol 1979;46:599–602.
45. Tobin MJ. Why physiology is critical to the practice of medicine: a 40-year personal perspective. Clin Chest Med 2019;40:243–257.