RESEARCH OUTPUTS / RÉSULTATS DE RECHERCHE
Author(s) - Auteur(s) :
Publication date - Date de publication :
Permanent link - Permalien :
Rights / License - Licence de droit d’auteur :
Institutional Repository - Research Portal
Dépôt Institutionnel - Portail de la Recherche
researchportal.unamur.be
University of Namur
Rearing conditions and life history influence the progress of gametogenesis and
reproduction performances in pikeperch males and females
Khendek, A.; Chakraborty, A.; Roche, J.; Ledoré, Y.; Personne, A.; Policar, T.; Zarski, D.;
Mandiki, R.; Kestemont, P.; Milla, S.; Fontaine, P.
Published in: Animal DOI: 10.1017/s1751731118000010 Publication date: 2018 Document Version
Publisher's PDF, also known as Version of record Link to publication
Citation for pulished version (HARVARD):
Khendek, A, Chakraborty, A, Roche, J, Ledoré, Y, Personne, A, Policar, T, Zarski, D, Mandiki, R, Kestemont, P, Milla, S & Fontaine, P 2018, 'Rearing conditions and life history influence the progress of gametogenesis and reproduction performances in pikeperch males and females', Animal, vol. 12, no. 11, pp. 2335-2346.
https://doi.org/10.1017/s1751731118000010
General rights
Copyright and moral rights for the publications made accessible in the public portal are retained by the authors and/or other copyright owners and it is a condition of accessing publications that users recognise and abide by the legal requirements associated with these rights. • Users may download and print one copy of any publication from the public portal for the purpose of private study or research. • You may not further distribute the material or use it for any profit-making activity or commercial gain
• You may freely distribute the URL identifying the publication in the public portal ? Take down policy
If you believe that this document breaches copyright please contact us providing details, and we will remove access to the work immediately and investigate your claim.
Rearing conditions and life history in
fluence the progress of
gametogenesis and reproduction performances in pikeperch
males and females
A. Khendek
1, A. Chakraborty
1, J. Roche
1, Y. Ledoré
1, A. Personne
1, T. Policar
2, D.
Z˙arski
3,
R. Mandiki
4, P. Kestemont
4, S. Milla
1†and P. Fontaine
11University of Lorraine, UR AFPA, USC 340 INRA Vandoeuvre-Lés-Nancy, F-54506 France;2Faculty of Fisheries and Protection of Waters, South Bohemian Research Center of Aquaculture and Biodiversity of Hydrocenoses, University of South Bohemia in Ceske Budejovice, Zatisi 728/II, 389 25 Vodnany, Czech Republic; 3Department of Ichthyology, Faculty of Environmental Science, University of Warmia and Mazury, 10-719 Olsztyn, Poland;4Research Unit in Environmental and Evolutionary Biology (URBE), NARILIS, University of Namur (FUNDP), Rue de Bruxelles 61, B-5000 Namur, Belgium
(Received 21 June 2017; Accepted 9 December 2017; First published online 8 February 2018)
Pikeperch (Sander lucioperca) is a highly valuablefish in Europe. However, development of aquaculture of pikeperch is highly limited due to seasonality of production. This can be overcome by the controlled reproduction of domesticatedfish. The first steps of domestication process may induce changes at anatomical, physiological and molecular levels, thereby affecting a variety of biological functions. While there is abundant literature on their effects on stress and growth for example, these effects on
reproduction received limited attention notably in pikeperch, a promising candidate for the development of aquaculture. To answer the question of this life-history effect on pikeperch’s reproduction, we compared two groups (weight: 1 kg) originated from Czech Republic and with the same domestication level (F0). Thefirst group was a recirculating aquatic system cultured one (2 years, previously fed with artificial diet, never exposed to natural changes in temperature/photoperiod conditions) and the second one was a pond cultured group (3 to 4 years, bred under natural feeding and temperature/photoperiod). The wild group successfully spawned, while the farmed one did not spawn at all. During the program, gonadosomatic indexes of both males and females were significantly higher for the wild fish, as well as the sexual steroids. Gene expression analysis revealed significantly lower LH transcript levels at the pituitary level for the farmed females and lower FSH transcript levels at the pituitary level for the males. In conclusion this study showed that the previous rearing conditions (e.g. culture system, age, diet, etc.) alter the further progress of gametogenesis and the reproductive performances in response to controlled photothermal program for both sexes in pikeperch.
Keywords: domestication, reproduction, oogenesis,Sander lucioperca, gonadotropic axis
Implications
This work gives information about the effect of broodstock’s life history on reproduction and will help producers to choose good broodstock groups (wild or farmed) to have optimal reproductive performances in pikeperch, and thus improve fish production.
Introduction
PikeperchSander lucioperca(L.) belongs to the percid family and is now produced in recirculating aquatic system (RAS) for human consumption (Steenfeldt et al., 2010). This species is also very popular among recreational fishermen.
Consequently, this species has recently become the subject of intense research efforts to develop methods for out-of-season spawning in order to increase fry availability over the year (Fontaineet al., 2015). The induction of out-off season spawning requires properly adjustedfluctuations of thermal and light conditions (Fontaine et al., 2015). It also requires the relevant choice of broodstock to positively respond to photothermal variations. Appealing to wild or captivefish for producing the next generations is a paramount importance criterion as domestication may impact the quality of zootechnical performances infish.
Still, domestication process starts from the transfer offish from the wild to captive conditions (Policar et al., 2016). Then the fish experience acclimation to this breeding system and in case of suitable conditions, are able to grow and reproduce. Then, the domestication is characterized by
successive generations in captivity. By comparing two different generations offish, domestication has been shown to induce changes at anatomical, physiological and mole-cular levels thereby affecting a variety of biological functions infish (Brummettet al., 2004). Globally domestication makes fish less fearful and reduces fish stress response (Vandeputte and Prunet, 2002; Douxfils et al., 2011), and boosts the growth performances (Hassin et al., 1997; Tymchuk et al., 2006). However, the effects of domestication process on reproduction are quite complex to delineate and there is a variability of response depending on the species and even for the same fish species. Very similar trends were confirmed in Eurasian perch (Perca fluviatilis) when wild populations provided significantly higher hatching rate 62% compared with farmed perch with 27.9% (Křisťanet al., 2012). A more recent study on Eurasian perch showed a negative effect of domestication on embryo survival, hatching and percentage of malformation rates (Khendek et al., 2017). In the ide (Leuciscus idus), Krejszeffet al.(2009) showed that domes-tication exhibited a negative effect on embryo survival. More recently, a study on the same species showed different results by pointing out a lower ovulatory response to OvopelTM in the pond-cultured group compared with wild fish (Ciesla et al., 2013) and no domestication effect was observed on the embryo survival. These differences of reproductive performances between wild and farmed groups can be due to acclimatization step, with a direct effect of the changes in environmental rearing conditions like artificial photothermal kinetics or commercial diet or other extrinsic factors (Fontaineet al., 2015). These differences can also be stemmed from genetic modifications, over generations in response to breeding conditions (Vandeputte and Prunet, 2002). But there are a few published works showing if these domestication effects are due to early life-history conditions in captivity or progressive adaptation to rearing systems generations after generation.
Fish, under the domestication process is exposed to very highly modified living conditions in comparison with its wild counterparts. This includes differences in confinement, water quality, food quality, photothermal conditions, and so one. All these features of the captive systems may influence reproduc-tive cycle. Exposure to a variety of stressors linked to husbandry practices may alter reproductive physiology, food composition of formulated ingredients may influence gonadal development and composition of the eggs. Finally, temperature and photo-period which are the main drivers of the reproductive cycle greatly influence reproduction, though it implies a perfect knowledge of the photothermal parameters for a successful reproduction. The data on the proper environmental conditions to be applied in pikeperch farmed broodstock is very limited and is based mostly on the protocols developed for Eurasian perch, a closely related species. These protocols involve a long phase (5 months) of wintering period where low temperature (6°C) and short photoperiod (8 h) should be applied (Fontaine
et al., 2015). However, recent published data suggest that the photothermal parameters for pikeperch could be of different nature than the ones used for Eurasian perch.
So far, it is not clear to what extent the rearing and husbandry conditions alters the reproductive performance of farmed pikeperch, what can be answered only by comparative study involving analysis of reproductive physiology and gonadal development of two groups (wild and farmed) in response to typical photothermal program allowing induction of gonadal development. The aim of this study was to compare gametogenesis and reproductive performance in response to photo-thermal induction of gonadal cycle of two pikeperch groups having the same geographical origin (Czech Republic) and the same generational level F0 (filialis0), but having different life histories, including environmental condi-tions and feeding regimes they were exposed to.
Material and methods
Fish
In this experiment, two groups of F0 pikeperch were studied (wild and farmed) both originated from polyculture ponds of the Czech production farm Fishery Nove Hrady Ltd. (Czech Republic). The wild broodstock directly after their spawning were taken directly from mentioned polyculture pond in Czech Republic at the average age of 4 years (calculated by scalimetry) and an average weight of 1 kg, they were fed with preyfish (roach –Rutilus rutilusand rudd–Scardinius erythrophthalmus) ad libitum. They were transferred to our Aquaculture Experimental Platform (AEP) facilities located at the Faculty of Sciences of the University of Lorraine (France). The farmed broodstock of this study were produced by the same wild broodstock originated from the Czech production farm Fishery Nove Hrady Ltd. (Czech Republic). Fish were transported and spawned for a production of 2 g juveniles in the facilities of the company Excellence Fish Ltd. located in Horst, the Netherlands. After that, juveniles were transferred to the facilities of the company Asialor Ltd. located at Dieuze, France. They were raised and fed with a commercial diet (Le Gouessant, France; composition: proteins 47%, lipids 13%, ash 6.9% andfiber 2.2%) until an average weight of 1 kg and transferred to the AEP facilities at the age of 2 years. Broodstock of both groups were transferred to the AEP facilities on July 4, 2014, each group was placed in 2 m3 tanks (three tanks per group with 25 fish per each tank) under the same environmental conditions (22°C of tem-perature and 16L8D of photoperiod) for acclimatization during 3 weeks. Fish were fed with same foragefish (roach and rudd) during the acclimatization period and the experi-ment. Fish were handled in accordance with national and international guidelines for protection of animal welfare (agreement number C5454718). Two wild fish and three farmed ones died during the whole experiment.
Experimentation and water quality management
The experimentation started on July 25, 2014. At the beginning of the experiment,fish weight ranged between 940 and 1354 g for the farmedfish and 747 and 1812 g for the wild ones and total length ranged between TL= 430 and 560 mm. There were 40 wild females and 35 males for the wild group and
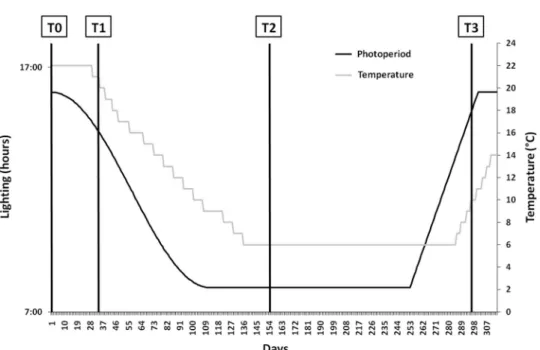
33 females and 42 males for the farmed group. Both groups were exposed to a photothermal program enable to induce and drive the gonadogenesis (Fontaineet al., 2015; Figure 1).
In each tank, water quality was measured three times per week. pH was maintained between 7.0 and 7.5 by NaCO3
additions. The dissolved oxygen was maintained over of 6 mg/l. The concentrations of total ammonia and nitrite nitrogen were measured using a CARY I spectrophotometer and remained always below 1 mg/l.
Fish were sampled at days 0 (T0), 32 (T1), 153 (T2) and 290 (T3) after the start of the photothermal program (Figure 1). Threefish per tank were caught in all the six tanks (three tanks per group) at thefirst sampling period (T0). For the other samplings, at leastfive fish were caught at each sampling date from each tank (15fish per group) to get at least sixfish per group and per sex (no obvious phenotypic sexual differentiation). At each sampling date, fish were anesthetized into a Tricaine methanesulfonate (MS-222) bath (150 mg/l; Sigma, Saint Quentin Fallavier, France). Blood was sampled from the caudal vein using a syringe, then stored on ice in heparinized microtubes until cen-trifuged at 4500 rpm for 10 min (Centrifuge Jouan C-412). Aliquots of plasma were stored at−80°C until ELISA analysis was performed. Then, eachfish was euthanatized by over-anesthetizing in Tricaine methanesulfonate (MS-222) bath (300 mg/l), weighted and dissected for gonad and liver weighting and calculation of the gonadosomatic index (GSI= 100 × gonad weight/total fish weight, %). For gene expression analysis, the whole brain and pituitary gland were snap frozen in liquid nitrogen and stored at−80°C.
Gonadal histology
Samples of ovaries were stored in a Bouin-Holland solution for 1 week, washed once with water, twice with 70% ethanol
and stored in absolute ethanol (Abdulfatah et al., 2011). Then, fragments of gonads were cut into 6-mm-thick slices, dehydrated with OTTIX solution (DIAPATH SpA, Italy/MM France) and embedded in a paraffin substitute dubbed Diawax (DIAPATH SpA, Italy/MM France) (adapted from Langeron, 1942). Sections of 6µm were cut from the Diawax block and stained with a Masson’s trichrome–hematoxylin Gill III (Merck, Darmstadt, Germany), 0.5% phloxine B (VWR, California, USA) and 0.5% light green (Sigma) according to Rinchard and Kestemont (1996). The stage of oocyte devel-opment was determined according to Wallace and Selman (1981). Observations have been completed with a light upright optical microscope (Nikon Eclipse Ni-U), Nikon BR software (Nikon France, Champigny sur Marne, France).
For males, samples of the gonads were stored in a Bouin-Holland solution for 1 week, washed once with water, twice with 70% ethanol and stored in absolute ethanol. Sections of 4µm were cut from the Diawax block and stained with a trichrome: Regaud iron hematoxylin (solution from crystal-line hematoxylin Merck), 1% Ponceau-Fushine of Masson (Sigma) and 0.1% light green (Sigma). Testis development was monitored according to the presence of different germ cell types according to Ben Ammaret al. (2015). The profile
of testis stages was evaluated by counting the relative per-centage of the cells obtained for each stage from six slides per each male. At each sampling time, the percentage values of six males per group were combined to obtain a mean percentage value for each stage.
Total RNA extraction and reverse transcription
Total RNA was extracted from the brain and pituitary using TRIzol reagent (VWR, CTRIZ02) according to the manufacturer’s protocol. Concentration of total RNA was measured by UV absorption spectrometry using a Jasco
Figure 1 The photothermal program used for the induction of the reproductive cycle in pikeperch broodstock (adapted from Fontaineet al., 2015). Sampling times (T0, T1, T2 and T3) correspond respectively to days 0, 32, 153 and 295 after the beginning of the photothermal program.
V-630 Spectrophotometer. DNase treatment (DNase I Thermo Fischer Scientific, EN0521) was performed according to manufacturer’s recommendations. Reverse transcription was performed with M-MLV reverse transcriptase (M1302, Sigma) according to the manufacturer’s recommendations. For each sample 1µg of total RNA was used. Reaction mixes have been done following manufacturer’s recommendations. Each reverse transcription mix was incubated at 37°C for 50 min and then heated at 90°C for 10 min, c-DNA samples werefinally kept at −80°C.
Gene expression analysis
Primers were designed based on a multiple alignment of sequences (Supplementary Material Table S1) available in the NCBI database, targeting conserved regions of the FSHb subunit, the gonadotropin-releasing hormone 3 (GnRH3) and theβ-actin as thefirst housekeeping gene. Primers sequen-ces of the LHb subunit gene and the RPL8 as the second housekeeping gene were found in the publication of Hermelinket al. (2011). In order to isolate and to sequence pikeperch FSHb subunit and the GnRH3 cDNAs from the brain, a PCR reaction was performed. Polymerase chain reaction conditions were as follows: denaturing cycle of 95°C for 2 min, followed by 35 cycles of 95°C for 1 min, 58°C for 1 min, 72°C for 1 min, followed by afinal elongation step of 72°C for 5 min.
Real-time PCR was carried out with a StepOne Plus q-PCR Cycler (4376600; Applied Biosystems, Foster City, CA, USA) using QUANTA SYBR green reagent (VWR, 733-1382) in a 20µl reaction volume (5 µl diluted cDNA, 2.5 µl (600 nM) of each primer, 10µl of twofold diluted SYBR-Green solution) under the following conditions: 95°C initial denaturation for 10 min, followed by 40 cycles of 95°C denaturation for 30 s, 60°C primer annealing and extension for 1 min. All PCRs were run in duplicate. Expression was determined by the comparative CT method (DDCT) considering diluted calibrator samples (pooled brain or pituitary cDNA).
A melting curve analysis was carried out to ensure assay specificity. The absence of amplified genomic DNA was validated by comparing the CT obtained in samples with and without DNase treatments and by designing the primers on two different exons. Samples were normalized to the geometric mean ofβ-actin and RPL8 mRNAs.
Hormone assays
Concentration of 17β-estradiol (E2, ng/ml) was assayed on 50µl of plasma using the DIAsource E2-ELISA kit (DIAsource, KAP0621). When necessary, dilution from 1/20 to 1/70 of the plasma samples was performed. Sensitivity was 5 pg/ml. Coefficient of variation intra-assays varied between 3.1% and 2.6% and CV inter-assays varied between 4.7% and 2.4% for low and high levels, respectively. Testosterone (T, ng/ml) was assayed on 25µl of plasma using the DIAsource Testosterone ELISA Kit (DIAsource, KAPD1559). When necessary, a dilution 1/2 of the plasma samples was performed. Sensitivity was 83 pg/ml, CV intra-assays varied between 1.5% and 9.5% and CV inter-assays varied between
7.6% and 8.7% for low and high levels, respectively. The androgen 11-ketotestosterone (11-KT, ng/ml) was assayed on 50µl of plasma diluted 1/50 in ELISA buffer using the Cayman 11-keto Testosterone EIA Kit (Cayman, 582751) and sensitivity was 1.3 pg/ml. CV intra-assays varied between 2.6% and 8.4% and CV inter-assays varied between 9.4% and 12.1% for low and high levels, respectively.
Plasma 17,20β-dihydroxy-4-pregnen-3-one (DHP, ng/ml) was assayed using radioimmunoassay according to Fostier and Jalabert (1986) adapted by Mandiki et al. (2005), fol-lowing two extractions with cyclohexane/ethyl acetate (v/v). The DHP antibody was provided by Dr A. Fostier (INRA, Rennes, France). Coefficient of variation intra-assay was 5.89%.
Cortisol was assayed on 20µl of plasma using the DIA-source Cortisol ELISA Kit (DIADIA-source, KAPDB 270). The intra-assay CV was 5.6%, the inter-intra-assay CV was 6.9%. The detection limit was 2.5 ng/ml.
Reproductive performances
Spawning season started on June 1, 2015 and finished on July 3, 2015. The oocyte maturity stage was determined
in vivo, every day during the spawning season by sampling eggs with a catheter on females under anesthesia (MS-222, 150 mg/l). The samples were placed in a fixative (Serra’s solution: ethanol/formalin/glacial acetic, 6 : 3 : 1 v/v) and were then evaluated according to the classification of Z˙arski
et al. (2012). When a female was ovulating, the eggs were collected by stripping then weighed and then fertilized with the dry method. The eggs from one female were fertilized with the milt of three males from the same tanks. After fertilization, the adhesiveness was removed from the eggs with a tannic acid solution (0.75 g/l, adhesive removal time 2 min; Ref: 403040, Sigma-Aldrich). The eggs were then transferred into incubators and maintained at constant temperature (13.0 ± 0.5°C). The eggs were incubated in a hatchery station within artificial nests. Into each nest, a sample of ~200 eggs was incubated.
After 24, 48, 72 and 120 h post egg fertilization, in each nest the exact number of eggs was calculated. Fertilization rate was checked by counting the number of developed embryos by comparison with the total number of the eggs in each nest. Hatching rate was calculated by comparing the number of hatched larvae relatively to the initial number of eggs in the nest. Hatching started at 10 days post egg ferti-lization. Larvae were analyzed for malformations (sclerosis, lordosis, yolk bag malformations in %) with a binocular microscope, onfixed embryos.
Statistical analysis
Data are expressed as mean ± standard deviation with indi-vidualfish as the experimental unit. Normality and homo-geneity of variances were tested using Shapiro–Wilk and Levene test, and data were either log-transformed or arcsin square-root transformed (for data expressed in percentage) when needed. When data respected the assumptions of normality, a two-way ANOVA with two independent factors
(group and time) was performed followed by LSDpost hoc
tests to identify significant differences. The level of sig-nificance used in all tests wasP< 0.05. When data were not
normally distributed, a Kruskal–Wallis test was performed followed by the nonparametric Mann–Whitney U-test. All statistical analyses were performed using the STATISTICA software (StatSoft, Tulsa, OK, USA).
Results
Gonadosomatic index and gonadal development stages
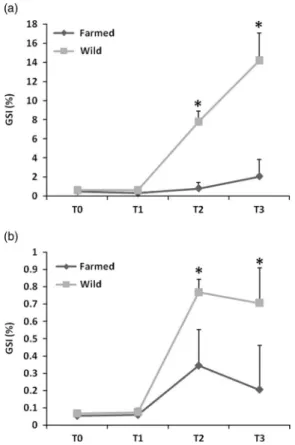
During the first month of the experiment (from T0 to T1), females of both groups had a low GSI (below 1%) (Figure 2a). Significant higher GSI were observed at T2 and T3 (P< 0.05) for the wild females, and the mean GSI reached
14% at T3. Farmed females exhibited very low GSI during the whole experiment (below 2%). For the males, GSI variations followed the same pattern for both groups (Figure 2b). Significant higher GSI was observed at T2 and T3 (P< 0.05)
for both groups but GSI were significantly higher for the wild group (P< 0.05) in comparison with the farmed one.
Histological analysis of the ovaries revealed that during thefirst 5 weeks of the experiment (until T1), both female groups showed immature gonads with more than 90% of protoplasmic oocytes (immature oocytes with vacuole free cytoplasm) (Figure 3a). At T2, wild females showed more
advanced gonadal development than the farmed ones, with respectively 19.8% and 0% of late vitellogenic oocytes. At T3, wild females showed mature gonads with 57.8% of late vitellogenic oocytes, and only 23.6% of protoplasmic oocytes, while farmed females showed less advanced gona-dal development with 13.1% of late vitellogenic oocytes and 45.9% of protoplasmic oocytes. For the males, histological analysis of the testicles revealed that at day 0 (T0), wild males showed fully immature gonads (100% of spermato-gonia), whereas farmed males exhibited immature gonads with 11.8% of remaining spermatozoa. At T1 farmed males showed 95.1% of spermatogonia while wild ones exhibited 79.3% of spermatogonia and 12.4% of spermatocytes and 9.3% of spermatids. At T2 wild males exhibited 10.2% of spermatozoa, 48.2% of spermatids, 30.1% of spermatocytes and 11.5% of spermatogonia, while farmed males showed 20% of spermatids and 55.4% of spermatocytes, but they did not show any spermatozoa production. At the last sampling time, gonads of wild males were fully mature, while gonads of farmed males exhibited only 39.6% of spermatozoa.
Sexual steroids
Females. Values for plasma E2 in females remained low and stable at T0 and T1 for both female groups (<5 pg/ml).
Figure 2 Gonado-somatic changes (%, mean+ SD) in pikeperch females (a) and males (b) (n= 6). Sampling times (T0, T1, T2 and T3) correspond, respectively, to days 0, 32, 153 and 295 after the beginning of the photothermal program. The asterisk indicated a significant difference between the twofish groups (P < 0.05).
Figure 3 Developmental stages of oogenesis (a) and spermatogenesis (b) observed in farmed and wild females and males, respectively (n= 6). Sampling times T0, T1, T2 and T3 correspond, respectively, to days 0, 32, 153 and 295 after the beginning of the photothermal program. SPG= spermatogonia; SPC = spermatocytes; SPD = spermatids; SPZ= spermatozoa.
No significant difference was observed at these two sampling times (Figure 4a) between the two groups. At T2 plasma E2 levels significantly increased for both groups in comparison with T1, with a significantly higher mean level (P< 0.05) for wild females in comparison with the farmed
ones. At T3 plasma levels of E2 significantly decreased for the farmed group in comparison with T2, while plasma E2 levels did not vary in comparison with T2 for the wild group. Plasma testosterone (T) levels increased from T1 until the end of the experiment for the wild group (Figure 4b). The levels recorded in wild breeders were significantly higher (P< 0.05)
than those recorded in farmed ones at T2 and T3. 11-ketotestosterone (11-KT) plasma levels remained basal and significantly increased at T2 for both groups. At T3,
plasma 11-KT levels were significantly higher (P< 0.05) for the wild group in comparison with the farmed one (Figure 4c). Plasma DHP were basal for both groups (<10 ng/ml) until T2 (Figure 5a). At T3 DHP levels significantly increased for the wild group to 44.5 ng/ml (P< 0.05). At T3 DHP levels are significantly higher
(P< 0.05) for the wild females in comparison with the
farmed ones which decreased to 2 ng/ml.
Males. In males plasma E2 levels remained below 2 ng/ml during all the experiment for the farmed group (Figure 4d), while wild males exhibited significantly higher levels (P< 0.05) at T2 and T3 in comparison with the
farmed ones.
Figure 4 Plasma sexual steroids levels variation (mean+ SD) (a) E2 levels variation (pg/ml) in females. (b) Testosterone levels variation (ng/ml) in females. (c) 11KT variations (pg/ml) in females. (d) E2 levels variation (ng/ml) in males. (e) Testosterone levels variation (ng/ml) in males. (f) 11KT variations (pg/ml) in males (n= 6). Sampling times T0, T1, T2 and T3 correspond, respectively, to days 0, 32, 153 and 295 after the beginning of the photothermal program. The asterisk (*) represents a significant difference (P < 0.05).
Plasma (T) (Figure 4e) levels remained at a basal level from T0 to T1 for both groups and significantly increased at T2 for both male groups with a significant advantage (P< 0.05) for
the wild group (13.6 ng/ml) in comparison with the farmed one (6.1 ng/ml). At T3 plasma (T) levels remained signi fi-cantly higher (P< 0.05) for the wild group (19.3 ng/ml) in
comparison with the farmed one (7.89 ng/ml).
Plasma 11-KT levels for the wild group exhibited an increasing profile during all the experiment starting from a basal level of 685 pg/ml at T0 and reaching a maximum value of 7143 pg/ml at T3. In the farmed group, plasma 11-KT levels remained basal between T0 and T1 with a significant difference (P< 0.05) at T1 between the two groups in favor
on the wild one (Figure 4f). A significant increase was recorded at T2 into a value of 5970 pg/ml and reached a maximum value of 7143 pg/ml at T3. No significant difference between the two groups was observed at these two last sampling times.
No significant difference was observed for plasma DHP levels between T0 and T1 in the two groups (0.5 ng/ml) (Figure 5b). At T2 plasma DHP levels decreased to 0.15 ng/ml for the farmed group contrarily to the wild group whose DHP levels increased to 1 ng/ml making a significant difference between the two groups at this sampling time (P< 0.05). At
T3 plasma DHP levels remained stable for both groups with a significant difference in favor of the wild group (P< 0.05).
Gonadotropin-releasing hormone 3 and gonadotropins gene expressions
Females. Gonadotropin-releasing hormone 3 mRNA levels did not show any significant difference between both groups in the brain and the pituitary (Figure 6a and b). For FSH transcripts, in both organs (Figure 6c and d), the two female groups showed a significant (P< 0.05) increase in mRNA
levels and reached a top value at T1, then mRNA levels decreased until the end of the experiment. No significant difference between both groups was observed. For LH tran-scripts, no significant difference was observed between the
two groups in brain during all the experiment and a high variability was observed because of a low gene expression in this organ (Figure 6e). In pituitary, LH mRNA levels significantly increased between T1 and T2 for both groups (P< 0.05) (Figure 6f). At T3, farmed females showed a
significant drop of LH mRNA levels in comparison with the wild ones (P< 0.05).
Males. The males of both groups exhibited the same pattern of change in mRNA levels of GnRH as those observed in females in brain and pituitary, with no significant difference between both groups during the whole experiment (Figure 7a and b). For FSH, mRNA levels in brain showed a significant increase between T0 and T1 (P< 0.05) in both groups,
sta-bilized between T1 and T2 and decreased at T3 (Figure 7c). In pituitary (Figure 7d), FSH mRNA levels followed the same pattern of change as those observed for brain with a sig-nificant difference at T2 in favor of the wild males (P< 0.05).
For LH in brain (Figure 7e), no significant difference was observed in LH transcripts levels between both groups. In pituitary (Figure 7f), LH transcripts levels significantly increased until T2 for both groups and decreased at T3 and no significant different was detected between both groups.
Plasma cortisol. In females (Supplementary Material Figure S1), plasma cortisol levels were significantly higher at T1 in comparison with T0 (P< 0.05), and decreased until the end of
the experiment. In males (Supplementary Material Figure S1) plasma cortisol levels did not show any significant variation. No significant difference was observed in plasma cortisol levels between both groups in males and females.
Reproductive performances
During the spawning season 13 wild females remained and six of them spawned (four artificial stripping and two spon-taneous spawns), the percentage of spawned wild females was of 46.1%, while no farmed female spawned. The embryos survival rates were 89 ± 2% after 1 day post-fertilization (dpf),
Figure 5 Plasma 17,20β-dihydroxy-4-pregnen-3-one (DHP) levels variation (ng/ml) in (a) females and (b) males (mean + SD) (n = 6). Sampling times T0, T1, T2 and T3 correspond, respectively, to days 0, 32, 153 and 295 after the beginning of the photothermal program. The asterisk (*) represents a significant difference (P < 0.05).
83 ± 3% after 2 dpf, 78 ± 6% after 3 dpf and 56 ± 7% after 5 dpf for the wild group. Hatching rate was 47 ± 1% and 37 ± 4% of malformations was monitored for the hatched larvae. The percentage of spermiating males in the wild group was of 100% (three males) while no farmed male was spermiating despite presence of spermatozoa in the testis.
Discussion
In the present study, the change in the GSI in the wild group (males and females) was in accordance with the profiles
described for percids and especially pikeperch in natural conditions (Fontaineet al., 2015). However, the GSI progress in the farmed group did not follow any usual pattern of changes, especially in females, where the index remained below 4% during the entire experiment, especially at T3 where it should exceed 10% as it was the case for the wild group followed in this study (14.2 ± 2.8%). These results suggest a poor quality of gametogenesis and gonadal development in farmed ones. This was confirmed by the histological analysis, as wild females showed more advanced oogenesis stages than farmed ones after 153 days (T2). This
Figure 6 Gonadotropin-releasing hormone 3 (GnRH3) and gonadotropins gene expression quantification in the brain and pituitary of females (mean+ SD). (a) GnRH3 messenger RNA (mRNA) levels in brain. (b) GnRH3 mRNA levels in pituitary. (c)βFSH mRNA levels in brain. (d) βFSH mRNA levels in pituitary. (e)βLH mRNA levels in brain. (f) βLH mRNA levels in pituitary (n = 6). Sampling periods T0, T1, T2 and T3 correspond, respectively, to days 0, 32, 153 and 295 after the beginning of the photothermal program. Messenger RNA levels have been quantified by q-PCR. The asterisk (*) represents a significant difference (P < 0.05).
is in accordance to the results obtained by Ben Ammaret al. (2015) in pikeperch breeders exposed to a continuous light-ing in RAS system. Indeed, after 153 days under a continuous lighting they found 83% of protoplasmic oocytes which is similar to the 80% of protoplasmic oocytes observed in our farmed group after 153 days of exposure to the photo-thermal program. Moreover, after the same time lapse (153 days) of exposure to a natural lighting, they found 100% of vitellogenic oocytes while we found only 40% of vitellogenic oocytes in the wild group and only 9% for the farmed one under our conditions. For our wild and farmed groups, this suggests a weak environmental stimulation
induced by the applied indoor photothermal program by comparison with the stimulation triggered by the natural lighting in the farmed group studied by Ben Ammaret al. (2015). The divergence in the oogenesis advancement could thus stem from the different photothermal conditions used in the two experiments. The ‘natural lighting’ used in Ben Ammaret al. (2015) was obtained with outdoor tanks par-tially covered allowing the exposure to a natural photoperiod and temperature whereas we used in our experiment an indoor controlled photothermal program which does not fully reflect the natural daily variations of temperature and luminosity. Moreover, the diet was not the same between
Figure 7 Gonadotropin-releasing hormone 3 (GnRH3) and gonadotropins gene expression quantification in the brain and pituitary of males (mean + SD). (a) GnRH3 messenger RNA (mRNA) levels in brain. (b) GnRH3 mRNA levels in pituitary. (c)βFSH mRNA levels in brain. (d) βFSH mRNA levels in pituitary. (e)βLH mRNA levels in brain. (f) βLH mRNA levels in pituitary (n = 6). Sampling periods T0, T1, T2 and T3 correspond, respectively, to days 0, 32, 153 and 295 after the beginning of the photothermal program. Messenger RNA levels have been quantified by q-PCR. The asterisk (*) represents a significant difference (P< 0.05).
the two experiments, we fed ourfish with prey fish while the fish of Ben Ammaret al. (2015) were fed with a commercial artificial feed.
The farmed group showed a weaker environmental stimulation by comparison with the wild one, this more marked effect could be due to an increase in the photoperiod during the transfer from the supplier farm to our facilities of the farmed group. Indeed, in the supplier farm, fish were kept under a photoperiod of 13L11D and were transferred to our facilities where the photoperiod was 16L8D. It has been shown by Fontaine et al. (2006) on Eurasian perch that increasing photoperiod during the pre-inductive period may disturb the progress of the reproductive cycle. A longer acclimatization period at 16L8D would have been more suitable to correct the effects of such photoperiod increase. Concerning the wild group, which did not undergo any increase in the photoperiod and which had ever experienced natural changes of temperature/photoperiod in the wild, the results observed during the chilling phase (until T2) show a usual but slower gonadogenesis comparing with the results obtained by Ben Ammar et al. (2015) with the natural lighting group at day 153. This suggests that the program used in this experiment, is not completely suitable for farmed pikeperch breeders. It was reported that successful induction and control of the gonadal development in Eurasian perch must involve a long phase (5 months) of wintering period where low temperature (6°C) and short photoperiod (8 h) should be applied (Abdulfatah et al., 2011 and 2013; Fontaineet al., 2015). In the case of pikeperch, instead of using a wintering period for 5 months at 6°C as used in this experiment, a chilling period lasting about 3 months at the level of 12°C should be fully suitable for the induction of gonadal development in RAS systems (Hermelink et al., 2011) (100% of vitellogenic oocytes at day 120). Moreover, a subsequent increment of the temperature up to 14°C should be suitable enough to promote the vitellogenesis and sper-matogenesis in farmed broodstock (Hermelinket al., 2013). In the present experiment, the marked difference between both fish groups was observed at T2 during this chilling period. Taken together, we hypothesize that inadequate features of the external conditions during the acclimatization phase and the wintering period justify the slow gonad development in the farmedfish and the further failure in the ovulation and spawning event. Interestingly, the wild fish exhibited normal gonadogenesis and gametogenesis pro-gress and correct reproductive performances according to data recorded in previous works in RAS systems (Fontaine
et al., 2015), this means that the unsuitable photothermal program for the farmedfish is not a bottleneck to manage an acceptable reproductive season using the wild pikeperch. This difference between both groups might not be only due to differential response to the program but also to the prior life history of the fish regarding past exposure, or not, to natural changes of temperature and photoperiod.
However, it must be emphasized that the higher thermal regime recommended by Hermelinket al. (2011, 2013 and 2016) also did not allow to record ovulation in farmed
pikeperch. Therefore, it may be suggested that some other factors, such as age and size rather than only thermal regime during the wintering period may be responsible for successful gonadal development in pikeperch. We know that fish weight may influence the reproductive success (Fontaine
et al., 2015). Both groups displayed the same initial average weight. However, the growth of farmedfish is higher than the growth of wild fish. Moreover, the age of wild fish is more advanced than the farmed ones at a fixed weight (Fontaineet al., 2015). Our wildfish were 4 years old, they experienced at least one spawning season before coming to our facilities. By contrast, our farmed group was 2 years old and never reproduced before. It has been shown thatfish who reproduce for the first time may exhibit lower reproductive performances than fish who spawned before as showed in Eurasian perch (Abi-Ayad, 1998). The age of the broodstock and the rank of the spawning are first two putative factors explaining the contrasting results between the two groups.
An additional explanation for the difference in the gametogenesis progress between both groups is the feed. In this experiment, both groups were fed with foragefish to eliminate the bias linked to the nutritional requirements during the reproductive cycle. However, before the experi-ment, the farmedfish had been fed with formulated ingre-dients. This change of feed before the experiment is an additional argument to think that the life history of thefish may influence the further success of the reproductive cycle.
To understand the physiological mechanisms that are behind these differences of gametogenesis between both groups the major actors of the gonadotropic axis were investigated. Investigation of GnRH3 in the brain and pituitary through GnRH3 transcripts levels did not show any significant difference between the two groups in both sexes, and showed low variations during the reproductive cycle. These data are in accordance with the results obtained by Khendeket al. (2017) in the Eurasian perch, suggesting that GnRH3 was not the major gonadotropic hormone in perch and suggested another GnRH (GnRH1) as the major hormone to induce gonadotropins (GtHs) production.
We also investigated the GtHs in the brain and pituitary. In males, FSH transcript levels showed significant difference between the two groups in the pituitary characterized by a significant drop at T2 in the farmed group in comparison with the wild one. This was accompanied by significantly lower levels of plasma 11-KT at T1 and testosterone at T2 and T3 in the farmed group by comparison with the wild one. The androgens being major regulators of fish spermatogenesis whose secretion is FSH-dependent in fish, we deduce that the gonadotropic axis was disrupted from the pituitary to the gonad in the farmed group affecting in turns the progress of spermatogenesis and spermiogenesis as it was demonstrated by the histological analysis. The inhibition of spermatogen-esis in farmedfish was also accompanied with a significant decrease of DHP levels at T2 and T3 in the farmed group.
In females, FSH transcripts did not show any significant difference in the brain and pituitary, as well as LH in the brain, however, a significant drop in LH transcripts was
observed at T3 in the farmed group. This drop was preceded by significantly lower plasma levels of testosterone at T2 and E2 in the farmed group by comparison with the wild one. These low levels of these plasma steroids notably E2 could explain the absence of late vitellogenic oocytes at T2 observed in the farmed females, E2 being the principal mediator of vitellogenin production and incorporation in the oocytes (Lubzens et al., 2010). Plasma DHP results also showed a decrease in DHP levels in farmedfish, this could be related to the oogenesis inhibition as DHP is probably one of the putative major maturation inducing steroid in percids as it plays this role in most of the teleostfish species (Nagahama, 1987), the lower levels in the farmed group might have affected the triggering of thefinal oocyte maturation stages, blocking in turns the ovulation and spawning. The slow progress of oogenesis thus appears as the most obvious cause of failures in the reproductive performances monitored in farmedfish.
These results are consistent with the results observed in the Eurasian perch even if the studied domestication process was different when two different numbers of generations in captivity were tested (Khendeket al., 2017). In both cases, we suggest that a disruption of the gonadotropic axis start-ing from the pituitary and independently on the cortisol production, occurred during thefirst step of the domestica-tion process in percids. However, in the present study, this effect is not due to the number of generation in rearing systems but may be attributed to the different past breeding conditions (diets, photothermal regime,fish age) before the experiment (pondv. RAS system).
In conclusion, this study showed that the previous rearing conditions alter the further progress of gametogenesis and the reproductive performances in response to controlled photothermal program for both sexes in pikeperch. Attention should be paid to the renewal of the captive broodstock by wildfish to prevent failure in the reproductive success.
Acknowledgments
The authors are grateful to the INRA institute of Champenoux, France for access to histological equipment and their help. The authors would like to thank all the members of team DAC (University of Lorraine, France) who helped duringfish sampling. This study was supported by the FranceAgrimer establishment (French establishment of national agricultural and marine products). As well as by the Ministry of Education, Youth and Sports of the Czech Republic, projects: CENAKVA (No. CZ.1.05/ 2.1.00/01.0024) and CENAKVA II (No. LO1205 under the NPU I program).
Declaration of interest None.
Ethics statement
Fish were handled in accordance with national and international guidelines for protection of animal welfare (Agreement number C5454718).
Software and data repository resources None.
Supplementary material
To view supplementary material for this article, please visit https://doi.org/10.1017/S1751731118000010
References
Abdulfatah A, Fontaine P, Kestemont P, Gardeur JN and Marie M 2011. Effects of photothermal kinetics and amplitude of photoperiod decrease on the induc-tion of the reproducinduc-tion cycle in female Eurasian perch (Percafluviatilis). Aquaculture 322, 169–176.
Abdulfatah A, Fontaine P, Kestemont P, Milla S and Marie M 2013. Effects of the thermal threshold and the timing of temperature reduction on the initiation and course of oocyte development in cultured female of Eurasian perchPerca fluviatilis. Aquaculture 376, 90–96.
Abi-Ayad SM 1998. Etude expérimentale de la biologie de la reproduction de la perchefluviatile (Percafluviatilis). Effet de la composition en acides gras de la série (n-3) de l’alimentation des géniteurs sur la qualité des oeufs et des larves. PhD thesis Liège, Belgium.
Ben Ammar I, Teletchea F, Milla S, Ndiaye WN, Ledore Y, Missaoui H and Fontaine P 2015. Continuous lighting inhibits the oneset of reproductive cycle in pikeperch. Fish Physiology and Biochemistry 41, 344–356.
Brummett R, Angoni D and Pouomogne V 2004. On-farm and on-station comparison of wild and domesticated Cameroonian populations ofOreochromis niloticus. Aquaculture 242, 157–164.
Ciesla M, Jonczyk R, Gozdowski D, Sliwinski J, Rechulicz J and Andrzejewski W 2013. Changes in ide (Leuciscus idus) female’s reproductive parameters after stimulation with carp pituitary homogenate (CPH) and Ovopel: the effect of domestication? Aquaculture International 22, 78–88.
Douxfils J, Mathieu C, Mandiki SNM, Milla S, Henrotte E, Wang N, Vandecan M, Dieu M, Dauchot N, Pigneur LM, Li X, Rougeot C, Melard C, Silvestre F, Van Doninck K, Raes M and Kestemont P 2011. Physiological and proteomic evidences that domestication process differentially modulates the immune status of juvenile Eurasian perch (Perca fluviatilis) under chronic confinement stress. Fish Shellfish Immunology 31, 1113–1121.
Fontaine P, Pereira C, Wang N and Marie M 2006. Influence of pre-inductive photoperiod variations on Eurasian perchPercafluviatilisbroodstock response to an inductive photothermal program. Acuaculture 255, 410–416.
Fontaine P, Wang N and Hermelink B 2015. Broodstock management and control of the reproductive cycle. In Biology and culture of percid fishes (ed. P Kestemont, K Dąbrowski and RC Summerfelt), pp. 103–122. Springer, Dordrecht, the Netherlands.
Fostier A and Jalabert B 1986. Stereoidogenesis in rainbow trout (Salmo gairdneri) at various preovulatory stages: changes in plasma hormone level and in vivo responses of the ovary to salmon gonadotropin. Fish Physiology and Biochemistry 2, 87–99.
Hassin S, de Monbrison D, Hanin Y, Elizur A, Zohar Y and Popper DM 1997. Domestication of the white grouper Epinephlus aeneus. 1. Growth and reproduction. Aquaculture 156, 305–316.
Hermelink B, Kleiner W, Schulz C, Kloas W and Wuertz S 2016. Photo-thermal manipulation for the reproductive management of pikeperchSander lucioperca. Aquaculture International 25, 1–20.
Hermelink B, Wuertz S, Rennert B, Kloas W and Schulz C 2013. Temperature control of pikeperch (Sander lucioperca) maturation in recirculating aquaculture systems induction of puberty and course of gametogenesis. Aquaculture 400, 36–45. Hermelink B, Wuertz S, Trubiroha A, Rennert B, Kloas W and Schulz C 2011. Influence of temperature on puberty and maturation of pikeperch,Sander lucioperca. General and Comparative Endocrinology 172, 282–292.
Khendek A, Alix M, Viot S, Ledore Y, Rousseau C, Mandiki R, Kestemont P, Policar T, Fontaine P and Milla S 2017. How does a domestication process modulate oogenesis and reproduction performances in Eurasian perch?. Acuaculture 473, 206–214.
Krejszeff S, Targońska K, Z˙arski D and Kucharczyk D 2009. Domestication affects spawning of the ide (Leuciscus idus) preliminary study. Aquaculture 295, 145–147.
Křisťan J, Stejskal V and Policar T 2012. Comparison of reproduction characteristics and broodstock mortality in farmed and wild Eurasian perch (PercafluviatilisL.) females during reproduction under controlled conditions. Turkish Journal of Fisheries and Aquatic Sciences 12, 191–197.
Langeron M 1942. Précis de Microscopie: Technique-Expérimentation-Diagnostic. Masson et Cie, Paris. 1339 pp (in French).
Lubzens E, Cerda J, Young G and Bobe J 2010. Oogenesis in teleostfish: how fish eggs are formed. General and Comparative Endocrinology 165, 367–389. Mandiki SNM, Babiak I, Bopopi JM, Leprieur F and Kestemont P 2005. Effects of sex steroids and their inhibitors on endocrine parameters and gender growth differences in Eurasian perch (Percafluviatilis) juveniles. Steroids 70, 85–94. Nagahama Y 1987. Gonadotropin action on gametogenesis and steroidogenesis in teleost gonads. Zoology Sciences 4, 209–222.
Policar T, Blecha M, Křišťan J, Mráz J, Velíšek J, Stará A, Stejskal V, Malinovskyi O, Svacˇina P and Samarin AM 2016. Comparison of production efficiency and quality of differently cultured pikeperch (Sander lucioperca L.) juveniles as a valuable product for ongrowing culture. Aquaculture International 24, 1607–1626.
Rinchard J and Kestemont P 1996. Comparative study of reproductive biology in single and multiple spawner cyprinidfish: I. Morphological and histological features. Journal of Fish Biology 49, 883–894.
Steenfeldt S, Vestergaard M, Overton JL, Paulsen H, Larsen VJ and Henriksen NH 2010. Development of intensive rearing of pikeperch in Denmark. Anonymous, Hirtshals, Denmark.
Tymchuk WE, Biagi C, Withler R and Devlin RH 2006. Growth and behavioral consequences of introgression of a domesticated aquaculture genotype into a native strain of Coho Salmon. American Fish Society 153, 442–455.
Vandeputte M and Prunet P 2002. Génétique et adaptation chez les poissons : domestication, résistance au stress et adaptation aux conditions de milieu. INRA Production Animale 15, 365–371.
Wallace RA and Selman K 1981. Cellular dynamic aspects of oocyte growth in teleosts. American Zoology 21, 325–343.
Z˙arski D, Krejszeff S, Palińska K, Targońska K, Kupren K, Fontaine P, Kestemont P and Kucharczyk D 2012. Cortical reaction as an egg quality indicator in artificial reproduction of pikeperch,Sander lucioperca. Reproduction Fertility and Development 24, 843.