HAL Id: tel-03187486
https://tel.archives-ouvertes.fr/tel-03187486
Submitted on 1 Apr 2021
HAL is a multi-disciplinary open access
archive for the deposit and dissemination of
sci-entific research documents, whether they are
pub-lished or not. The documents may come from
teaching and research institutions in France or
abroad, or from public or private research centers.
L’archive ouverte pluridisciplinaire HAL, est
destinée au dépôt et à la diffusion de documents
scientifiques de niveau recherche, publiés ou non,
émanant des établissements d’enseignement et de
recherche français ou étrangers, des laboratoires
publics ou privés.
Probing the processes driving distant and local
star-formation in galaxies through dust and molecules
Luwenjia Zhou
To cite this version:
Luwenjia Zhou. Probing the processes driving distant and local star-formation in galaxies through
dust and molecules. Astrophysics [astro-ph]. Université Paris-Saclay; Nanjing University (Chine),
2020. English. �NNT : 2020UPASP099�. �tel-03187486�
Th
`ese
de
doctor
at
NNT
:2020UP
ASP099
Probing the processes driving distant and
local star-formation in galaxies through
dust and molecules
Th`ese de doctorat de l’Universit´e Paris-Saclay et de Nanjing University Ecole doctorale n 127 Astronomie et Astrophysique d’Ile de France (AAIF)
Sp´ecialit´e de doctorat : Astronomie et Astrophysique Unit´e de recherche : Universit´e Paris-Saclay, CNRS, CEA, Astrophysique, Instrumentation et
Mod´elisation de Paris-Saclay, 91191, Gif-sur-Yvette, France R´ef´erent : Facult´e des sciences d’Orsay Th`ese pr´esent´ee et soutenue `a Nanjing, Chine, le 13 novembre 2020, par
L
UWENJIA
Z
HOU
(h
h
hF
F
Fá
á
á
)
Composition du Jury :
Herv´e Dole
Professeur, Universit´e Paris-Saclay Pr´esident Yiping Ao
Directeur de Recherche, Purple Mountain Observatory Rapporteur & examinateur Bunyo Hatsukade
Professeur assistant, University of Tokyo Rapporteur & examinateur Veronique Buat
Professeure, Laboratoire d’Astrophysique de Marseille (LAM) Examinatrice Xu Kong
Professeur, University of Science and Technology of China Examinateur Xianzhong Zheng
Directeur de Recherche, Purple Mountain Observatory Examinateur
David Elbaz
Directeur de Recherche, Commissariat `a l’´energie atomique (AIM) Directeur de th`ese Yong Shi
Abstract
Les études sur l’évolution des galaxies ont été révolutionnées au cours des dernières décennies grce aux nouveau télescopes et aux instruments de pointe. Les interféromètres Herschel, ALMA et NOEMA permettent d’observer l’émission des poussières tracant la formation des étoiles, invisible dans les bandes infrarouges proche observées par les télescopes optiques. Leur grande sensibilité permet la détection des galaxies les plus lointaines, ainsi que des galaxies locales les plus faibles dont la formation et l’évolution remettent en question les théories et les modèles actuels. La technique de l’unité de champ intégrale permet de combiner l’information spatiale et les propriétés extraites des spectres, permettant une étude approfondie de la cinématique des galaxies.
Dans cette thèse, je me concentre sur la formation des étoiles aux grandes échelles des galaxies (≥ kpc). En utilisant les données des téléscopes Herschel, ALMA, NOEMA, et SAMI IFU, ma thèse tente de mettre en lumière les questions suivantes : (1) Comment les premières galaxies ont-elles formé des étoiles à partir du gaz contenant peu de métaux ? (2) Comment les galaxies massives du début de l’Univers ont-elles rapidement constitué leur masse et finalement cessé de former des étoiles ? (3) Quel est le rle joué par les environnements dans lesquels elles résident ? (4) Comment la rétroaction de la formation des étoiles affecte-t-elle la cinématique des galaxies ?
Premièrement, je présente l’étude de six galaxies optiquement sombres extraites de l’étude GOODS-ALMA (la plus grande étude cosmologique à 1,1 m) dont le décalage vers le rouge est supérieur à z = 3. Je présente des preuves que quatre d’entre elles appartiennent à la même surdensité de galaxies,
situé à z ≥ 3.5. L’une d’entre elles, AGS24 (Mı= 1011.32
+0.02
≠0.19M§), est la galaxie la plus massive, sans
noyau galactique actif et situé à z > 3. Cette dernière se situe également au centre du pic de densité de surface des galaxies, suggèrant que la surdensité environnante est un proto-amas en cours de virialisation et qu’AGS24 est un candidat progéniteur d’un futur amas de galaxie plus brillant.
Deuxièmement, en me basant sur une observation NOEMA, j’ai étudié la teneur en gaz moléculaire dans IZw18, l’une des galaxies les plus pauvres en métal de l’Univers local. J’ai obtenu une limite supérieure d’émission de CO(J=2-1) qui est dix fois plus faible que précédemment déterminée, ceci malgré la forte activité de formation d’étoiles. Sa faible teneur en CO (par rapport à sa luminosité
infrarouge), son taux de formation d’étoiles, et sa luminosité [CII] indiquent un changement drastique
dans la structure du MIS (environ quelques pourcents de la métallicité solaire). En particulier, la
luminosité élevée [CII] par rapport au CO implique un réservoir moléculaire plus important que
l’émetteur de CO dans l’IZw18.
Troisièmement, mes travaux sur les sources d’énergie des mouvements turbulents montrent qu’à des échelles inférieures au kpc, les galaxies locales formant des étoiles du relevé SAMI présentent une
distribution plate de la dispersion de vitesse du gaz ionisé en fonction de la densité de surface du taux de formation d’étoiles. Cependant, le plancher de dispersion de vitesse est plus élevé que ce que prédisent les modèles "feedback-driven". Cela suggère que des sources supplémentaires à la rétroaction de formation d’étoiles entranent des mouvements aléatoires du MIS dans les galaxies formant des étoiles.
Enfin, je présente mes travaux sur l’émission de poussières spatiallement résolue des galaxies extrêmement pauvres en métaux observées par Herschel. Ces galaxies présentent des températures de poussière plus élevées et des indices d’émissivité plus faibles que ceux des galaxies spirales. Environ la moitié de l’émission à 100 µm provient de la poussière chaude (50 K), par opposition à la composante froide (≥20 K) de la poussière. Les couleurs de l’infrarouge lointain sont toutes liées aux densités de surface des jeunes étoiles, mais pas aux densités de surface des masses stellaires. Cela suggère que leur poussière (70 ≥ 350 µm) est principalement chauffée par le rayonnement des jeunes étoiles.
Acknowledgement
It came as a surprise when I got to know that I could also do a joint-PhD at Université de Paris Saclay and it was already such a great pleasure to come to CEA as a visiting student for two years, thanks to everyone at CEA as a host and the financial support from China Scholar Council.
During the two years in France, I have gained a lot of knowledge not only from academia but also from everyone I met.
First of all, thank you, David. Thanks for hosting me at CEA and for mentoring me in this thesis. Your passion for science inspires me. It reminds me that being a researcher is not only a way to make a living, but more essentially a lifestyle. A lifestyle to stay curious about everything, to observe what is happening around us, to crack down what is behind what we see. It reminds me of how I was originally fascinated about science: to think, to ask questions originated from my daily life and finally to describe, to explain, and to predict these phenomena. I am grateful for your patience with me, for explaining to me the big pictures and for so much help with my life in France.
Thanks Emanuele for always taking so much time for the Journal Club and for the valuable discussions, your door is always open when I need help. Thanks also to many other people, Jérôme, Alain, Pascale, Laure, Tao, Corentin, Benjamin, Frederic, Emeric, Koryo for always being so warm-hearted, I have learnt a lot from you.
And all the friends at CEA, my two years at CEA would not have been so fruitful and unforgettable without you. Max, my office mate, you have been always helping me in the most critical time. You offered me valuable suggestions when I got stuck at work. And our tea/coffee breaks, bicycle trips, cheese and wine... Chiara, I feel so lucky to have had you by my side during all these adventures (the opening day, the D-day, the interviews with the committees... and our trip to Giverny, hanging out in Paris). Antonello, you are one of the old friends since I came to CEA for a short internship three years ago. You have been always sharing your good ideas with me. I am so grateful for your immediate help after my laptop was stolen. Anna, you always have the magic to make the atmosphere so lively and cheerful. Ivan, you are so organized and taking care of everyone of us. Baptise and Solène, you introduced to me the French culture and shared with me so many fun facts about life in France. Dangning, thanks to you, our "2019 Chinese New Year’s Eve dinner" was such a success. You also offered me so many useful tips as an experienced "Chinese in France". And many other friends I met at CEA: Rose, Maud, Valeska, Benjamin, Antigone, Anita, Daizhong, Francesco, Jeremy.
And my life at the center of the world, Gif-sur-Yvette: Thank you, Judica, for hosting me at your place. You have been like a mother to teach me how to take care of myself in your own special way, and have shown me how to think critically, how to take actions actively to solve problems efficiently.
Thank you, Pascale. You have never regarded me as an outsider, and have always kindly invited me to all kinds of activities. This makes me feel integrated to the life in France and so much less lonely when I was in France.
And many thanks to all my friends, my teachers and my family back in China, what I want to say to you are included in the Chinese version of my thesis. Thanks Mum and Dad for your unconditional support of all time.
Merci Anoine. Mille mercis pour ton grand soutien lors de ma thèsis et l’écriture de ce manuscript. Merci d’être toujours là et de me motiver. Merci d’être venu dans ma vie.
To my grandfather, Baoshan Wang ãùq .
Contents
1 Introduction 1
1.1 Star formation: the driver of galaxy evolution . . . 1
1.2 Star formation obscured by interstellar dust . . . 2
1.2.1 Multi-wavelength study of galaxies . . . 3
1.2.2 The main sequence of star-forming galaxies. . . 5
1.2.3 Cosmic star formation history . . . 7
1.2.4 Observing star-forming galaxies in the (sub)millimeter . . . 9
1.2.5 Optically-dark galaxies. . . 13
1.3 Star formation fueled by gas. . . 15
1.3.1 Gas tracers . . . 15
1.3.2 Star formation law . . . 16
1.3.3 Gas content. . . 18
1.4 Star formation as one of the energy sources of gas . . . 18
1.4.1 Gas velocity dispersion and the energy sources. . . 18
1.4.2 Integral field unit (IFU), datacube and beam smearing effect . . . 19
2 Summary of the work done in this thesis 21 2.1 GOODS-ALMA . . . 21
2.1.1 Optically dark galaxies and their association with a proto-cluster in formation at z≥ 3.5. . . 21
2.1.2 Data compilation . . . 22
2.1.3 Nascent AGNs in GOODS-ALMA . . . 23
2.1.4 Contribution as third author . . . 23
2.2 Extremely metal-poor galaxies . . . 24
2.2.1 Spatially resolved dust emission . . . 24
2.2.2 Gas content in IZw18 . . . 24
2.3 The SAMI Integral field Units (IFU) Survey . . . 25
2.3.1 Energy source of turbulence in star-forming galaxies . . . 25
2.4 Observations . . . 25
3 GOODS-ALMA: optically-dark ALMA galaxies shed light on a cluster in formation at z= 3.5 27 3.1 Introduction . . . 27
3.2 Data and observations . . . 29
3.2.1 ALMA data and observations . . . 30
3.2.2 Ancillary data . . . 31
3.2.3 Origin of the redshifts and stellar masses . . . 32
3.2.4 Derived parameters of the optically dark galaxies . . . 32
3.3 Results of the ALMA spectroscopic follow-up . . . 34
3.3.1 AGS4 . . . 35
3.3.2 AGS17 . . . 36
3.3.3 Upper limits of AGS11, AGS15 and AGS24 . . . 37
3.4 GOODS-ALMA optically-dark galaxies . . . 37
3.4.1 AGS4, an extremely massive galaxy at z=3.556 and a case of blending in the Hubble H-band image . . . 38
3.4.2 AGS25, the most distant optically-dark galaxy in GOODS-ALMA . . . 40
3.5 An over-density at z ≥ 3.5 in GOODS-ALMA. . . 41
3.5.1 Clustering properties of optically dark galaxies . . . 41
3.5.2 A clear peak at z ≥ 3.5 in the redshift distribution . . . 41
3.5.3 Optically-dark galaxies at z ≥ 3.5 . . . 42
3.5.4 Spatial distribution of galaxies at z ≥ 3.5 in the GOODS-ALMA field. . . 48
3.5.5 Dynamical state of the proto-cluster at z ≥ 3.5. . . 53
3.6 Conclusions. . . 54
4 Extremely weak CO emission in IZw 18 57 4.1 Introduction . . . 57 4.2 Observations . . . 58 4.3 Results . . . 58 4.3.1 CO J=2-1 . . . 58 4.3.2 1.3 mm continuum . . . 59 4.4 Discussion . . . 59
4.4.1 SED and Submilimetre excess . . . 60
4.4.2 Infrared luminosity and SFR versus LÕ CO . . . 61
4.4.3 The structure of the interstellar medium . . . 62
4.5 Conclusion . . . 63
5 The SAMI Galaxy Survey: energy sources of the turbulent velocity dispersion in spatially-resolved local star-forming galaxies 65 5.1 Introduction . . . 65
5.2 Sample and data analysis . . . 67
5.2.1 Sample selection . . . 67
5.2.2 Gas kinematic information . . . 70
5.2.3 Spatial resolution . . . 72
5.3 Results . . . 73
5.3.1 The spatial distribution of SFR, vgas, and ‡gas . . . 73
5.3.2 The ‡gas– SFRrelation in local and high redshift star-forming galaxies . . . 73
5.4 Discussion . . . 78
5.4.1 Main driver(s) of velocity dispersion . . . 78
5.4.2 Caveats . . . 79
5.5 conclusion. . . 81
6 Spatially resolved dust emission of extremely metal poor galaxies1 83 6.1 Introduction . . . 83
6.2 Sample, observations and data analysis . . . 84
6.2.1 The sample . . . 84
6.2.2 Observations . . . 86
6.2.3 Photometric measurements . . . 86
6.3 The far-IR SEDs . . . 88
6.3.1 The color-color diagrams . . . 88
6.3.2 Modified black-body fitting . . . 89
6.3.3 Spatial variations of SEDs and dust heating Mechanism . . . 91
6.4 Dust-to-stellar mass ratio . . . 94
6.5 Conclusions. . . 96
7 Conclusion and perspectives 97 7.1 Conclusion . . . 97
7.2 Perspective . . . 98
7.2.1 More on the optically dark galaxies . . . 98
7.2.2 AGN feedback on high-z star-forming galaxies . . . 99
Bibliography 103
1
Introduction
„
✏ˆ ∆ When a kid I didn’t cognize the moon,|\}âÿ Called it a jade dish just as soon.
ȑv\ Wondered if it a dresser mirror, too
fi(RëÔ Flying over the cloud blue.
— ⌦‰⌫ L↵ Ballad of Ancient Bright Moon
N} Bai Li
1.1
Star formation: the driver of galaxy evolution
Galaxies are made of stars, dust, gas and dark matters. They are gravitationally bound systems showing various properties in morphologies, luminosities, colors, sizes and masses, etc. Such diversities suggest
complicated processes in galaxy evolution and formation (e.g., Mo et al., 2010). Nowadays, most
studies converge to a scenario where galaxies grow mainly through a secular process (e.g.,Schreiber
et al., 2015): Gas accretes from the intergalactic medium (IGM), then it cools, condenses into molecular
clouds and finally collapses into stars, hence, fuels star formation (White and Rees, 1978). At the late
stage of their lives, stars release part of their masses back to the interstellar medium (ISM) through stellar winds, planetary nebulae and supernovae. The released gas and dust, as well as energy, are
involved in the formation of the next generation of stars(e.g.,Larson, 1974;Martin, 1999). Therefore,
star formation is considered as the key process driving galaxy evolution.
However, the mechanisms that regulate each step mentioned above are complex: What controls the gas inflow from the surrounding environment of galaxies and stars? How efficient is the conversion of the available gas reservoir into stars? Whether the gas ejection and heating by star formation feedback accelerate or hinder further star formation?... In addition, supermassive black holes at the center of galaxies may undergo a temporarily active phase of active galactic nucleus (AGN). The efficient gas accretion triggers AGNs which then release a significant amount of energy into the host galaxies (Kormendy and Ho, 2013;Heckman and Best, 2014). This further complicates galaxy ecosystems. Galaxies are not isolated systems. When we place them in a broader context, they pinpoint the most luminous and the most massive spots of matter distributions in the Universe. Such wide distributions are called large-scale structures, and are always in the form of web-like networks, hence also called
cosmic web (Peacock et al., 2001). Large-scale structures provide passages for gas to accrete into
galaxies and to replenish the fuel of star formation (Dekel et al., 2009). Some galaxies would gather in
the knots of cosmic webs, therefore they are more likely to interact with each other. The interactions can be violent, such as mergers, or mild, such as fly-bys. In either case, the distribution and physical
states of the stars, ISM and halos in the galaxies can be dramatically altered after the interactions and the evolution paths of the galaxies will be significantly changed since then.
The extragalactic astronomy is a relatively young field of research. It was not until a century ago that, Hubble measured the distances of the Cepheid variable stars in Andromeda and confirmed
that there are systems external to our Milky Way (Hubble, 1926). The study of galaxy formation and
evolution relies heavily on observations. Compared to gravitational waves originating from extremely rare events of merging binary systems, electromagnetic emission from galaxies, mainly consist of direct or reprocessed starlight, are ubiquitous and relatively easier to obtain. Thanks to the rapid development of the modern technology, especially the tremendous progress in manufacturing powerful telescopes, exciting breakthroughs have been made through astrophysics observations, for example, last year,
astrophysicists obtained the first direct confirmation of the existence of black holes in M83 (Event
Horizon Telescope Collaboration et al., 2019), using the Event Horizon Telescope, a planet-scale array of ground-based radio telescopes. Yet, there is more to explore.
So far in extragalactic astronomy, despite the broad diversities of galaxies, extensive observations have revealed tight scaling relations between galaxy properties, such as the star formation law (star formation rate surface density vs. gas surface density), the galaxy main sequence (star formation rate vs. stellar mass), which will be introduced in detail below, as well as the stellar mass-metallicity relation, the Tully-Fisher relation (total mass vs. rotational velocity) etc. The comparison between these relations with models can better constrain the processes regulating the star formation activity in galaxies to further understand how galaxies in the early Universe evolved to the ones on the present day. In this thesis I have worked on different topics on star formation in galaxies. In the following, I am going to specify the main topics I have been working on during my thesis on star formation in galaxies.
1.2
Star formation obscured by interstellar dust
UV emission of galaxies is dominated by the most massive stars (OB stars), which end their lives shortly after their birth (< 100Myr), compared to the vast majority of other stars (e.g., it is estimated to be 10 Gyr for the Sun). Therefore, the existence of OB stars, as indicated by their UV emission, suggests a recent star formation within a time scale of ≥100 Myr. Then UV luminosity is an idea tracer of the
star formation rate (SFR) of galaxies (Kennicutt, 1998a). However, as mentioned above, stars produce
heavy elements, also known as metals, and release them into the ISM at the late stage of their evolution. A significant fraction of metals are locked into the interstellar dust. This suggests that star formation is always accompanied by dust formation. UV photons are energetic, with wavelengths between 150 and 300 nm, smaller than the typical size of dusts. As UV photons emitted by a massive galaxy travel through the galaxy, they can be easily absorbed or scattered by dust. Hence SFR estimated from UV can be heavily underestimated. Nevertheless, the absorbed energy will be re-emitted by dust in the
far-infrared (FIR) through thermal radiation. An example is shown in Fig.1.1-b. By observing in the
FIR1, astrophysicists can recover star formation hidden by the interstellar dust.
1It can be redshifted to longer wavelength as will be discussed later.
Fig. 1.1:a: Spectral energy distributions (SEDs) for typical galaxies - an old elliptical galaxy (red), two types of spiral galaxies (Sb in green and Sd in blue), an AGN (Markarian 231, solid black), a QSO (dotted black), and a merging and star-bursting galaxy Arp 220. Template spectra are taken from Polletta et al. (2007). Courtesy: CANDELS blog. b The spectral energy distributions (SEDs) of a typical star-forming galaxy (H-ATLAS J090713.1-000322). The total SED is in grey, with the stellar component in red and the corresponding dust emission in blue. The green curve denotes the unattenuated stellar light. Figure from Smith et al. (2012). c: Example of SED fitting - an old, dust free galaxy (blue) and a young, dusty galaxy (red) both fit the observed data points (green) in the UV to mid-infrared (MIR) regime. Courtesy: CANDELS blog.
1.2.1
Multi-wavelength study of galaxies
Based on morphologies, Edwin Hubble proposed a classification scheme dividing galaxies into spirals,
lenticulars and ellipticals (Hubble, 1926). This is the so-called Hubble tuning fork or Hubble sequence.
Later on, as more photometric filters are available to observe galaxies, a bimodal distribution of red
and blue2galaxies was discovered by the Sloan Digital Sky Survey (SDSS), see Fig.1.3-Left as an
example (Strateva et al., 2001;Bell et al., 2004;Baldry et al., 2004). This bimodality in color was later
found to be related to their morphologies, with galaxies falling in the red sequence mostly elliptical
and galaxies falling in the blue cloud mostly spiral3. The colors of galaxies is a natural result of their
spectral energy distributions (SEDs).
An SED shows the energy distribution of a galaxy across the electromagnetic spectrum, where physical
processes occur to the stars, gas, dust and possibly AGNs in galaxies leave their imprints. In Fig.1.1-a,
we show the SEDs of typical galaxies: an old elliptical galaxy, two types of spiral galaxies, an AGN, a QSO, and a merging and star-bursting galaxy Arp220. They show distinct features in their SEDs. Ellipticals show fainter emission in the UV-optical and FIR compared to spirals, because they have few young stars and little dust to emit at these two regimes. In mergers, the intensive star formation produce an enormous amount of young stars and dust that contribute to the bright UV-optical emission
2"red" and "blue": In astronomy, we define "color" as the magnitude difference of a galaxy through two different photometric filters. Conventionally, it is the magnitude of the filter at the shorter wavelength minus the other one. Then the higher the value of the color, the redder we assume the galaxy is, otherwise, it is blue.
3This is not always true as red spiral galaxies and blue ellipticals do exist, rare though (e.g.,van den Bergh, 1976;Moran
et al., 2006;Rowlands et al., 2012).
and the huge FIR bump respectively. Meanwhile, a large amount of light from young stars is absorbed by the dust. Hence its SED at UV to mid-infrared (MIR) regime resembles the one of a galaxy with
older stellar population but less dust. Fig.1.1-c shows an extreme case. The SED templates of both an
old, dust-free galaxy and a young, dusty galaxy give indistinguishable good fits to the data points. A full SED-fitting from UV to FIR is necessary to break the degeneracy in such cases.
For distant galaxies, which are much fainter, observationally, than local galaxies, the observed data points do not have very good coverage from rest-frame UV to FIR wavelengths.
Fig. 1.2:The SED of a typical Lyman break galaxy at
z≥ 3, and the images of this galaxy taken with photometric filters at Un, G, Rs bands. Courtesy: CANDELS blog.
However, taking advantage of the prominent fea-tures in the UV to MIR spectrum, the colors can be good indicators to classify galaxies. On the other
hand, according to Hubble-Lemaître law (Hubble
and Humason, 1931;Lemaître, 1931), the Universe is expanding, and the more distant the galaxy is, the faster it is receding from us. As a result, the SEDs of
distant galaxies are redshifted. Steidel et al. (1996)
identified star forming galaxies at z ≥ 3 with UnGRs
rest-frame UV colors. They used a "drop-out"
tech-nique: the Lyman break4, at ⁄ ≥ 912 Å, is redshifted
to ≥ 3600 Å at z ≥ 3. When a star-forming galaxy at z ≥ 3 is imaged with a series of filters, e.g., as in
Fig.1.2, it is invisible in the image taken with the
filter(s) covering ⁄ Æ 3600 Å, or it is "dropped-out".
In addition, the roughly flat spectrum (F‹Ã ‹0) in
the far-UV, where emission is dominated by
mas-sive stars, is the other feature they used. Star-forming galaxies selected with this technique are
called Lyman break galaxies (LBG)4. They are biased to UV bright galaxies with low dust content,
because dust would absorb the photons emitting at rest frame wavelengths longer than 912 Å, hence
the Lyman break would be washed out. BzK colors (observed frame) proposed by Daddi et al. (2004),
making use of the CIVabsorption line at 1550 Å (rest-frame, same below), the breaks and absorption
features at 2200 – 3000 Å, and the 4000 Å break5, can effectively select both star-forming galaxies and
passive galaxies at 1.4. z . 2.5. In order to include dusty galaxies, which tend to be massive so that
dust content is bound in their potential well, into the selection, rest-frame infrared colors are needed.
Williams et al. (2009) proposed a UVJ selection based on the strong bimodal behaviour found between
quiescent galaxies and dusty star-forming galaxies in the rest-frame U - V versus V - J space. The introduced infrared band, J, in V - J, is used to break the age-attenuation degeneracy while the U - V
mimics the traditional color-magnitude diagram (Strateva et al., 2001;Bell et al., 2004;Baldry et al.,
2004). Pushing forward to higher redshifts, at z > 3, Wang et al. (2016b) introduced the observed MIR
Infrared Array Camera(IRAC) band at 4.5 µm, in the H - [4.5] (observed frame) color to select massive galaxies which have been largely missed by previous methods. The H band traces the 4000 Å break at
4Lyman break is a sharp decrease in the SED at ⁄ Æ 912 Å. Energetic photons with E >13.6 keV, the ionization energy of a hydrogen atom, emit at ⁄ Æ 912 Å. They can be are easily absorbed by the hydrogen gas from the ISM within the galaxy or from the IGM outside the galaxy, hence hardly observable in the SED.
54000 Å break is caused by the blanket absorption of high energy radiation from metals in stellar atmospheres and by a deficiency of hot, blue stars. It coincides with the Balmer break at 3646 Å which arises from a similar mechanism to the one of Lyman break, but the energetic photons at ⁄ > 3646 Å ionize the first excitation state of hydrogen atom instead of ground state hydrogen atom. It is an indicator of stellar population age (Kauffmann et al., 2003)
z> 3 while [4.5] is the redshifted J as used in the UVJ (rest-frame) color selection by Williams et al.
(2009). An additional J-H (observed frame) color is used to rule out the contamination from extremely
dusty galaxies at z < 3.
With all these effective methods, a large amount of star-forming galaxies with great diversities (redshift, mass, dust content, etc.) have been accumulated to allow a systematic study of the star formation in galaxies over the cosmic history.
1.2.2
The main sequence of star-forming galaxies
The study of the present and past star formation in individual galaxies relies on detailed studies of the stellar populations within galaxies. Such studies are only feasible with galaxies in the Local Group (within 1.5 Mpc from us) due to observation limitations. However, we can study the dominant drivers of the changes in star formation of galaxies statistically.
Although galaxies show a broad diversity, many tight scaling relations have been found. Hubble tried to interpret the Hubble sequence as a galaxy evolution sequence where ellipticals formed first and
spirals later6(Hubble, 1926). With the advent of large surveys like SDSS, as mentioned previously, the
galaxy color-magnitude diagram shows a distinctive bimodal distribution (Fig.1.3-Left). The u-r color
is a proxy of specific star formation rates (sSFRs © SFR/Mstar) and the magnitude can be converted
into stellar masses. Therefore, the distribution of red and blue galaxies in the color-magnitude diagram indicates that stellar masses are regulating the star formation in galaxies. Indeed, star-forming galaxies
show a tight correlation ( with a dispersion less than 0.3 dex,Sargent et al. (2012);Schreiber et al.
(2015)) between their SFR and stellar masses over a large redshift range, from z ≥ 0 to z & 4, and
over a broad stellar mass range from down to 109.0M
§ to up to 1011.4M§(Brinchmann et al., 2004;
Elbaz et al., 2007;Daddi et al., 2007;Noeske et al., 2007;Rodighiero et al., 2011;Whitaker et al., 2012;Daddi et al., 2009;Pannella et al., 2009;Magdis et al., 2010;Heinis et al., 2013;Pannella et al., 2015; Steinhardt et al., 2014; Bouwens et al., 2012; Stark et al., 2009;Stark et al., 2013). This is the so-called "main sequence" correlation. A minority of galaxies ("starbursts", only a few percent of
the total star-forming galaxies,Rodighiero et al. (2011);Sargent et al. (2012);Schreiber et al. (2015),
see also Fig.1.4-Right) have highly elevated SFRs above the main sequence (Elbaz et al., 2011) and
there are also galaxies with deeply reduced SFRs below the main sequence. This is illustrated in
Fig.1.3-Right.
The main sequence evolves with redshift, as shown in Fig.1.4-Left, which implies that at a specific stellar
mass, a galaxy would form stars more rapidly at higher redshift, i.e., the sSFR evolves continuously with redshift. In another word, the SFR of a main sequence galaxy at high redshift would be associated to a starburst galaxy with the same stellar mass but at lower redshift. On the other hand, the dispersion of the main sequence barely evolves with redshift, which means that at a specific stellar mass and a
specific redshift, ≥ 68% of star-forming galaxies form stars at a rate within a factor of ≥ 2 (Schreiber
et al., 2015). If we define the galaxies on the main sequence as "normal" star-forming galaxies, then the normal and starburst galaxies represent the two main modes that control the growth of galaxies,
6That’s why conventionally elliptical galaxies are called "early-type" galaxies and spiral galaxies are called "late-type" galaxies.
Fig. 1.3:Left: The galaxy absolute magnitude-color diagram in SDSS filter colors, where absolute magnitude has been converted to stellar mass. Figure adapted from Schawinski et al. (2014) by S. Majewski. Right: Schematic representation of the main sequence and other galaxies with different star formation modes. Courtesy: CANDELS blog.
because starbursts are not simply an extension of main-sequence galaxies, as shown by the double
Gaussian decomposition of the starburstiness (RSB= SFR/SFRMS) distribution of star-forming galaxies
in Fig.1.3-Right. In fact, these two populations show different evolution paths. Starbursts are often
interpreted as driven by mergers which can substantially boost SFR instantaneously, while normal galaxies form stars more steadily. The low percentage of starburst in star-forming galaxies indicates that galaxy mergers have very limited contribution to the global star formation history. Moreover, at 0 < z < 3, the fraction of starbursts is not evolving with redshift, which means that the "normal" mode
dominates the star formation in most galaxies (Rodighiero et al., 2011;Sargent et al., 2012;Schreiber
et al., 2015). The steadily evolving main sequence has been used to constrain the cosmic star formation histories.
Fig. 1.4:Left: The evolution of star formation main sequence with redshift. The average SFR of star-forming
galaxies as a function of redshift and stellar mass are parameterized as in Eq.1.1, see also Schreiber et al. (2015). Right: Double Gaussian decomposition of the distribution of starburstiness (RSB= SFR/SFRMS). Figures from Schreiber et al. (2015).
The property of a galaxy is reflected on its position relative to the main sequence. For example, galaxies
along the main sequence form stars at roughly constant efficiency (SFE © SFR/Mgas) (Daddi et al.,
2010a;Tacconi et al., 2013;Genzel et al., 2015), which means that SFE is not controlled by the stellar mass of a galaxy. However, SFE increases as galaxies move above the main sequence, and stars form
more efficiently in galaxies at higher redshifts (seeTacconi et al., 2018, and references therein). Dust
properties show similar behaviours. The dust temperature, Tdust, of galaxies, is also roughly constant
along the main sequence (Magdis et al., 2012; Béthermin et al., 2015; Schreiber et al., 2016), but
it gets higher at higher redshifts (Magdis et al., 2012; Magnelli et al., 2014; Béthermin et al., 2015;
Schreiber et al., 2018a) and at higher RSB(Elbaz et al., 2011;Magdis et al., 2012;Magnelli et al., 2014;
Béthermin et al., 2015;Schreiber et al., 2018a). In the aspect of morphologies, starbursts are likely to be more compact, as indicated by the emission from the polycyclic aromatic hydrocarbon (PAH) molecules in galaxies. PAH emits in photo-dissociation regions (PDRs), which is always on the surface of molecular clouds while the FIR luminosity depends on the volume of molecular clouds. Hence, the
PAH deficit found in starbursts (Díaz-Santos et al., 2013) indicates a shrink in the surface of molecular
clouds, where star formation takes place in galaxies. The IR8 © LIR/L87proposed by Elbaz et al. (2011)
quantify the compactness of the starburst galaxies. The high SFE and compact geometry are also a natural result of galaxy mergers where the ISM are dramatically compressed, leading to enhanced SFE and morphologies are largely disturbed, resulting in a compact core at the interfaces. This again supports the association of starbursts and mergers. Although minor, starbursts may play an important role in the transition from star-forming galaxies to quiescent galaxies.
In my thesis, I adopt the parameterized main sequence as quantified in Eq (9) in Schreiber et al. (2015):
log10(SFRMS[M§/yr]) = m ≠ m0 + a0r ≠ a1[max(0, m ≠ m1 ≠ a2r]2 (1.1)
where r © log10(1+z), m © log10(Mú/109M§), m0=0.5 ± 0.07, a0=1.5 ± 0.15, a1=0.3 ± 0.08, m1=0.36 ± 0.3
and a2=2.5 ± 0.6.
1.2.3
Cosmic star formation history
As the lifetime of a human being is way shorter than the one of a galaxy, it is not possible to see how individual galaxies evolve directly with our own eyes. However, if we switch to a broader point of view, we can see the collective evolution of galaxies by looking deeper into the Universe, which is, observing the galaxies that are more distant. This is feasible because the speed of light is finite. When we look at galaxies from far away, we receive photons that were emitted from galaxies long time ago. Moreover, the universe is homogeneous and isotropic in space and time. It does not matter which direction we are looking from, or at which place we are observing. As long as we know the distance of the galaxies, we can identify we are observing galaxies from how long ago, this is the so-called lookback-time approach.
Owing to the large surveys with space telescopes like Hubble (HST), Spitzer, etc. and ground-based telescopes like the Visible and Infrared Survey Telescope for Astronomy (VISTA), the United Kingdom Infra-Red Telescope (UKIRT), etc., as well as the follow-up observations with 8-m-class telescopes like
7L8is the luminosity at 8 µm dominated by the emission from PAH molecules.
Fig. 1.5:Cosmic star formation rate density (SFRD). a: Cosmic SFRD before dust attenuation correction. b: Mean dust extinction in magnitude as a function of redshift. c: Cosmic SFRD derived from the UV data after dust attenuation correction and from IR, respectively. d: Cosmic SFRD derived from the combination of the UV data after dust attenuation correction and IR data. Figures from Madau and Dickinson (2014).
Very Large Telescope (VLT), Keck, Gemini, etc. to confirm the spectroscopic redshifts, galaxies with
redshifts as large as z = 11.1, only around 400 Myr after the Big Bang (Oesch et al., 2016), have been
identified. On the other hand, multi-wavelength observations from UV with, e.g., the Galaxy Evolutionary Explorer (GALEX) to FIR with, e.g., Herschel Space Observatory enable techniques like SED fitting to derive the properties of galaxies systematically. With abundant data in hand, astrophysicists are able
to construct a picture of cosmic star formation history (Fig.1.5, see review byMadau and Dickinson,
2014).
In Fig.1.5-ab, it is clear that a large fraction of the emission from star formation is obscured by dust and
re-emitted in the IR. The emission at UV only accounts for 10% to 40% of the total star formation rate density (SFRD). The overall dust extinction of galaxies varies with time, with the maximum occurring at around z = 1. Combining the observations at UV and IR, SFR can be calculated with high precision
with dust attenuation taken into account properly. As shown by Madau and Dickinson (2014, Fig.1.5-d),
the star formation rate density peaked at z ≥ 2, around 3.5 Gyr after the Big Bang, the so-called cosmic noon, then dropped exponentially after z < 1. Cosmic star formation at z ≥ 2 is nine times more intensive than it is today. From the profile of the cosmic SFRD, we can calculate that the majority of the stellar mass today was formed at cosmic noon, i.e., 1 < z < 3. However, we need to keep in mind that the
cosmic SFRD by Madau and Dickinson (2014) at z > 3 is poorly constrained because IR data are
missing and UV data are limited to the most luminous galaxies (e.g., LBGs) that are not representative
(Fig.1.5-c).
1.2.4
Observing star-forming galaxies in the (sub)millimeter
1.2.4.1 Observational obstacles in the FIR
As mentioned previously, the FIR emission is important to fully understand the star formation activities of galaxies. However, there are two main obstacles to measure the FIR luminosity. One is the poor atmospheric transmission in the FIR. That’s why the telescopes observing in the FIR are mostly space telescopes, i.e., IRAS, ISO, Spitzer, Herschel. And the other is that the angular resolution is worse in the FIR than at shorter wavelength as is defined by the diffraction limit of telescopes:
◊=1.22D⁄, where ⁄ is the observing wavelength, D is the diameter of the telescope or the baseline
of the interferometer. These two obstacles are resolved when we look further. The electromagnetic emission from distant galaxies is shifted to longer wavelengths, then the FIR emission is redshifted to submillimeter wavelength, hence observable on the ground by, for example, Submillimeter Common User Bolometric Array (SCUBA). Furthermore, interferometry technique has tremendously improved the angular resolution with the long baselines, which is the case for submillimeter Array (SMA), NOrthern Extended Millimeter Array (NOEMA) and Atacama Large Millimeter/submillimeter Array (ALMA), etc..
1.2.4.2 K-correction
A K-correction is applied to convert the observed-frame flux to the rest-frame flux. It depends on the
shape of SEDs. For star-forming galaxies, as already shown in Fig.1.1, the dust emission approximates
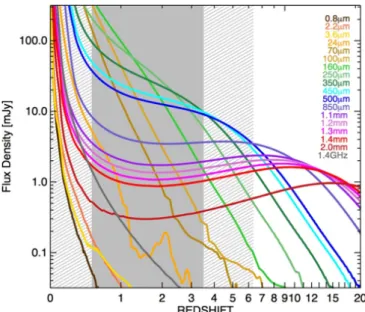
Fig. 1.6:Illustration of K-correction: The observed flux densities for a typical 1012.5L§infrared-luminous galaxy as a function of redshift. The curves are color coded with the observed wavelength. Figure from Casey et al. (2014).
a modified blackbody which peaks at ≥ 100 µm8. For one such galaxy with luminosity L, its has a
luminosity density L‹Ã ‹—+2 at the Rayleigh-Jeans regime, where — is the dust emissivity, which
has a typical value of — = 1.5 – 2.0. Simply put, if we observe at a specific observing wavelength ⁄o,
when the galaxy gets more distant, we are actually observing the emission at a shorter wavelength
⁄e= ⁄o/(1 + z), which gets brighter if it remains at the Rayleigh-Jeans regime. Then the diminishment
from the increased luminosity distance9 cancels out the elevation from the intrinsic flux density10.
Therefore the observed flux density remains roughly constant as a galaxy gets farther away, as shown
in Fig.1.6.
1.2.4.3 Galaxies detected at submillimeter
The observations of the extragalactic background light (EBL) has revealed that that the cosmic infrared
background (CIB) has the same brightness as the cosmic optical background (COB) (Fig.1.7), implying
that the amount of starlight absorbed and re-radiated by dust is comparable to the one directly from
stars (seeCooray, 2016, for a review). The CIB can be resolved into bright sources by the submillimeter
telescopes. It has been also found that star formation is more attenuated at high redshift (Hauser
et al., 1998). Especially at the cosmic noon, dust reprocessed emission dominates the star formation
emission, as much as one magnitude higher than direct starlight (Le Floc’h et al., 2005;Rodighiero
et al., 2010;Gruppioni et al., 2013;Magnelli et al., 2013), as is also shown by Fig.1.5-a. Therefore, the understanding of dust-obscured star formation at cosmic noon relies on the observation at submillimeter wavelength.
8This peak wavelength tends to shift a bit to shorter wavelength at higher redshift because of the higher Tdustas mentioned in Section1.2.2.
9The luminosity distance D
Lcan be approximated as DLÃ (1 + z)2at 0.5 < z < 3, and DLÃ (1 + z)1.5at z > 3. Given that
dust emissivity has a typical value of — = 1.5 – 2, the observed flux density barely changes with redshift. 10The observed flux density S
‹= L‹/4fiD2à (1 + z)—+2/(1 + z)4à (1 + z)—≠2at 0.5 < z < 3 or à (1 + z)—≠1.5at z > 3.
Fig. 1.7:Illustration of the SED the Cosmic Microwave Background (CMB), the Cosmic Infrared Background (CIB) and the Cosmic Optical Background (COB). Their approximate brightness in nW m≠2sr≠1is marked in the boxes. Figure from Dole et al. (2006).
Since their discovery, submillimeter-selected galaxies (SMGs, S850µm > 5 mJy, seeBlain et al., 2002,
for a review) detected by single-dish submillimeter telescopes have unveiled a population of massive galaxies undergoing extremely intensive star formation accompanied with a huge amount of dust. This means that SMGs could accumulate a huge amount of stellar mass rapidly. Hence, they have
been expected to be ideal progenitors of massive, passive and compact galaxies found at z= 1 ≥ 2
and ultimately local elliptical galaxies (Cimatti et al., 2008; Whitaker et al., 2012; Toft et al., 2014;
Simpson et al., 2014; Valentino et al., 2020b). Because of their high masses, SMGs have deep gravitational potential wells to sustain a huge amount of dust against outflows, and the heavy dust obscuration makes them extremely faint in the rest-frame UV-optical wavelength. That’s why there were not discovered until the advent of submillimeter telescopes and that’s why submillimeter telescopes are the most power tool to search for such massive objects in the early Universe. However, due to the poor angular resolution of single dishes, as mentioned previously, one detection at the resolution of more
than 15ÕÕmay turn out to be multiple sources blended in the same beam. The ALMA interferometer
array has brought unprecedented improvement to the sensitivity and spatial resolution of submillimeter observations and enables precise counterpart identifications of the SMGs and further study on their properties.
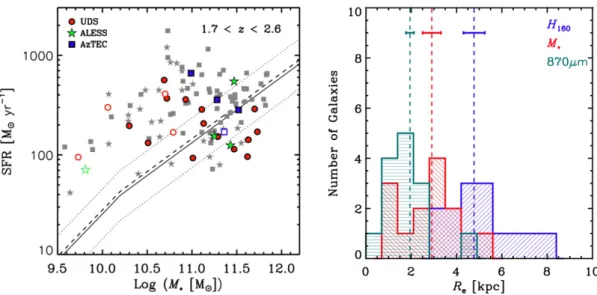
The definition of SMGs is based on the submillimeter flux, hence it is not physical. As a result, SMGs are not a homogeneous population. They show a wide variety of properties indicated by their
multi-wavelength observations (see reviews byCasey et al., 2014;Hodge and da Cunha, 2020). Especially,
when looking at the relation between their stellar masses and SFRs, some SMGs are on the main
sequence, and some fall in the starburst regime, (Fig.1.8-Left, e.g.,da Cunha et al., 2015;Danielson
et al., 2017; Lang et al., 2019; Franco et al., 2020a). In general, most SMGs show more compact
dust distribution compared to their stellar component (Fig.1.8-Right, e.g.,Elbaz et al., 2018;Hodge
et al., 2019;Puglisi et al., 2019;Lang et al., 2019), which supports the evolution path where SMGs
are progenitors of the compact quiescent galaxies at z= 1 – 2, while some studies found extended
(Rujopakarn et al., 2016;Cibinel et al., 2017). A statistic way to investigate the evolution of SMGs is to
study their number counts (Blain et al., 2002;Stach et al., 2018;González-López et al., 2020;Popping
et al., 2020). The significant normalization of the number counts challenges the current theoretical
Fig. 1.8:Left: SFR as a function of stellar mass of the SMGs at 1.7 < z < 2.6 studied by Lang et al. (2019). The solid and dotted lines indicate the main sequence and the 0.3 dex scatter from Whitaker et al. (2014). Right: Histograms of the effective radii for the ALMA 870µm continuum emission, stellar mass profiles, and H-band emission from the same work. Figures from Lang et al. (2019).
models to explain how these large number of massive galaxies formed in the early Universe (seeCasey
et al., 2014, for a review).
1.2.4.4 The GOODS-ALMA survey
The SMGs studied by ALMA have been the follow-ups of previously detected sources by single dish submillimeter telescopes and color- and mass-selected galaxies from deep surveys at optical/near-infrared wavelength. This will lead to a bias towards some specific population. In addition, the enormous dust content indicated by the bright submillimeter emission hinders some SMGs, perhaps the most massive ones, from emitting in the optical/NIR, hence missed from pre-selections. A homogeneous blind survey is needed to obtain a more general population.
The GOODS-ALMA survey (PI: D.ElbazFranco et al., 2018;Franco et al., 2020b), covers the largest
contiguous area of 69 arcmin2 in the GOODS-South field by ALMA at 1.1 mm. The original image
has a 0.24ÕÕ beam and mean depth of 110 µJy beam≠1. It was then tapered to 0.60ÕÕ to reduce the
number of independent beams, hence the number of statistical spurious detections. The rms sensitivity
is then 182 µJy beam≠1. A total of 35 galaxies have been detected above 3.5‡ in GOODS-ALMA
(Franco et al., 2020b). These include 19 galaxies detected above the 4.8‡ limit from a blind detection
approach (Franco et al., 2018) and 16 galaxies within 3.5 and 4.8‡ detected using ancillary information,
mainly Spitzer-IRAC prior positions (Franco et al., 2020b). The median redshift and stellar mass of the
S/N Ø 4.8 sources are z = 2.73 and Mı= 1.0 ◊ 1011M§, whereas the sources with a 4.8 > S/N Ø 3.5,
are both slightly closer (z = 2.40) and less massive (Mı= 7.2 ◊ 1010M§).
Compared with other blind surveys of dust continuum (Walter et al., 2016; Dunlop et al., 2017;
Hatsukade et al., 2018; Decarli et al., 2019), GOODS-ALMA is the most efficient to probe distant galaxies, not only because it covers the largest area, but also because of the strategy to observe a
shallower but wider field within a limited amount of time. This is also confirmed by the flattening at
≥ 0.1 mJy in the observed 1.1 mm number counts (Muñoz Arancibia et al., 2018; González-López
et al., 2020;Popping et al., 2020). The significant decrease of galaxies fainter than 0.1 mJy suggests that deep pencil-beam surveys would be less efficient in searching for the sources contributing to the cosmic infrared background. Despite being counter-intuitive, this can be understood by the fact that submillimeter detected galaxies tend to be the most massive ones, which are rare and bright.
Fig. 1.9:GOODS-ALMA 1.1mm image tapered at 0ÕÕ60, reaching an rms of 0.18 mJy beam≠1 (Franco et al.,
2020b). The white and blue circles with a diameter of 4ÕÕindicate the blind detections with S/N above the 4.8‡ and detections with priors at 3.5 ≥ 4.8‡, respectively. Black contours show the different slices (labeled A to F) used to construct the homogeneous 1.1 mm coverage. Blue lines indicate the HST/ACS field and the green lines indicate the HST-WFC3 deep field. The cyan contours represent the limit of the Dunlop et al. (2017) survey covering all of the Hubble Ultra Deep Field region, the yellow contours show the ASAGAO survey (Hatsukade et al., 2018), the gray contours show the ASPECS Pilot survey (Walter et al., 2016), the pink contours show the ASPECS Large Program (Decarli et al., 2019).
1.2.5
Optically-dark galaxies
As mentioned in Section1.2.3, in pre-ALMA era, our understanding of the cosmic star formation history
at z > 3 was limited to the rest-frame UV observed galaxies which are now known to under-represent the most massive and star-forming galaxies. For example, it was over a decade after the discovery of
the brightest submillimeter source in the Hubble Deep Field (Hughes et al., 1998, HDF850.1, detected
using SCUBA) that Walter et al. (2012b) finally identified with the molecular emission lines from ALMA
observations that it is a starburst galaxy at z = 5.183, and invisible in shorter wavelength. In order to better constrain the cosmic star formation in the first two billion years (z > 3) with a statistically large
sample of optically-dark galaxies, Wang et al. (2019) pre-selected 63 optically-dark galaxies based
on their NIR-MIR colors (see also in Section1.2.1) and followed them up with ALMA. They found that
these galaxies contribute ten times more to the cosmic SFRD at z > 3 compared with equivalently
massive UV- bright galaxies (Fig.1.10-Left). Different from the classic SMGs, these galaxies show an
average SFR of 200 M§yr≠1, typical of main sequence galaxies at these redshifts although with a
large scatter.
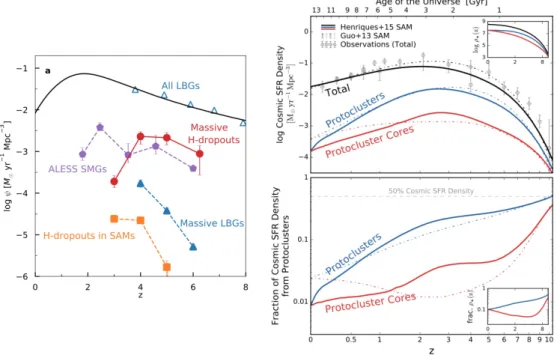
Fig. 1.10:Left: Contribution of optically dark galaxies to the cosmic SFRD. Figure from Wang et al. (2019). Right:
Upper panel: SFR density for all galaxies (black), protoclusters (blue), and cores (red). Lower panel: Fractional contributions to the total cosmic SFRD. Figure from Chiang et al. (2017).
On the other hand, Wang et al. (2019) derived the clustering properties of these optically-dark galaxies
from their cross-correlation with optically-detected galaxies with similar redshifts and masses. They found that these galaxies constitute excellent candidate progenitors of the most massive galaxies presently located in the center of massive groups and galaxy clusters. Comparing the contribution
of these galaxies to the cosmic SFRD (Fig.1.10-Left) with the one of the galaxies from protocluster
cores predicted by simulations (Chiang et al., 2017) (Fig.1.10-Right), both populations show a similar
contribution of ≥ 10≠3at 3 < z < 6, enhancing their association with large scale structures. This has
been also indicated by the multiplicity of submillimeter galaxies. The observed high number density of submillimeter galaxies relative to that derived from blank-field counts suggests that at least 30% of the
multiplicity are physically associated galaxies rather than due to pure projection effect (Simpson et al.,
2015;Stach et al., 2018).
As the largest blind survey with ALMA, the GOODS-ALMA survey also overlaps the region with the
deepest HST-WFC3 H-band imaging, down to a 5‡ depth of H = 28.2 AB (Guo et al., 2013). Out of
the 35 GOODS-ALMA detections, an ensemble of six galaxies are optically-dark since they are not
detected in the optical to near-infrared HST images including the deep H-band image. In Chapter3, I
will show my work on the detailed study of these galaxies, especially a large-scale structure they are tracing.
1.3
Star formation fueled by gas
As the key ingredient of star formation, the gas component is vital to our understanding of galaxy evolution. The physical processes involving gas span a vast range of physical scales: from the accretion of intergalactic gas (≥ Mpc), to the settling down and the cooling in galaxies (≥ kpc), to the collapse into molecular clouds (≥ 10-100 pc), then to the fragmentation into denser cores (≥ 0.1-1 pc), finally to
the formation of stars (see review byKennicutt and Evans, 2012).
In extragalactic astrophysics, we are limited by observations to the processes down to sub-kpc scale, which leads to mostly statistical studies on the gas fraction, star formation efficiency/gas depletion time, etc.
1.3.1
Gas tracers
Atomic gas, HI, is traced by the hyperfine transition of hydrogen, at 21 cm (rest-frame). Molecular
gas, H2, is more complex because the H2molecule is symmetric and has no dipolar transition. The
quadrupolar transitions can only be excited in gas with T& 100 K, which is not possible for gas in
the cold molecular clouds where star formation takes place. The second most abundant molecule, CO, can be easily excited in cold molecular clouds. It is then used to trace the bulk distribution of
molecular gas using a conversion factor from CO luminosity to H2 mass, Mmol= –COLÕCO, or from
CO line intensity to H2column density, NH2= XCOW(CO) (Bolatto et al., 2013). On the other hand,
dust is also a good tracer of molecular gas (e.g.,Magdis et al., 2012;Magnelli et al., 2013;Genzel
et al., 2015). The gas mass (H2 and HI) can be derived by fitting the far-IR to submillimeter SEDs
(e.g.Draine et al., 2007) with dust models and adopting a dust-to-gas mass ratio (e.g.Leroy et al.,
2011). Scoville et al. (2014), Scoville et al. (2016), and Scoville et al. (2017) recently proposed to
convert a single photometric measurement in the Rayleigh-Jeans tail (⁄ > 100 µm) to gas mass with a
conversion factor –850µmassuming the dominant dust temperature is 25 K and dust emission is optically
thin. Moreover, molecules like HCN, HCO+, CS are tracers of denser molecular gas in the cores of
star-forming clouds.
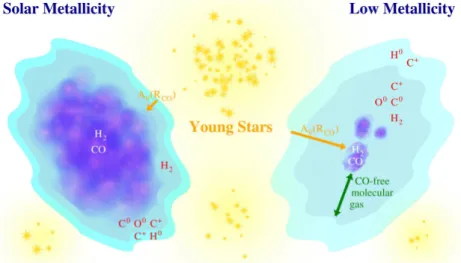
Molecular gas is extremely challenging to detect in metal poor galaxies even if some of them do show ongoing star formation. Their low metallicity indicates low dust content, which allows far-UV photons
to penetrate deeper in the molecular clouds, as illustrated in Figure1.11. Compared to H2molecules
which can effectively self-shield from the photodissociating far-UV photons, CO molecules are more
fragile and can be easily dissociated into C atoms and C+ ions. Therefore, there would be a large
fraction of the so-called "CO-dark" molecular gas outside the CO-emitting core. [CII] is much brighter
than CO in such metal poor galaxies (Cormier et al., 2015), the "CO-dark" H2gas could then be traced
by [CII] (Madden et al., 2020). However, knowing that [CII] emission originates not only from neutral
photodissociation regions (PDRs), but also from ionised gas, the calibration from [CII] to H2gas mass
requires a precise estimation of the contribution from both origins, which is still unclear (Cormier et al.,
2019;Accurso et al., 2017a). I will present my work on the search for molecular gas in one of the most
metal poor galaxies, IZw18, in Chapter4.
Fig. 1.11:Illustration of "CO dark" gas in molecular clouds. Figure from Madden et al. (2020).
1.3.2
Star formation law
The well-known scaling relation between gas column density and star formation rate surface density,
SFRÃ Ngas, was established based on the observation of the Milky Way and nearby galaxies (see e.g.,
Figure1.12,Kennicutt, 1998b;Bigiel et al., 2008) and it stands also for more distant galaxies (Daddi
et al., 2010b;Tacconi et al., 2013). This relation shows how efficiently galaxies turn their gas into stars and constrains theoretical models.
The disk averaged star formation law has been studied extensively, from local galaxies to high-z
galaxies, from normal star-forming galaxies to starbursts (see reviews byKennicutt, 1998b;Kennicutt
and Evans, 2012). A non-linear slope (N in SFRÃ Ngas, where gas is the total gas (H2 and HI)
column density) of ≥ 1.4 is found in the tight scaling relation, with SFRspanning almost five orders
of magnitude (Figure1.12). Different normalizations of the scaling relation are also found in high-z
starbursts (Daddi et al., 2010b) and metal-poor galaxies, but these results suffer from the infamous
uncertainty of the CO-to-H2conversion factor which is related to the metallicity in galaxies and this
relation is still unclear (Bolatto et al., 2013). However, Tacconi et al. (2020) found that the normalization
is indeed related to the starburstiness (” MS © SFR/SFRMS) of a galaxy, as à (” MS)0.44, based on
their study on the large sample of 14444 star-forming galaxies at 0 < z < 4. The low gas masses in
the galaxies above the main sequence are explained by their dependence on(” MS)0.44, instead the
difference in –CO.
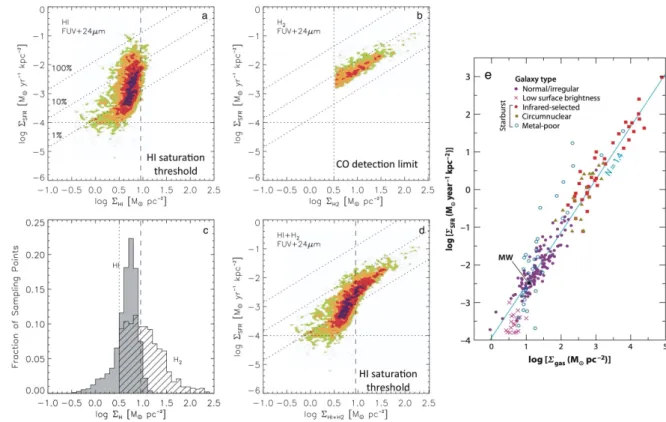
Bigiel et al. (2008) spatially resolved seven nearby spiral galaxies down to 750 pc11and studied the
atomic, molecular and total gas – star formation law in Figure1.12. While there is little correlation
between atomic gas and star formation, HIshows a clear saturation effect at ≥ 9 M§pc≠2(Figure1.12
-a, vertical dashed line). The gas with high surface density tends to be in the molecular phase.
This saturation is not seen in molecular gas, and H2 shows a good linear relation with SFR i.e.,
SFRÃ NH2with N ≥ 1 and with H2spanning two orders of magnitude from 1 M§pc≠2to 100 M§pc≠2
and SFR scattering within a factor of ≥ 2 (Figure1.12-b). This indicates a constant star formation
11They also found that the results barely change with lower resolutions until 1 kpc.
efficiency (SFE © SFR/MH2), and equivalently, a constant gas depletion time (·dep© MH2/SFR) of
≥2 Gyr. This is interpreted as evidence that star formation proceeds in a uniform way in giant molecular
clouds in spiral galaxies (Bigiel et al., 2008;Bigiel et al., 2011). They also found that the SFE declines
with radius and dwarf galaxies have similar SFEs to the outskirts of spirals as they both have low gas
density and are HIdominated.
Fig. 1.12:Left: Spatially resolved atomic (a), molecular (b) and total (d) gas – star formation law and gas column
density distribution (c). Figures from Bigiel et al. (2008). Right: Disk averaged total gas – star formation law (d). Figure from Kennicutt and Evans (2012).
Combining with recent results of the high redshift galaxies, it is found that SFE increases very slightly
with redshift and is only weakly dependent on stellar mass, as SFE ≥ (1 + z)0.6≥1, about a factor of
2 from z = 0 to z = 2.5 (Tacconi et al., 2013;Tacconi et al., 2018). Compared with the long timescale
to accumulate stellar mass in galaxies (Mstar/SFR) indicated by the main sequence as mentioned in
Section1.2.2, the short molecular gas depletion timescale implies that external gas replenishment
is needed to sustain star formation in galaxies. The cold stream framework proposed by simulations predict cold gas accretion rates proportional to the host halo mass and evolving with redshift (e.g,
Dekel et al., 2009), that leads to an agreement with the observed galaxy main sequence behaviour. However, the cold streams, i.e., the cold gas inflows, has been extremely hard to observe. Tentative
detections through extended Ly– emission in galaxy clusters have been obtained by Daddi et al. (2020)
and Ao et al. (2020). Although it is hard to confirm whether such emission originates from collisionally
excited gas infall, the study of such structures can still put valuable constraints on the presence of gas inflows.
1.3.3
Gas content
As mentioned in Chapter1.2.2, for galaxies at a specific mass, their SFRs increase with redshift
(Figure1.4), i.e., the galaxy main sequence evolves with redshift, as sSFR Ã (1 + z)3until z ≥ 2, and
sSFR Ã (1 + z)1.5 at z > 2 (Lilly et al., 2013), but saturates at z ≥ 4 (Schreiber et al., 2015). As the
fuel of star formation, the cosmic evolution of the gas content, which is related to both the specific
SFR and the gas depletion time, fgas©MMstargas = sSFR ◊ ·dep, is also important for us to test theory
and models of star formation in galaxies. The dependence of sSFR and ·dep on redshift lead to a
steep increase of gas fraction until z ≥ 2 – 3, from fgas≥ 10% in the local Universe to the highest value
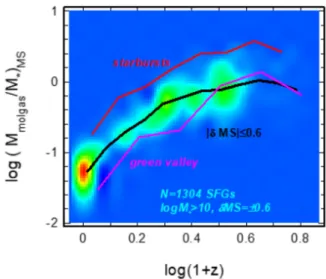
of fgas≥ 60% at z ≥ 3 (Figure 1.13). We note that these are the averaged behaviour of galaxies,
and individual galaxies can have higher or lower gas fractions. Tacconi et al. (2020) found that
gas content not only evolves with redshift, but also is related to the starburstiness and stellar mass,
fgasà (1 + z)2.5◊ (” MS)0.52◊ (Mstar)≠0.36. They suggest that the drop of gas content seen in the
high stellar mass end, as is also seen in sSFR, i.e., the fattening at the high mass end in galaxy main sequence, indicates a "mass" quenching process in the most massive galaxies.
Fig. 1.13:Molecular gas fraction as a function of redshift. Figure from Tacconi et al. (2020).
1.4
Star formation as one of the energy sources of gas
1.4.1
Gas velocity dispersion and the energy sources
Galaxies at different cosmic epochs show quite distinct properties. Compared to their high-redshift counterparts at similar stellar masses, local star-forming galaxies are larger, and have relatively lower
gas fractions and lower SFRs (Leroy et al., 2005;Daddi et al., 2010a;Tacconi et al., 2010;Madau
and Dickinson, 2014). They are also less likely to experience violent events such as major mergers
and gas accretion (Baugh et al., 1996;Genzel et al., 2008;Robotham et al., 2014). Despite of all the
various properties, galaxy discs at all epochs tend to be in a state of marginal gravitational stability,
which can be characterized by the close to unity Toomre (1964) Q parameter, as Q = Ÿ‡/fiG , where Ÿ
is the epicyclic frequency of the galaxy’s rotation, ‡ the velocity dispersion, represents the effect of
pressure, and the mass surface density, represents the effect of gravity. However, many theoretical and observational studies suggest that gas in higher-z galaxies has larger random motions compared
to gas in nearby galaxies. Galaxies at z > 1 have velocity dispersions in the range of 50–100 km s≠1
(Nesvadba et al., 2006; Lehnert et al., 2009; Lehnert et al., 2013; Förster Schreiber et al., 2009;
Wisnioski et al., 2015) and show an almost linear correlation with the SFR, while local galaxies show
typical velocity dispersions of < 50 km s≠1 (Varidel et al., 2016;Yu et al., 2019). On the other hand,
both local and high-z galaxies show velocity dispersions higher than expected from only the thermal
contribution of gas. The characteristic temperature of 104K corresponds to a typical velocity dispersion
of ≥9 km s≠1for the ionized gas emitting at H– (Glazebrook, 2013).
The dominant energy source of the non-thermal turbulent motions is unclear. Numerous drivers have
been proposed, including star formation feedback (Mac Low and Klessen, 2004;Krumholz and Matzner,
2009;Murray et al., 2010), radial transport of gas in discs due to gravitation (Krumholz and Burkhart, 2016;Krumholz et al., 2018), gas accretion from the intergalactic medium and minor mergers (Dekel et al., 2009;Glazebrook, 2013), galactic shear from the differential rotation in disc galaxies (Krumholz and Burkhart, 2015;Federrath et al., 2016;Federrath et al., 2017), etc. In Chapter5, I studied the driver of turbulent motion of eight spatially-resolved nearby star-forming galaxies. The results show that star formation feedback is not the main energy source of the turbulent motions in galaxies with
low SFR surface density. However, recent studies by Krumholz et al. (2018) and Varidel et al. (2020)
on the global properties of galaxies found that the models taking into consideration of both the star formation feedback and the gravitational energy release from radial transport of gas can yield excellent
agreement with the observations of galaxies with SFR ranging from 10≠4M
§yr≠1 to 103M§yr≠1.
The model predicts a transition from gravity-dominantly-driven turbulence in high-z galaxies to star-formation-driven turbulence in low-z galaxies, where SFR is lower. The distinct conclusions come from the different treatments of beam smearing effects, as will be explained below. This model also explains why galaxy bulges tend to form at high redshift and discs at lower redshift, and why galaxies tend to quench inside-out, because the gas accretion rate increases much faster with velocity dispersion,
than SFR with velocity dispersion ( ˙Macc à ‡3gasvs. SFR à ‡gas) and then masses are transported
more inward to a bulge in high-z galaxies and remain in the outskirts to form a disk in low-z galaxies (Krumholz et al., 2018).
1.4.2
Integral field unit (IFU), datacube and beam smearing effect
The integral field unit technique has been widely used in optical and near-IR to study galaxy kinematics.
It allows us to obtain spatially resolved spectral information in the galaxies. In Chapter5, I will present
my work on the energy sources of the turbulent motions in local star-forming galaxies making use of the
IFU survey, the SAMI Galaxy Survey (Croom et al., 2012;Bryant et al., 2015). The three dimensional
information from such IFU observations are saved in the so-called datacubes (Figure1.14). This is
similar to the data product obtained from the interferometers at submillimeter to radio wavelengths. Measurements of velocity dispersions from these datacubes are limited by the spectral and spatial resolution of the instruments. The observed emission line is broadened by the spectral resolution, but this can be addressed by convolving the line spread function into the emission line fitting. The limited spatial resolution blurs the spatial distribution of the intrinsic flux, the line of sight velocity profile, and
Fig. 1.14:Illustration of a datacube.
the line of sight velocity dispersion within the smallest resolved area. As a result, the observed velocity dispersion is elevated with the unresolved velocity gradient. This is the so-called beam smearing
effect. Several tools have been developed to account for beam-smearing effect, e.g.,3DBBAROLO12
(DiTeodoro and Fraternali, 2015),GBKFIT13(Bekiaris et al., 2016), GALPAK3D14(Bouché et al., 2015),
and BLOBBY3D (Varidel et al., 2019). They construct a 3D modelled cube for the galaxy and then
spatially convolve the cube per spectral slice to simulate the effect of beam smearing. The convolved cube is finally compared to the observed data.
12Codes available athttps://editeodoro.github.io/Bbarolo/.
13Codes available athttps://supercomputing.swin.edu.au/portfolio/gbkfit/. 14Codes available athttp://galpak3d.univ-lyon1.fr/.