HAL Id: hal-03031690
https://hal.archives-ouvertes.fr/hal-03031690
Submitted on 30 Nov 2020
HAL is a multi-disciplinary open access
archive for the deposit and dissemination of
sci-entific research documents, whether they are
pub-lished or not. The documents may come from
teaching and research institutions in France or
abroad, or from public or private research centers.
L’archive ouverte pluridisciplinaire HAL, est
destinée au dépôt et à la diffusion de documents
scientifiques de niveau recherche, publiés ou non,
émanant des établissements d’enseignement et de
recherche français ou étrangers, des laboratoires
publics ou privés.
Sensors to Track Human Activity
Ajaykumar Manivannan, Wei Chien Benny Chin, Alain Barrat, Roland
Bouffanais
To cite this version:
Ajaykumar Manivannan, Wei Chien Benny Chin, Alain Barrat, Roland Bouffanais. On the Challenges
and Potential of Using Barometric Sensors to Track Human Activity. Sensors, MDPI, 2020, 20 (23),
pp.6786. �10.3390/s20236786�. �hal-03031690�
On the use of barometric sensors to track human
activity
Ajaykumar Manivannan1 , Wei Chien Benny Chin1 , Alain Barrat2,†,‡ and Roland Bouffanais1,‡*
1 Singapore University of Technology and Design, 8 Somapah Road, 487372, Singapore. ;
[email protected] (M.A.); [email protected] (B.C.); [email protected] (R.B.)
2 Aix Marseille Univ, Université de Toulon, CNRS, CPT, Marseille, France; [email protected] (A.B.)
* Correspondence: [email protected]; Tel.: +65 6303 6667
† Tokyo Tech World Research Hub Initiative (WRHI), Tokyo Institute of Technology, Tokyo, Japan. ‡ These authors contributed equally to this work.
Version November 30, 2020 submitted to Sensors
Abstract: Barometers are among the oldest engineered sensors. Historically, they have been primarily
1
used either as environmental sensors to measure the atmospheric pressure for weather forecast, or as
2
altimeters for aircrafts. With the advent of MEMS-based barometers and their systematic embedding
3
in smartphones and wearable devices, a vast breadth of new applications for the use of barometers
4
has emerged. For instance, it is now possible to use barometers, in conjunction with other sensors, to
5
track and identify a wide range of human activity classes. However, the effectiveness of barometers
6
in the growing field of human activity recognition critically hinges on our understanding of the
7
numerous factors affecting the atmospheric pressure, as well as on the properties of the sensor
8
itself—sensitivity, accuracy, variability, etc. This review article thoroughly details all these factors and
9
presents a comprehensive report of the numerous studies dealing with one or more of these factors,
10
in the particular framework of human activity tracking and recognition.
11
Keywords: Barometer; Barometric pressure; Human activity recognition (HAR); Vertical
12
displacement activity (VDA)
13
1. Introduction
14
Barometers have been around for a very long time. While the air was thought to be weightless
15
till the early 1640s, this changed when the Italian physicist and mathematician Evangelista Torricelli
16
showed that a column of air exerts a significant force that can be measured by the amount of liquid
17
displaced by the pressing air. This led to the discovery that “air has weight", and the invention of a
18
measurement device that quantifies the atmospheric pressure [1]. In the latter part of 1640s, Blaise
19
Pascal perfected the experiment and showed the finiteness of air pressure, leading to the hypothesis
20
that the height of the atmosphere itself is finite, and to the proposition that altitude can be measured
21
as proportional to the atmospheric pressure [2]. The SI derived unit, the Pascal (Pa), is named after
22
Pascal’s contributions to hydrodynamics, and is now officially used to measure the force applied by an
23
atmospheric column of air above a unit surface area.
24
For the first two centuries after the invention of the barometer, this device was constructed using
25
glass tubes filled with liquids such as water or mercury [3]. In 1844, a new design appeared with
26
the development of the aneroid barometer, that is purely mechanical, does not contain liquids, and
27
shows the measurement value on a face dial [4]. These devices took a quantum leap with the advent of
28
micro-fabrication in the 1960s that allowed the miniaturization of the barometer and accelerometer to a
29
size smaller than 0.1 mm, what is now commonly known as Micro Electro Mechanical Systems (MEMS).
30
With the successive advancements in integrated-circuits and digitization of the sensor readings, the
31
manufacturing and the computational cost of these miniaturized devices were significantly driven
32
down, thus paving the way for their widespread adoption in consumer products, especially in mobile
33
phones. Currently MEMS-based barometers are by far the most commonly found type of barometers
34
in wearable devices and smartphones. In 2015, one of the pioneers in MEMS manufacturing, Bosch
35
(Robert Bosch GmbH) claimed to manufacture 1 billion MEMS sensors per year for automotive and
36
non-automotive applications in one production facility in Germany [5]. This company also claims
37
to have their MEMS devices (including barometers) embedded in every second smartphone in the
38
world [5]. Although this claim cannot be independently verified, it still points to the massive scale of
39
production for this type of sensor, and underscores the ubiquitous availability of MEMS barometers.
40
Historically, barometers were used for weather forecast and thus chiefly as environmental sensors.
41
As a measurement device of ambient pressure, barometers have been recently used to measure
42
evapotranspiration (transfer of water from land to atmosphere) in a given environment, improving
43
motor vehicle engine efficiency by modifying air-fuel mixture, and to count steps based on the slight
44
disturbances in air pressure during body movements [6]. Thanks to the relation between pressure and
45
altitude, barometers are also widely used as altimeters to measure altitude, in particular in airplanes
46
and Unmanned Aerial Vehicles (UAVs). Recent applications include their use in warehouses for precise
47
automated placement, retrieval, and monitoring of objects on shelves, and indoor/outdoor navigation
48
of humans and vehicles. It is worth highlighting that there is still significant opportunities for the use
49
of barometers in a vast range of additional applications. Clearly, the full potential of barometers has
50
not yet been taken advantage of, in particular in the Internet of Things (IoT) realm and with future
51
consumer devices, particularly in the fast-growing area of wearable devices.
52
In particular, the ubiquity of MEMS barometers in smartphones and other wearable devices
53
makes them natural candidates as data sources for the study of human activities and to the field of
54
Human Activity (and mobility) Recognition (HAR) [7]. Broadly speaking, HAR consists in using
55
data from various types of sensors carried by individuals to automatically understand what type of
56
activity they are carrying out. It consists therefore in choosing sensors that will be influenced by the
57
activity, annotating a certain amount of data (that will serve as "training data") thanks to ground truth
58
knowledge (i.e., the knowledge of the precise conditions in which the data was collected), and devising
59
a classification task using typical machine learning frameworks to classify the rest of the data. The
60
human activities considered can be broadly classified under two main classes: (1) Ambulation, and (2)
61
Transportation [7]. Ambulation refers to all movements and idle states of our human body (walking,
62
idle, running, sitting, etc.), while transportation refers to our movement through vehicles (cars, buses,
63
bicycles, etc.) [7]. In HAR research, such activities are considered under two conditions: (1) Natural
64
ones, and (2) Laboratory. These conditions lie at the two extremes of a spectrum: "natural" refers to
65
individuals behaving normally, within their usual environment, without any defined procedure and
66
without being influenced by their being monitored, while laboratory conditions refer to a set-up that is
67
especially designed for a human subject, who is given explicit instructions to perform a given activity.
68
In reality, most experiments with human subjects happen somewhere in between these two extreme
69
conditions.
70
Inertial Measurement Units (IMU)—comprising accelerometer and gyroscope, along with
71
magnetometer—are the most commonly used sensors to track human activity. Although the first
72
accelerometer was invented by the English physicist George Atwood in 1783, this sensor has not been
73
used in any commercial applications till the 1920s, but this changed with the advent of motor vehicles,
74
including airplanes [8]. Smartphones have been equipped from the start with accelerometers, whose
75
signals are widely used to recognize most activity classes [9].
76
Until the 1990s, it seems that there is almost no reference in the literature to the use of barometers
77
in tracking human activities. That changed with the silicon and digital revolution, which contributed to
78
the effective use of barometers to track a range of human activities in the late 1990s. Initially, consumer
devices such as mobile phones were equipped with barometers to improve GPS-based localization
80
by reporting altitude or altitude changes [9]. Today, barometers along with a suite of sensors like
81
IMU and magnetometer are used—individually or through sensor fusion—to track a wide range of
82
human activities. Such use of barometer to track human activities is a fairly recent phenomenon. In the
83
last two decades, the barometers were found to improve some activity class recognition that involves
84
change in height, such as fall or vertical mobility. In some applications such as recognizing Vertical
85
Displacement Activity (VDA), the accelerometer has been replaced by or at least given less importance
86
than barometers, which are more energy efficient, require less signal processing and yield less noisy
87
signals than IMU signals. Most smartphones have barometers allowing to predict changes in altitude
88
with an accuracy of the order of 1 meter. However, an effective tracking of human activities is best
89
obtained with the combined use of these important sensors, each providing unique information on the
90
subject’s state.
91
It is however important to note that our ability to properly leverage the potential of barometers
92
for HAR purposes critically hinges on our understanding of the physical properties of the atmospheric
93
pressure. Indeed, the measure of the ambient pressure by a barometer is influenced by the static and
94
dynamic properties of its environment [? ]. Its effective use as a signal thus requires dedicated data
95
post-processing techniques and classifiers, in general to account for external factors: for instance, if one
96
is tracking altitude changes and vertical displacement activity, the variations in the local atmospheric
97
pressure have to be accounted for. Measures are moreover affected by the sensor itself, whose accuracy
98
and manufacturing imperfections can introduce noise and variability between devices. Hence, it is fair
99
to say that the numerous factors affecting barometric pressure (see Sec.4), if not properly understood
100
and accounted for, can hinder the effective use of barometers to detect and identify particular classes
101
of human activity.
102
The current review is non-exhaustive but intentionally limited to the use of barometric sensors for
103
the most common classes of human activity. This choice is justified by the wide range of applications
104
offered and the fact that barometers now pervade many mobile devices (wearables and smartphones,
105
cars, etc). The applications explored are also primarily limited to the recent developments in using
106
MEMS-based barometers for consumer goods/electronics. It is worth stressing that this review does
107
not address the vast breadth of Machine Learning (ML) or other advanced classifiers used to interpret
108
the sensed data, and identify a given activity with a given accuracy. However, the details provided in
109
this review are most useful for the further development and design of effective ML/classifier strategies.
110
This review is organized as follows: Sec.2introduces the general sensor data collection process
111
to track human activity. Section3looks specifically into the use of barometers in human activity and
112
mobility recognition. Section4describes the factors that affect barometric pressure and quantifies the
113
order of magnitude of each effect based on a range of studies reported in the literature. This section
114
is enriched by data especially collected for illustration purposes. Lastly, Sec.5explores the potential
115
directions of future research in HAR using barometric sensors.
116
2. General sensor data collection process to track human activities
117
Barometers are part of the suite of sensors used to track, recognize, analyze, and ultimately
118
understand human activities. As such, the characteristics of the data collection process is similar to
119
the one of other types of sensors. They include the characteristics of sensors, their placement and
120
orientation, the sampling frequency, the environmental conditions. The type of application (activity
121
class, diversity of sample population) and the method to record the ground truth and annotate a part
122
of the data have also to be carefully designed. Data collection and annotation are indeed critical to
123
the effectiveness of subsequent stages of classification—e.g., data pre-processing, feature engineering
124
and identification—in the overall workflow of sensed data associated with human activity recognition.
125
Similarly, an informed decision on the data collection procedure depends on the specific problem
126
under study and on the particular class of human activity being investigated. Depending on the sensor
127
characteristics and the class to be recognized, data collection methods must be tailored to shed light
on the phenomena under investigation for better accuracy and performance. The success of such
129
data-processing activity not only depends on acquiring the data, but also in being able to effectively
130
process it and extract meaningful features and patterns.
131
2.1. Sensors and sensor suites
132
Smartphones and watches are by far the most common and straightforward way to collect data in
133
a natural setting. Nonetheless, some research groups studying particular behaviors and phenomena
134
required a custom-built wearable sensor design for both laboratory testing as well as for operations
135
in real-life conditions. For instance, 3-axis accelerometers are the most widely used sensors [10,11],
136
followed by 3-axis gyroscopes and magnetometers. Since these inertial sensors are now commonly
137
found in today’s smartphones and other MEMS devices, many recent studies use a combination of these
138
sensors to improve classification accuracy [12,13], although a 3-axis accelerometer alone can extract
139
good quality data resulting in excellent classification results [14]. Wearable devices may also contain
140
environmental sensors that measure for instance temperature, light, atmospheric pressure and sound
141
to assist in context detection, and/or physiological sensors such as heart rate for medical research [7]
142
and personal fitness purposes. In transport mode recognition, GPS is the most widely used sensor [15],
143
followed by telecommunication data [16,17], WiFi access points [18,19], and travel surveys [20]. In
144
general, location-based sensors operate based on a combination of inertial sensors to build robust
145
recognition systems that can distinguish between different travel modes, including walking and being
146
idle [21]. Fusion of environmental sensor data with inertial and location-based sensed data provides
147
sufficient information to detect what is commonly known as ‘Activities of Daily Living’ (ADL). In this
148
context, barometric pressure sensors have traditionally been considered as environmental sensors used
149
to measure ambient pressure. However, they are also capable of sensing movement/activity in ways
150
similar to inertial sensors, especially when considering vertical movements.
151
2.2. Placement and orientation of the sensor
152
Placement and orientation of the sensor might influence the characteristics of the captured signal
153
thereby affecting the recognition accuracy: indeed, the training data might then fail to account for all
154
the possible variations, resulting often in a sparse feature space. Numerous studies have focused on
155
ways to alleviate this particular effect, and provided solutions that range from collecting diverse data
156
to independent features not affected by such parameters [22–24]. Chen et al. [25] proposed the use
157
of coordinates transformation along with principal component analysis (PCA) to reduce this issue
158
associated with orientation changes. Several groups have also studied the question of optimal sensor
159
placement [26,27]. Interestingly, while this issue affects many sensors, this is not the case for barometric
160
pressure sensors whose readings are widely independent of their on-body position and orientation [28],
161
even if they are dependent on a range of environmental conditions.
162
2.3. Sampling frequency
163
The temporal resolution of the data is directly related to the sampling frequency of the sensor
164
used. For the vast majority of sensors used to carry out human activity recognition, the sampling
165
frequency typically ranges from 10 Hz to 100 Hz, with the rate going as high as 512 Hz. It is commonly
166
reported that the characteristic frequencies of most human activities are below 10 Hz, and therefore
167
the optimal sampling rate— based on the Shannon–Nyquist theorem—is 20 Hz [29]. Khan et al. [30]
168
reviewed 5 public datasets and showed that the sampling rate considered could be reduced between
169
48% and 86%, with a minimal sampling rate of approximately 12 Hz [30]. Yan et al. [31] also studied
170
the effect of sampling rate on energy consumption and they concluded that a higher sampling rate
171
increases energy load without providing additional meaningful information, in agreement with the
172
results reported in [30]. From the energy perspective, Yan et al. [31] concluded that a shorter dataset
173
with a higher sampling rate is preferable to a longer dataset at a lower sampling rate. It is worth
174
adding that the optimal sampling rate also depends on the type of human activity to be recognized [30]
and on the type of sensor used. For instance, when studying human mobility, sampling GPS data
176
or other location signals at rates comparable to those of accelerometers is unnecessary. Hence, the
177
GPS signals are typically sampled at around 1 Hz [32,33]. For pressure signals, barometers have been
178
sampled at rates as low as 1 Hz [34].
179
2.4. Activity classes
180
Lara & Labrador [7] thoroughly reviewed a comprehensive list of human activities recognized and
181
categorized in the literature, including ambulation, transportation, gestures, exercises and daily living
182
activities. The activity classes may of course occur concomitantly and may therefore be composite [35],
183
interleaved, concurrent or overlapping [36]. For data with low sampling frequency, i.e. lower than
184
1 Hz, more than one activity could be performed during the same time interval. In particular, the class
185
of vertical displacement activities (VDA) has generally been recognized in the literature as part of the
186
larger class of ambulation activities. Similar to accelerometers, barometers are very well suited for
187
the recognition of VDA. In addition, barometers can accurately determine altitude changes for VDA
188
occurring at a sampling rate lower than 1 Hz.
189
2.5. Nature of data
190
Several groups have collected their own datasets to fit the specific needs and requirements of
191
their studies [37,38]. Many benchmark datasets are also publicly available, and are commonly used to
192
validate new methods [39–42]. The recent review article [43] reported details of several key benchmark
193
public datasets and provided a rich analysis on the content and application-context studies. The
194
datasets collected and made available publicly either were collected in laboratory conditions [44], or are
195
real-world ones—where participants had instructions to perform specific activities given implicitly [45],
196
explicitly [24], or instead were allowed to move freely while being unobtrusively observed [13]. These
197
datasets have been claimed to be semi-naturalistic or realistic even when the subjects were given
198
scripted instructions [46,47]. Lara & Labrador [48] reported on subjects performing interleaving
199
activities as they naturally occur, in sequence rather than segmented to reach realistic conditions.
200
Truly realistic data correspond to data collected while people go about their Activities of Daily Living
201
(ADL) [14]. As highlighted in [49], the use of purely realistic data would however require a long data
202
collection period. Hence, segmented data obtained by a set of experiments corresponding to various
203
activity classes are typically collected for training. Some studies such as [50] and [51] have managed
204
to deal with this issue by considering segmented data for training and activities of daily living or
205
sequence data for validation.
206
2.6. Class imbalance
207
The problem of class imbalance in datasets—the fact that some activities are more prevalent than
208
others and are therefore over-represented— is a recurrent condition found in both public and private
209
datasets and known to affect recognition accuracy [47,52,53]. For instance, data corresponding to
210
physically tiring activities, or difficult to obtain for other reasons, naturally forms an under-represented
211
portion of the data, thereby leading to inherent data imbalance [38]. This issue can be offset by
212
oversampling the minority class or under-sampling the majority class. Chen & Shen [38] used the
213
so-called Synthetic Minority Over-sampling Technique (SMOTE) for oversampling the minority class
214
while Trung [54] used a modified version of it. Guan et al. [52] also proposed to use an ensemble
215
of deep learning models to offset such data imbalance. Other studies have tackled the problem by
216
simply using F1-score to report classification accuracy that takes into factor the different sizes of each
217
class [52,55]. This issue can occur in applications using barometers, as the number of altitude changes
218
in human mobility for any given continuous experiment is usually very limited, and these changes
219
have moreover typically a rather high inter-event time in ADL.
2.7. Diversity in physical characteristics
221
Data collection methods can contribute to the generalization in recognition models by allowing
222
diverse characteristics or parameters to be incorporated into the training dataset. These characteristics
223
should be representative of the final dataset to which the model is applied. One of the important
224
parameters is the user herself, whose diverse physical characteristics can be challenging to integrate
225
or model [37]. Studies generally report the user’s age, height, weight, body mass index (BMI) and
226
physical ailments, etc. for context and applicability of the study [55–58]. In the case of barometers, the
227
height of the user/carrier has only a limited effect on the use of a barometer, and the resolution of
228
most wearable sensors are within the range of placement difference. It is thus safe to assume that the
229
barometer sensor works independently of the physical characteristics of the carrier.
230
2.8. Annotation techniques
231
Stikic et al. [59] note that the accuracy of annotation is subject to a trade-off between length of the
232
data collection and the time and effort required for labelling the dataset. Indeed, if direct observation
233
is required for accuracy, this results in a prohibitively expensive requirement. De la hoz Franco et
234
al. [43] carried out a meta review of 374 papers on Human Activity Recognition (HAR) and found
235
that 60% of the used data were annotated. However, most studies record ground truth by resorting to
236
experiments in a laboratory setup with the help of researchers and supporting infrastructure [27,57,58].
237
Some studies have also relied on subject self-reporting [37,60,61], which are known to be error-prone
238
due to the obvious difficulty in marking precise times while carrying out the activities of daily living.
239
Chung et al. [13] recorded ground truth by unobtrusively following the subjects one at a time. Video
240
capturing [34,47,55,62], audio recording [63] and GPS localization have been highlighted as methods of
241
direct observation without requiring to monitor the subjects under constrained controlled conditions.
242
Recording ground-truth data for long term studies of ADL has been repeatedly acknowledged to be
243
impractical and/or prohibitively manpower intensive [49,64]. For instance, Willetts et al. [14] used
244
automatic cameras to record ground truth every 20 seconds for 143 participants over 24 hours. This
245
shows the interest of automated methods such as the active learning methods developed by Bota et
246
al. [50] that require the manual annotation of a small subset of the data, while the rest is automatically
247
labeled.
248
A practical, privacy-sensitive and unobtrusive annotation method for studies using barometers
249
to track humans over long durations is manual labeling of the data. Unlike the signal sensed by
250
accelerometers or other inertial sensors, barometric pressure can indeed be less complex to interpret.
251
However, this process comes with several challenges, one of which being the lack of complete
252
understanding of all the factors that influence barometric pressure. This important issue is addressed
253
in detail in Section4.
254
3. On the use of barometer in human activity and mobility recognition
255
For the sake of studying human activity and mobility recognition, the barometer has been
256
primarily used to measure changes in altitude (or elevation). The scale of the altitude changes varies
257
from a fall to vertical displacements like moving uphill, climbing a deck of stairs, riding an elevator,
258
etc. In recent applications, the patterns of the time series of barometric signals are shown to be a good
259
indicator of the underlying activities such as walking, idle and transportation. The rate of pressure
260
change can help to identify the mode of vertical transport and determine the vertical velocity of
261
air vehicles. Barometers are widely embedded in wearable devices and used for vertical transport
262
detection [28,65–70], indoor positioning and navigation [68,71–73], building monitoring [74], health
263
monitoring [75,76], vehicle tracking [77,78], transport mode detection [79], and GPS localization
264
improvement [68].
265
One of the earliest works on using barometer to classify vertical movement is due to Sagawa
266
et al. [80] and dates back to 1998. In [80], Sagawa et al. collected 83 minutes of data using both
accelerometer and barometer at a 100 Hz sampling frequency from 6 males between 20 and 40 years of
268
age. Their classification model was trained offline using cut-off values selected heuristically. Since
269
then, recognition and identification procedures have greatly improved thanks to a number of factors
270
including: new sensor types, larger range of sampling rates, user and device characteristics, modes
271
of carriage, power consumption, real-time demand, classification models, and finally ground truth
272
availability.
273
3.1. Barometric pressure sensor
274
MEMS Barometers are miniature sensors (<0.1 mm) manufactured by prominent companies
275
such as Bosch [77,81,82], ST Microelectronics [77,81,83], and Measurement Specialities [84]. As
276
mentioned previously, they are commonly found in wearable devices and smartphones. They have
277
high precision but relatively lower absolute accuracy than table-top barometers. Specifically, the
278
accuracy in measuring absolute pressure is low in these sensors but their relative pressure accuracy is
279
shown to be as low as±1.2 Pa [84,85], with average mobile devices having resolution of±12 Pa [28].
280
It is worth adding that the measured absolute pressure varies from one device to another due to
281
manufacturing differences and other technical factors [81].
282
3.2. Processing barometric sensor data
283
Barometers are constrained by their resolution and sampling frequency, which limit precision
284
and accuracy, and the use of their data is further constrained by the presence of noise. Some studies
285
have used filtering and signal modeling to overcome the latter problem. For instance, moving average
286
filters over a given time window is widely used for that purpose [71,84,86], followed by other Finite
287
Impulse Response (FIR) filters [87] and Infinite Impulse Response (IIR) filters [76,87–89] such as double
288
exponential smoothing [28,69]. Signal modeling like sinusoidal fitting model [90] and sigmoidal
289
nonlinear fitting are commonly used to increase the contrast of elevation changes [91].
290
The time series data of barometric pressure is generally converted to statistical [70,92], spectral [70,
291
92], temporal [70,92] or wavelet-based features [75,93], before being fed into a classifier. These features
292
are designed to enhance the detection of the specific activity of interest. Most used features are based
293
on the rate of change of pressure [69,70,79,84,94] (also known as vertical velocity or simply the slope)
294
and the standard deviation of differential pressure (dp) [74,79], that differentiates altitude changes
295
from other environmental factors that influence ambient pressure.
296
3.3. Classifiers for sensed barometric pressure
297
The choice of the classifier depends on the application at hand. It also depends on the range of
298
pressure variations and durations under consideration. Some studies have only considered indoor
299
pressure profiles of individuals [28,68], while few have considered the full Activities of Daily Living
300
(ADL) that include both indoor and outdoor events like transportation [77,79]. A person carrying a
301
barometer is indeed affected by factors present outside their specific environment, which seriously
302
limits the scope of many studies of HAR using barometer data.
303
Barometric pressure is more straightforward than inertial sensors in conveying sensed information
304
due to its fairly direct reading, which greatly simplifies the use of classifiers. The most widely used
305
classifiers are decision trees [28,65,68,82,83,87], Support Vector Machines (SVM) [75,77,95,96] and
306
threshold based models [76,91,97,98]. Clustering models such as hierarchical clustering [73,99] and
307
k-Means clustering [71], Bayesian-based classifiers [72,100,101], LSTM models [28,102] and fuzzy
308
inference models [90] have also been used. Hidden Markov Models take advantage of logical activity
309
sequences that can be associated with some activity sequences (such as riding an elevator before
310
and after walking) [103], while fuzzy inference models take advantage of context and behavioral
311
constraints [90].
312
Liu et al. [69] compared classifiers such as Random Forest, J48 decision trees, Artificial Neural
313
Networks (ANN), SVM and Naïve Bayes to classify horizontal displacement activity from vertical
displacement activity; the Random Forest classifier was found to have the highest accuracy. Vanini et
315
al. [28] compared the performance of Bayesian networks, Decision trees and Recurrent Neural Network
316
(RNN) models to recognize VDA. It has been found that RNN have a 99% accuracy while Decision
317
trees provide the optimal trade-off in terms of computational cost, energy efficiency and accuracy.
318
Some applications do not require any classifiers. For instance, state estimation like altitude and
319
vertical velocity can be determined using a Kálmán filter or one of its many variants [86,96,104–106].
320
As another example, Bollmeyer et al. [84] solely used the differential pressure to estimate altitude. Ho
321
et al. [78] used the so-called Dynamic Time Warping (DTW) technique to establish the correlations
322
between the pressure time series data and known geographical elevations to track vehicles. Similarly,
323
Hyuga et al. [107] found ways to use the variance of differential pressure to account for the variations
324
in barometric pressure associated with air velocity and the built environment; they used similarity
325
measures between pressure and known altitude to locate a train/user in a rail network.
326
3.4. Applications
327
Barometer-only studies:Very few studies dedicated to tracking human activity and/or mobility
328
are solely relying on the use of a barometer, despite the fact that their potential for applications is
329
promising. For instance, barometers have been used to measure altitude as a stand-alone measuring
330
instrument for a very long time. Taking this concept one step further, Bolanakis [81] used a dual-device
331
system to estimate the altitude of an airplane above a landing area and find the orientation angle of
332
wings.
333
The surface of the land on which we move and travel, including transportation routes, is uneven.
334
This topographical feature can be estimated using barometric pressure, and the subtle changes in
335
elevation along the travel routes can be exploited for localization of vehicles. As stated before, this
336
is however challenging due to two major factors that affect barometric pressure—built environment
337
like tunnels, bridges, etc., and the air velocity during motion. However, Hyuga et al. [107] used the
338
pauses of trains in stations between successive train rides to locate a user/train in a subway route by
339
computing the successive altitude changes and comparing them with known relative elevations of
340
train stations.
341
Similarly to accelerometer data, the signal pattern encoded in a barometer output carries sufficient
342
information to recognize a range of human activities. Ghimire et al. [87] observed the change in air
343
pressure when a person walks with hands swinging and used this gait pattern to count steps. The
344
pressure fluctuations due to vehicle motion was used by Sankaran et al. [79] to differentiate between
345
the distinct patterns produced by vehicles as opposed to walking and standing idle.
346
In climate controlled buildings, changes in barometric pressure can be detected during
347
indoor-to-outdoor transition. Wu et al. [74] moreover showed the possibility to detect the opening
348
or closing of a building’s entrance doors, even with a barometer located far from the doors, and
349
even analyzed the patterns to determine the type of door (automatic or manual). They highlighted
350
implications to building monitoring and security.
351
Applications that use only barometer data are more common in the studies concerned with
352
floor localization and recognition of VDA. In the absence of location sensors, the challenge with
353
floor localization is to have a reference pressure and associate it with the data measured by the
354
considered wearable devices at the moment they enter a given building. To obtain such a reference
355
pressure, Li [108] recommends receiving it from a location that is similar to the environment in
356
which it is deployed; this setup is important as the reference pressure obtained from reference
357
stations can potentially experience different environmental effects. Xia et al. [66] showed that the
358
barometric pressure pattern can change from floor to floor in idle settings, and hence, installed
359
a calibrated barometer in each floor to collect multiple reference pressures. Ye et al. [99] applied
360
an infrastructure-independent approach by constructing an encounter network—determined by
361
comparing simultaneous pressure changes—and use a root node to calibrate all the mobile sensors.
This method is of course prone to errors and the lack of calibration has been shown to result in an
363
accuracy of only 70%.
364
The challenge for recognizing VDA using only barometer data is that the sensor data should ideally
365
be free from all factors other than altitude that affect barometric pressure. This can be guaranteed if
366
the sensor data is collected from a controlled environment where no other factors that can be mistaken
367
for VDA occur. As shown by Bollemeyer et al. [84], Ghimire et al. [87], and Muralidharan et al. [68],
368
this can be achieved by limiting the studies to indoors where only weather, sensor accuracy and built
369
environment effects are impacting the barometric readings. Liu et al. [104] collected experimental
370
data from outdoors like mountain climbing while avoiding activities that cause adverse pressure
371
gradients like transportation. Vanini et al. [28] have demonstrated their VDA recognition capability
372
while considering ambulation and transportation, with however a limited set of activities, including in
373
particular only cable-cars as outdoors transportation mode.
374
In summary, in a specific environment and considering selected modes of activity, recognition
375
performance of VDA using barometer can be very high. More generally, in any given environment,
376
barometers are shown to perform far better or similarly to other sensors when detecting VDA, and
377
represent the only viable way to extract the magnitude of vertical displacement. Vanini et al. [28]
378
report that with barometer data, one achieves similar performance in classifying VDA compared to
379
accelerometer and GPS, but a superior one in energy efficiency and independence in terms of sensor
380
location and orientation. Muralidharan et al. [68] similarly showed that barometer-only classification
381
is significantly more accurate (99%) in recognizing modes of VDA compared to accelerometer-based
382
classification (85%). However, the accuracy for accelerometer-based classification drops below 30%
383
when the mobile phone is used for taking calls or playing games.
384
Multi-sensor studies: As just mentioned, few studies have employed barometer as the sole
385
sensor in their application. It is usually integrated with other sensors like inertial sensors [69,82],
386
environmental sensors (light, temperature, sound, etc.) [109,110], location-based sensors (GPS) [71,96],
387
and communication infrastructure (WiFi, Bluetooth, RFID, etc.) [72,73,100,110]. Several studies are
388
dedicated to improving the sensor fusion of inertial sensors with barometer, which constitutes a critical
389
step in the optimization of activity recognition [86,110,111].
390
In most classical HAR analyses, the classification accuracy in detecting VDA based on sensory
391
data without pressure is usually low [89]; this is not seen as a critical issue since VDA is not the focus or
392
priority. Increasingly, barometer has been recognized as an important sensor in HAR, where accurate
393
recognition of VDA is critical to many applications [106]. Hence, a majority of applications that aim
394
to measure altitude or track altitude changes employ a barometer as part of their sensory suite. For
395
instance, in health monitoring applications, the inclusion of barometer has been shown to improve
396
VDA recognition [44,75,95], fall detection [76,83,93], estimation of energy expenditure and physical
397
activity [44,91,97,112].
398
Accelerometers are still the predominantly used sensors in HAR, and have been widely used as
399
stand-alone sensors in recognizing many activities of daily living. They complement barometer-based
400
recognition algorithm in detecting ambulatory movements such as walking, and their use helps also
401
distinguish stairs climbing from other modes of vertical transportation like elevator and escalator [69,
402
101]—and even elevator from escalator [67]. Sankaran et al. [79], however, point to the high cost
403
associated with the use of accelerometers: demands in data acquisition (position and orientation
404
dependent), high sampling rate, complex processing and classification training.
405
For indoor localization and navigation applications, obtaining reference pressure to calibrate
406
all mobile sensors is critical for the system to work. This is more easily obtained in multi-sensor
407
applications. Pipelidis et al. [71] used light sensors to detect the transition between indoor and outdoor
408
so as to derive a reference pressure at ground level, which subsequently serves the detection of
409
floor levels. Communication infrastructures like WiFi, Bluetooth and RFID are also used to provide
410
additional location information to help assist indoor localization or transmit location specific data such
411
as reference pressures in a floor to assist barometers for calibration purposes. Tachikawa et al. [110]
even combined WiFi signal with microphone and other inertial sensory data to detect the type of
413
indoor location—restroom, desk, elevator, etc.
414
Barometers are known to speed up the GPS localization through their altitude estimation [68].
415
Conversely, the altitude information can be accessed from GPS localization [104]. Furthermore, GPS
416
or any location information can help distinguish the transportation modes from ambulation, where
417
the changes in barometric pressure can easily be misunderstood for altitude changes. Even though
418
the elevation changes are present in our transportation paths, the altitude estimation from barometric
419
pressure due to air velocity during motion can be predominant. Some studies have used the barometric
420
pressure instead of GPS to track a vehicle [44,77], but this can be very misleading as the significant
421
changes in pressure due to vehicle motion and the built environment like tunnels and bridges have
422
not been fully taken into account or even properly understood.
423
To summarize and categorize the vast breadth of applications of barometers for HAR, we have
424
gathered all this information into Table1.
425
Table 1. Categorized literature related to the application or use of barometers for human activity recognition
Reference Sensors Use of barometer Factors considered influencing barometric pressure Contributions and applications Activity class Location Time period [111] Barometer, Accelerometer and Gyroscope Estimate altitude and correct accelerometer errors
Altitude Improved IMU-Barometer Sensor fusion – Indoor Short term [82] Barometer, Accelerometer and Gyroscope Estimate altitude changes
Altitude Identify ambulation activities including VDA
Ambulation Indoor Short term
[71] Barometer, Light and GPS
Estimate altitude and floor level
Altitude Vertical indoor mapping Ambulation Indoor and outdoor Short term [101] Barometer and Accelerometer Calculate vertical displacement and estimate floor level Altitude, climate and weather, and built environment
Floor localization Ambulation Indoor Short term [86] Barometer, Accelerometer and Gyroscope Estimate altitude changes Altitude and Climate & Weather
Improved sensor fusion to track vertical motions
Ambulation Indoor Short term [72] WiFi and Barometer Estimate altitude and altitude changes Altitude, climate & weather and sensor accuracy
Improved barometer measurement error model and sensor fusion for floor localization
Ambulation Indoor Short and long term [93] Barometer and Accelerometer Estimate altitude changes
Altitude Improved accuracy by including barometer for fall detection
Ambulation Indoor Short term [89] Barometer, Accelerometer and Gyroscope Estimate altitude changes
Altitude Improved accuracy in recognizing ambulation activities including VDA
Ambulation Indoor Short term [112] Barometer and Accelerometer Estimate altitude changes Altitude, climate & weather and sensor accuracy
Detection of VDA improved the estimation of energy consumption and physical activity Ambulation Indoor and outdoor Short and long term [73] WiFi and Barometer
Estimate altitude Altitude and sensor accuracy
Improved floor localization from crowd sourcing using few devices equipped with barometer
– Indoor Short term
[85] Barometer Estimate altitude Altitude, climate & weather and sensor accuracy
Barometer measurement error modeling and correction to track air vehicle
– Outdoor Short term
[68] Barometer Estimate altitude changes and mode of vertical transportation
Altitude, climate & weather, built environment, and sensor accuracy
Identify VDA and mode of vertical transport
Ambulation Indoor Short and long term
[76] Barometer and Accelerometer
Estimate altitude changes
Altitude Improved fall detection using barometer Ambulation and transportation Indoor Short term [104] Barometer Estimate altitude Altitude, climate
& weather, and sensor accuracy
Estimation of altitude for indoor and outdoor
Ambulation Indoor and outdoor Short term [92] Barometer and Accelerometer Estimate altitude changes
Altitude Reduced position and orientation dependency using barometer Ambulation – Short term [95] Barometer and Accelerometer Estimate altitude and altitude changes
Altitude Child activity recognition including VDA to prevent injuries
Ambulation Indoor Short term [105] Barometer and Accelerometer Estimate altitude changes Altitude, climate & weather and sensor accuracy
Earliest known activity classification including VDA using barometer
Ambulation Indoor Short term [97] Barometer and Accelerometer Estimate altitude changes Altitude and sensor accuracy Detection of VDA improved the estimation of physical activity and energy expenditure Ambulation including cycling Indoor and outdoor Short term [75] Barometer, Accelerometer, Magnetometer and Gyroscope Altitude, built environment and sensor accuracy Activity recognition including VDA for health monitoring of stroke patients Ambulation Indoor and outdoor Short term [65] Barometer, Accelerometer and Magnetometer Estimate altitude changes Altitude, built environment and sensor accuracy
Identify mode of vertical transportation for indoor navigation
Ambulation Indoor Short term [69] Barometer, Accelerometer, Magnetometer and Gyroscope Estimate altitude changes Altitude, climate & weather, built environment and sensor accuracy
Improved recognition of VDA using barometer
Ambulation Indoor Short term [67] Barometer, Accelerometer, and Gyroscope Estimate altitude changes
Altitude Improved identification of VDA for indoor localization
Ambulation Indoor Short term [44] Barometer and Accelerometer Estimate altitude changes
Altitude Using barometer improved overall activity recognition including VDA and better estimate of energy expenditure
Ambulation Indoor Short term
[107] Barometer Estimate altitude and altitude changes
Altitude, air velocity during motion, and built environment
Estimate the location of traveler in a subway using only barometer
TransportationOutdoor Short term
[81] Barometer Estimate altitude and altitude changes
Altitude, climate & weather, and sensor accuracy
Evaluate sensors to estimate the altitude of airplane above ground and the orientation angle of wings using dual device systems
– Indoor Short term
[78] Barometer Estimate altitude and altitude changes
Altitude, climate & weather, built environment, air velocity due to motion, and sensor accuracy
Compared barometric pressure data with topographical elevation data to localize and track vehicles TransportationOutdoor Short and long term [100] Barometer and WiFi Estimate altitude and altitude changes Altitude, climate & weather, and sensor accuracy
Floor level identification by hybrid approach between barometer only and WiFi only method. Barometer-only approach uses crowd sensed barometer data for self-calibration and builds elevation map independently in each device
Ambulation Indoor Short term [90] Barometer, Accelerometer, and Gyroscope Estimate altitude changes Altitude and climate & weather
Improved activity recognition including VDA using barometer by considering behavioral rules and applying context in a two-step process
Ambulation Indoor Short term
[113] Barometer, WiFi and Bluetooth Estimate altitude and altitude changes Altitude, climate & weather, and sensor accuracy
Used WiFi/ Bluetooth beacon to localize the user and recorded the respective pressure as reference pressure for that floor. Any change in elevation is then used to identify the floor level
Ambulation Indoor Short term [91] Barometer, Accelerometer, Gyroscope, Magnetometer, and Foot pressure Estimate altitude change
Altitude Activity recognition including VDA for better estimation of elderly physical activity
Ambulation Indoor Short term [83] Barometer and Accelerometer Estimate altitude changes
Altitude Low-power fall detection for long-term monitoring
Ambulation Indoor and outdoor Short and long term [74] Barometer Detect door
open/close in building and estimate altitude changes
Altitude, climate & weather, and built environment
Detect door open/close to monitor building activities and recognize VDA
Ambulation Indoor and Outdoor Short and long term [114] Barometer, Accelerometer, Gyroscope, Magnetometer, and WiFi Estimate altitude and altitude changes
Altitude 3D indoor localization Ambulation Indoor Short term
[87] Barometer Detect gait patterns and estimate altitude changes
Altitude Step detection and activity recognition including VDA using barometer
Ambulation Indoor Short term
[84] Barometer Estimate altitude and altitude changes
Altitude, built environment, and sensor accuracy
Studied the different factors that affect barometric pressure in the built environment. Estimate indoor altitude.
Ambulation Indoor Short term [110] Barometer, Accelerometer, Gyroscope, Magnetometer, WiFi and microphone Estimate altitude changes
Altitude Determine location semantics such as restroom, desk, elevator, etc. using sensor fusion Ambulation Indoor and outdoor Short term [77] Barometer and GPS Detect vehicle patterns Altitude, climate & weather, built environment, and air velocity during motion
Use the effect of elevation changes in roads and air velocity due to motion to detect the motion state of a vehicle and help identify traffic congestion
TransportationOutdoor Long term
[99] Barometer Estimate altitude and altitude changes
Altitude, climate & weather, and sensor accuracy Calibration of wearable barometers using crowd-sourcing to enable floor localization. No knowledge of building or additional infrastructure is required
Ambulation Indoor Long term
[108] Barometer Estimate altitude and altitude changes
Altitude, climate & weather, built environment, air velocity during motion, and measurement accuracy Recommendations to build indoor localization from reference pressure
Ambulation Indoor Long term
[28] Barometer Estimate altitude changes
Altitude, climate & weather, built environment, and sensor accuracy
Activity recognition including VDA using only barometer and comparison with accelerometer-only and GPS-only approaches
Ambulation and transportation Indoor and outdoor Short term
[79] Barometer Detect vehicle patterns and altitude changes
Altitude, climate & weather, air velocity during motion, and sensor accuracy
Identify transportation modes and ambulation activities using barometer
Ambulation and transportation Indoor and Outdoor Short term
[66] Barometer Estimate altitude and altitude changes
Altitude, climate & weather, built environment, and sensor accuracy
Floor localization using reference pressure from multiple barometers in each floor
Ambulation Indoor Short term [70] Barometer, Accelerometer, Gyroscope, and Magnetometer Estimate altitude changes
Altitude Identify the mode of vertical transport
Ambulation Indoor Short term
426
4. Factors affecting barometric pressure
427
Atmospheric pressure is the force applied per unit area by a column of air above a specified
428
area [115]. It is caused by the gravitational pull of air molecules to the earth’s surface. Atmospheric
429
pressure as measured by a barometer is also called the barometric pressure.
430
Local atmospheric pressure is affected by several factors. From a fundamental point of view,
431
these factors include the atmosphere’s fluid properties such as density, moisture content, temperature,
432
and motion. Speaking more generally, we can attribute the change in local barometric pressure to
433
more abstract factors such as climate and weather [116–118], air velocity during motion, altitude, and
434
built environment, with intricate interplays between all these factors. The magnitudes of the resultant
435
effects vary and the corresponding ranges can be quantified for specific circumstances. Several studies
436
have attempted to quantify these effects and provide a rich understanding of the factors that influence
437
barometric pressure.
438
Table 2.Literature related to factors affecting barometric pressure.
Factors References
Climate and Weather [28,68,69,78,79,85,99,100,104,108,116–118] Built environment [66,68,74,84,101,119–121] Air velocity during motion [77–79,107,122–124]
Figure 1.Orders of magnitude of changes in pressure and of the corresponding timescales for several factors influencing barometric pressure.
4.1. Climate and weather
439
The atmospheric pressure distribution on the planet is caused by the differential heating of the
440
sun at different latitudes, which varies from the tropics to the polar regions [116]. Earth’s tilt also
441
contributes to the heating difference, as well as the nature of the surface being heated, i.e. ocean or
442
land [116]. Moisture content in the air greatly affects the pressure distribution as the dry and moist air
443
are heated differently. The differential heating hence produces high- and low-pressure regions on the
444
planet. Due to seasonal differences in heating, the corresponding pressure distribution also changes
445
seasonally [116].
446
The pressure distribution creates isobaric contours—i.e. the point along which atmospheric
447
pressure is constant [116]. By a combination of the pressure differences in these isobaric regions and
448
the Coriolis force generated by the earth’s rotation, the air is moved from one place to another, creating
449
wind. The resulting forces impact various scales, creating both the long-term climatic system of the
450
planet and the short-term weather patterns observed locally.
451
It is very important to note that all weather patterns observed are caused by very small changes
452
in pressure—i.e the maximum change in the sea-level atmospheric pressure never exceeds 5% of the
453
absolute atmospheric pressure [116]. A gentle breeze (15 km/hr) creates a pressure difference of 10 Pa
454
and a strong breeze (45 km/hr) creates 100 Pa difference [125]. Although the magnitude of wind factor
455
is significant, their time scales are often slower than the scale of the human activity to be predicted.
456
During the estimation of floor height, Liu et al. [104] showed that a windy day produces error in their
457
estimation of floor height, while Sankaran et al. [79] found that a windy day produced no significant
458
change in their prediction of mobility. Sanakaran et al. [79] further noted that neither wind nor rain had
459
any significant impact in HAR. Similarly, Vanini et al. [28], while performing their VDA classification,
460
found that neither cloudy nor rainy weather had any impact whatosever. Bao et al. [85] estimated
461
the error caused by the wind and developed a model that takes into account the dynamic pressure
462
change to remove this effect based on the wind speed. Figure2a shows an example of the effect of
463
wind on barometer data: the pressure fluctuations when the sensor is exposed to wind are slightly but
464
not significantly more erratic than the noise due to the sensor resolution.
Similar to surface heating, the upper part of the atmosphere is heated differently over the period of
466
a day. The resulting diurnal temperature variations give rise to a diurnal pressure cycle (Fig2b) [117].
467
This behavior has been well documented since the 1830’s [118], with a semi-diurnal cycle with two
468
peaks around 9am–12pm and 9pm–12am, depending on the latitude [108]. In the tropics, the first late
469
morning/afternoon cycle has the highest amplitude due to maximum heating during the day, while
470
the second night cycle has a lesser amplitude given the reduced solar heating [117]. In the mid-latitude
471
regions, these peaks are shown to have similar amplitudes for both cycles [117]. The highest pressure
472
variations are reported closer to the equator with 320 Pa between maxima and minima, while the
473
mid-latitude difference does not exceed 80 Pa [117]. Besides the periodical pressure variation, the
474
absolute pressure also changes from day-to-day [108]. These changes are, however, prominent in
475
mid-latitude regions (∼600 Pa on average) while it is smaller in the tropic (∼70 Pa on average).
476
Ho et al. analyzed pressure data from 2, 309 U.S. cities and observed that these variations are
477
less than 100 Pa per hour during 99% of the time [78], while Liu et al. [69] observed that they could
478
exceed 100-Pa for intervals larger than one hour and remained stable over short intervals of less than
479
one minute. The time scale of the diurnal pressure cycle is hence much larger than many human
480
activity time scales, and these slow variations are not concerning for applications related to study and
481
classification of human behavior [28,100]. Ho et al. [78] used reference pressure from nearby weather
482
stations to alleviate this effect when identifying the correct elevation of a vehicle path. Bao et al. [85]
483
modeled the first-order difference of this pressure cycle as a white Gaussian stochastic process. Other
484
studies have focused on using relative pressure changes called differential pressure instead of the
485
absolute pressure [68,99,100].
486
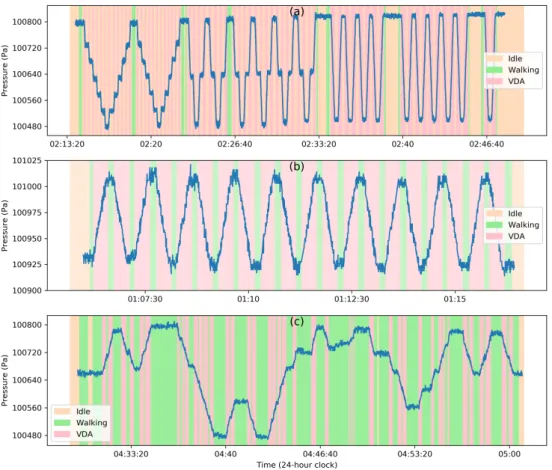
and weather.png
Figure 2.Climate and Weather (a) Diurnal pressure cycle in Singapore (b) Effect of wind. Recorded by custom-made device (barometer model - BMP280) with∼1 Hz sampling rate.
4.2. Built environment
487
Ambient pressure can be controlled in an enclosed space using mechanical systems like Heating,
488
Ventilation, and Air-conditioning (HVAC) systems [119]. Absolute and relative barometric pressure
489
can thus be affected by these control systems. Buildings are positively pressurized compared to the
490
exterior so as to have an outflow of air [120]. The magnitude of pressure differences is recommended
491
by architects and regulatory authorities based on the function of the space. A minimum of 2.5 Pa
492
is required for general living spaces, while a clean or aseptic isolation room is kept in a pressure
493
difference of 12∼50 Pa to avoid contamination from outside.
494
Lstiburek et al. [121] list the four types of pressure field experienced by a building: 1. exterior
495
field—outside a building, 2. interior field—inside a building room, corridors, stairwells, etc., 3.
496
interstitial field—building cavities, and 4. air conveyance system field—air supply, heating, exhaust
497
systems, etc. The temperature, moisture, and pressure inside a building hence fluctuate over the day
498
by the interaction of these pressure fields caused by the building structure, climate & weather, and
499
the mechanical systems inside the structure [121]. Bollmeyer et al. [84] observed that temperature and
humidity changes in a room have very little impact on barometric pressure. For instance, a temperature
501
change of 10 degrees Celsius causes a±1 Pa change, while a humidity change from 10% to 90% creates
502
a pressure difference of less than 0.12 Pa.
503
Muralidharan et al. [68] observed that the type of building space (tall, short, narrow and/or
504
wide) and building pressurization also have little effects on barometric pressure measurement. They
505
recorded pressure differences of less than 20 Pa even across multiple days. Xia et al. [66] similarly
506
found no significant effects due to air-conditioning in their prediction of floor location.
507
Even if HVAC systems and the built environment have little effects on HAR, the transition
508
between indoor and outdoor has been shown to produce noticeable pressure changes. Wu et al. [74]
509
found that a constant pressure difference of 25 Pa between the interior and exterior of a building
510
creates a pressure difference of 20∼40 Pa measured by barometer integrated to smartphones when
511
carried during a door opening. Similarly, Bollmeyer et al. [84] found a 30 Pa jump when a door is
512
opened and a 20 Pa jump when a window is opened. Lstiburek et al. [121] showed in 2002 that indoor
513
air-conditioning can lead to pressure changes of approximately 2 Pa. More recently, Xu et al. [101]
514
measured pressure differences between a room and the exterior of approximately 40 Pa.
515
4.3. Air velocity during motion
516
Vehicles like cars and buses are in quasi-equilibrium with their environment due to the vents and
517
ducts allowing the airflow in. This means that the barometric pressure inside a vehicle is very close to
518
the exterior pressure. Note that the term ‘exterior’ denotes the air pressure in the immediate vicinity
519
of the vehicle and not the ambient pressure far from it, which could be drastically different. This is
520
due to the fact that ambient pressure is increased by the vehicle’s motion near its surface where the
521
dynamic pressure increases and the static pressure falls. The stagnation pressure on the surface caused
522
by stopping the airflow near the surface produces a pressure distribution across the vehicle. This, in
523
turn, creates pressure fluctuations inside the vehicle whenever its motion changes. However, this effect
524
is transient and a quasi-equilibrium is reached quickly between interior and exterior. Figures3a and
525
3b illustrate this behavior when a barometer is carried by a human subject during a bus and car ride
526
respectively, where limited pressure fluctuations (∼50 Pa) are observed.
527
On the other hand, the transition between stationary and moving vehicle can be quite noticeable.
528
Ho et al. [78] found that the opening of a door/window during driving creates pressure changes of
529
up to 30 Pa. During a car ride, they showed that switching the air-conditioning on and off created a
530
pressure difference of 50 Pa [78]. It is very challenging to attribute it to climate-control system alone
531
as the air-conditioning also brings in ventilated fresh air from the outside. However, Dimri et al. [77]
532
observed that although there is a range of pressure jumps between different driving conditions (window
533
open/closed, door open/closed, and AC on/off), this did not affect the prediction of whether a vehicle
534
was stationary or in motion. This shows that during vehicle motion, air velocity can substantially
535
determinate the pressure jumps more than the vehicle environment itself. More importantly, the
536
pressure fluctuations experienced by the vehicle during its motion are predominant. This is shown in
537
Fig.3c, where successive accelerations and decelerations of the train create significant pressure drops
538
and rises respectively when it leaves and approaches a stop.
539
This effect can be severely amplified by the built environment such as tunnels for instance.
540
Vehicles passing through a tunnel experience a “piston effect", where air is pulled inside the tunnel as
541
the air is pushed back by the vehicle in motion [122,126]. This is shown in Figure3b, where the car
542
entering a tunnel leads to a drastic change of more than 200 Pa in the pressure measured inside the
543
car. This effect has been shown to create a train of compression waves throughout the tunnel similar
544
to sonic booms [123]. Sankaran et al. [79] showed that the pressure fluctuations during underground
545
subway rides can exceed 200 Pa compared to a bus ride that shows fluctuations of∼50 Pa. Barnes et
546
al. [124] analyzed road vehicle passage through tunnels in the Boston metropolitan area and found
547
that the smaller the clearance between vehicle top and the tunnel roof, the higher the negative pressure
548
drop on the sensor fixed to the tunnel roof, measuring a drop of 100 to 250 Pa for a clearance of 1.4 m
to 0.4 m. During subway rides, we can clearly distinguish between a train stop and motion [79] (see
550
also Figure3c). By combining this behavior with relative elevation data of train stations, Hyuga et
551
al. [107] used the pressure jumps to estimate the location of a user during a subway ride.
552
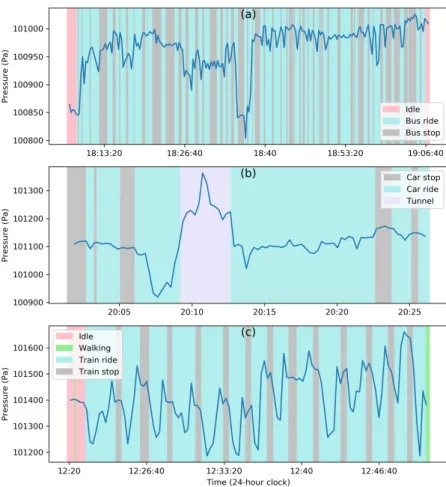
velocity during motion.png
Figure 3. Illustration of the effect of air velocity during motion (a) Bus ride (b) Car ride and the effect of built environment (Tunnel) (c) Subway train ride. Each panel shows the effect of air velocity during motion on the barometric pressure, with different modes of transport showing different types of changes. Subway train rides yield the highest changes in magnitude ( ∼200 Pa), while bus and car rides show relatively smaller amplitude changes ( ∼50 Pa), except when a car is entering a tunnel. The panels also show the effect of elevation changes during travel. In panel (a), there is a fall and rise in pressure around 18 : 35, corresponding to a climb and descent on the road path. Similarly, a drop and rise in pressure is observed in panel (b), where the car climbed and descended on an elevated bridge just before entering a tunnel. In panel (c), the acceleration of the train as it leaves the stop creates a sudden pressure drop, and a rise in pressure is subsequently observed as it approaches a stop, followed by a small dip in pressure as the train comes to equilibrium with the station environment, thus creating a repeating pressure pattern. Data was recorded by carrying a custommade device (barometer model -BMP280) in different transport modes with a sampling rate∼0.06 Hz.
4.4. Altitude
553
Atmospheric pressure falls as we travel vertically upward above the earth’s surface. This is due
554
to the earth’s gravitational pull of air molecules to the surface, which gives rise to a pressure gradient
555
equals to−ρg, where ρ is the air density and g is the local acceleration of gravity. As a consequence,
556
the rate of change of altitude with pressure is almost linear near the earth’s surface while it is almost
557
exponential at higher altitudes when taking into account the variations of the air density with pressure
558
and temperature [115]. This is again due to gravity which is stronger near the earth’s surface combined
559
with the fact that air molecules in lower atmosphere are compressed by the air molecules above