HAL Id: tel-01272159
https://tel.archives-ouvertes.fr/tel-01272159
Submitted on 10 Feb 2016HAL is a multi-disciplinary open access
archive for the deposit and dissemination of sci-entific research documents, whether they are pub-lished or not. The documents may come from teaching and research institutions in France or abroad, or from public or private research centers.
L’archive ouverte pluridisciplinaire HAL, est destinée au dépôt et à la diffusion de documents scientifiques de niveau recherche, publiés ou non, émanant des établissements d’enseignement et de recherche français ou étrangers, des laboratoires publics ou privés.
Influence of the casting microstructure on damage
mechanisms in Al-Si alloys by using 2D and 3D in-situ
analysis
Long Wang
To cite this version:
Long Wang. Influence of the casting microstructure on damage mechanisms in Al-Si alloys by using 2D and 3D in-situ analysis. Mechanics [physics.med-ph]. Ecole Centrale de Lille, 2015. English. �NNT : 2015ECLI0004�. �tel-01272159�
E
COLEC
ENTRALE DEL
ILLETHESE
présentée en vue
d’obtenir le grade de
DOCTEUR
en
Spécialité : Mécanique
par
Long WANG
DOCTORAT DELIVRE PAR L’ECOLE CENTRALE DE LILLE
Titre de la thèse :
Influence of the casting microstructure on damage mechanisms
in Al-Si alloys by using 2D and 3D in-situ analysis
Étude de l’influence de la microstructure sur les mécanismes d’endommagement
dans des alliages Al-Si de fonderie par des analyses in-situ 2D et 3D
Soutenue le 23 janvier 2015 devant le jury d’examen :
Rapporteur Karl-Heinz Lang, Docteur Ingénieur, IAM, Karlsruhe Institutes of Technology (KIT), Allemagne
Rapporteur Yves Nadot, Professeur, Pprime, ENSMA, Poitiers
Président du jury Jean-Yves Buffière, Professeur, MATEIS, INSA Lyon, Villeurbanne
Examinateur Tilmann Beck, Professeur, Institute of Materials Science and Engineering, Technische Universität Kaiserslautern, Allemagne
Examinateur Julien Réthoré, Chargé de Recherche CNRS, LaMCoS, INSA Lyon, Villeurbanne
Invité Fabien Szmytka, Docteur Ingénieur, PSA Peugeot Citroën, Vélizy
Co-encadrante Nathalie Limodin, Chargée de recherche CNRS, LML, École Centrale de Lille, Villeneuve d’Ascq
Co-encadrant Ahmed El Bartali, Maître de Conférences, LML, École Centrale de Lille, Villeneuve d’Ascq
Directeur de thèse Eric Charkaluk, Directeur de Recherche CNRS, LML, École Centrale de Lille, Villeneuve d’Ascq
Thèse préparée au Laboratoire de Mécanique de Lille (UMR CNRS 8107) Ecole Doctorale SPI 072 (Lille I, Lille III, Artois, ULCO, UVHC, EC Lille)
REMERCIEMENTS
Je tiens tout à bord à remercier tous les membres du jury pour avoir accepter d’examiner ce travail et pour l’intérêt qu’ils lui ont porté.
Je tiens à remercier chaleureusement mon directeur de thèse Eric Charkaluk, Directeur de Recherche au CNRS, mon encadrante Nathalie Limodin, Chargée de recherche au CNRS, et mon encadrant Ahmed El Bartali, Maître de Conférences à l’Ecole Centrale de Lille, pour la confiance qu'ils m'ont accordée en acceptant d'encadrer ce travail doctoral, pour la disponibilité, les précieux conseils et le soutien qu’ils m’ont apportés. Pendant les 40 mois de ma thèse, ils m’ont beaucoup aidé pour mes recherches, mes études et ma vie en France. Je suis très heureux d’avoir eu l’occasion de travailler avec eux pour ma thèse. Je leur exprime toute ma gratitude. Ils sont inoubliables.
J’aimerais par ailleurs souligner la contribution importante d’autres personnes et d’autres établissements à l’aboutissement de ce travail.
Je tiens à remercier le financement de China Scholarship Council (CSC) et le support de PSA Peugeot Citroën pour ma thèse.
Je tiens à remercier particulièrement Jean-Yves Buffière, Professeur à l’INSA-Lyon, et le Laboratoire MATEIS (INSA-Lyon) pour leur aide et leur support technique en caractérisation de matériaux et en essais de traction/fatigue avec observations 3D in-situ.
Je tiens à remercier Julien Réthoré, Chargé de Recherche au CNRS, pour la plateforme MIC3D. Les corrélations pour les essais de traction 3D ont été effectuées avec cette plateforme.
Je tiens également à remercier David Balloy, Professeur à l’Université Lille 1, pour son aide et son assistance avec le Microscope électronique à balayage (MEB).
Je remercie aussi le Swiss Light Source (SLS) du Paul Scherrer Institut (PSI) pour l’essai de fatigue 3D.
Je remercie l’ensemble du personnel du Laboratoire de Mécanique de Lille (LML) et de l’Ecole Centrale de Lille, plus particulièrement : Jean-Francois Witz (corrélations 2D et 3D), Rian Seghir (corrélations 3D), François Lesaffre (usinage des éprouvettes) , Alexandre Mege-Revil (MEB) , Fabienne Delepaut (secrétariat) , Xiaogang WANG (corrélations 2D), Gregory Hauss (Avizo), Nora Dahdah (essais de fatigue 3D) ainsi que tous mes collègues et amis de l’équipe MaSTR et de l’équipe ER5 au LML pour leur gentillesse et l’ambiance amicale qu’ils font régner.
Enfin, ces dernières lignes sont destinées à mes parents, toute ma famille et mes amis que je voudrais remercier pour m’avoir soutenu et encouragé.
I
Contents
Contents ... Ⅰ List of Figures ... Ⅳ List of Tables ... XIII
Chapter 1 Introduction ... - 1 -
1.1 Background ... - 1 -
1.2 Aim and objectives ... - 3 -
1.3 Thesis structure ... - 3 -
Chapter 2 Literature review ... - 5 -
2.1 Introduction ... - 6 -
2.2 Al-Si Casting Alloys ... - 6 -
2.2.1 Introduction ... - 6 -
2.2.2 Microstructure of Al-Si Casting Alloys ... - 7 -
2.2.3 Lost foam casting ... - 19 -
2.3 Micromechanisms of fatigue damage in Al-Si casting alloys ... - 22 -
2.3.1 Influence of casting defects ... - 22 -
2.3.2 Influence of microstructural constituents/features ... - 25 -
2.4 Summary of literature review ... - 32 -
Chapter 3 Material Characterization ... - 36 -
3.1 Introduction ... - 37 -
3.2 Characterization methods ... - 38 -
3.2.1 Optical microscope observation ... - 38 -
3.2.2 SEM observation ... - 39 -
3.2.3 X-ray microtomography observation ... - 39 -
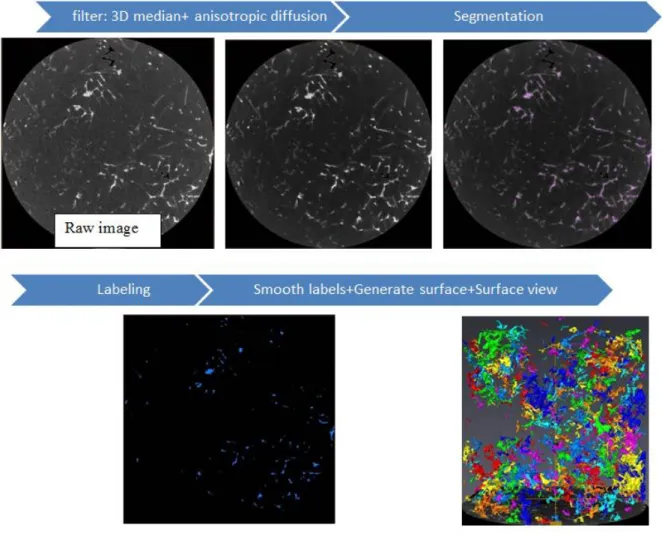
3.2.4 Image analysis process ... - 45 -
3.3 „Phases‟ morphologies and sizes ... - 50 -
3.3.1 Microstructure of A319 alloy ... - 50 -
3.3.2 Microstructure of A356 alloy ... - 75 -
3.4 Comparisons ... - 79 -
3.5 Summary ... - 82 -
II
4.1 Introduction ... - 85 -
4.2 Extraction of specimens ... - 86 -
4.3 Preparation and selection of specimens ... - 89 -
4.4 Experimental protocol ... - 93 -
4.4.1 In-situ observation methods ... - 93 -
4.4.2 Mechanical ... - 95 - 4.4.3 Postmortem analyses ... - 97 - 4.5 Field measurements ... - 99 - 4.5.1 Basic principles ... - 99 - 4.5.2 DIC ... - 100 - 4.5.3 DVC ... - 103 - 4.5.4 Measurement uncertainty ... - 105 - 4.6 Summary ... - 108 -
Chapter 5 Damage mechanisms in Al-Si alloys ... - 109 -
5.1 Introduction ... - 110 -
5.2 Tensile damage mechanisms ... - 110 -
5.2.1 Tensile tests with 2D in-situ observations ... - 110 -
5.2.2 Tensile tests with 3D in-situ observations ... - 120 -
5.2.3 Discussion ... - 128 -
5.3 Fatigue damage mechanisms ... - 132 -
5.3.1 Fatigue tests with 2D in-situ observations ... - 132 -
5.3.2 Fatigue tests with 3D in-situ observations ... - 152 -
5.3.3 Discussion ... - 164 -
5.4 Summary ... - 173 -
5.4.1 Experimental protocol ... - 173 -
5.4.2 Damage mechanisms... - 174 -
Appendix I Digital image processing and analysis ... - 185 -
I.1 Digital image processing fundamentals ... - 185 -
I.1.1 Filters ... - 185 -
I.1.2 Binning ... - 186 -
I.1.3 Image segmentation ... - 186 -
I.1.4 Morphological image processing ... - 191 -
I.2 DAS measurements in 3D rendered image ... - 193 -
Appendix II FEM simulations ... - 195 -
II.1 Mesh model ... - 195 -
II.2 FE calculations ... - 196 -
III
Appendix III Selections of specimen and ROI ... - 198 -
III.1 Tensile tests with 2D in-situ observations ... - 198 -
III.1.1 Specimen T1 ... - 198 -
III.1.2 Specimen T2 ... - 199 -
III.2 Tensile tests with 3D in-situ observations: Specimen T3 ... - 199 -
III.3 Fatigue tests with 2D in-situ observations ... - 200 -
III.3.1 Specimen F1 ... - 200 -
III.3.2 Specimen F2 ... - 202 -
III.4 Fatigue tests with 3D in-situ observations ... - 204 -
III.4.1 Specimen F3 ... - 204 -
III.4.2 Specimen F4 ... - 205 -
Appendix IV Field measurements ... - 207 -
IV.1 Principles of 2D/3D image correlation platform at LML ... - 207 -
IV.2 Examples of parameters for Elastix software ... - 208 -
Appendix V Crack length measurements in 2D ... - 212 -
Appendix VI Fracture analysis using SEM-EDS ... - 213 -
VI.1 Specimen F1 ... - 214 -
VI.2 Specimen F2 ... - 215 -
VI.3 Specimen F3 ... - 216 -
VI.4 Specimen F4 ... - 218 -
References ... - 220 –
IV
List of Figures
Figure 1-1 Cylinder head and temperature field in the fire deck (PSA data) ... - 2 -
Figure 1-2 LFC and DC casting process (Tabibian, 2011) ... - 2 -
Figure 1-3 Comparisons between A319-LFC and A319-DC: (a) normalized axial stress cyclic versus number of cycles (Tabibian et al., 2010); (b) stabilized hysteresis loop (Tabibian, 2011). ... - 2 -
Figure 2-1 Commercial cast Al-Si alloys. (a) Al-Si equilibrium diagram and microstructure of (b) hypoeutectic (1.65-12.6 wt% Si), (c) eutectic (12.6% Si), and (d) hypereutectic (>12.6% Si) alloys. (Warmuzek, 2004) ... - 8 -
Figure 2-2 Solidification process of Al-Si Alloy (Albonetti, 2000) ... - 8 -
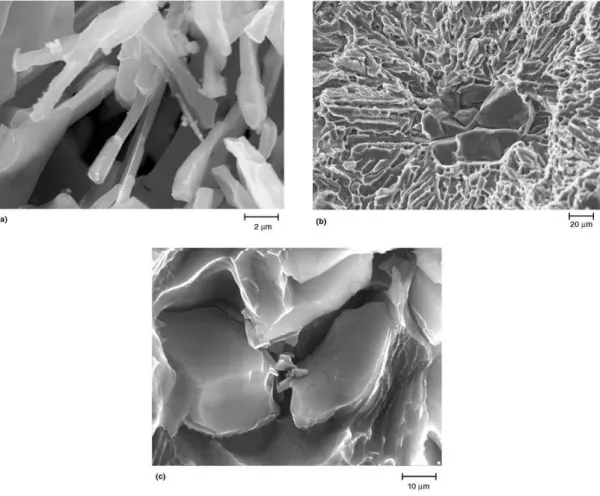
Figure 2-3 Morphology of the Si crystals in Al-Si alloys observed with Scanning Electron Microscope: (a) in eutectic and (b) in hypereutectic as-cast alloys, and (c) in modified hypoeutectic alloy after heat treatment. (Warmuzek, 2004) ... - 10 -
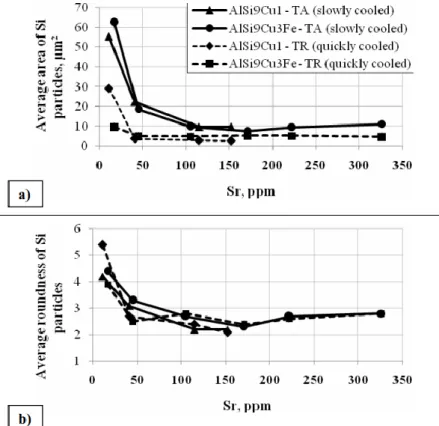
Figure 2-4 Optical micrographs of : (a) unmodified AlSi7 alloy showing plate-like Si eutectic structure and (b) modified AlSi7 + 150ppm Sr with coralline-like Si structure. (Barrirero et al., 2013) - 11 - Figure 2-5 Effects of Sr on the parameters of the eutectic Si particles (Kosa et al., 2012) ... - 11 -
Figure 2-6 A series of reconstructed images from independently nucleated complex β plates, taken at several time steps during their growth by using synchrotron tomography (Terzi et al., 2010). ... - 12 -
Figure 2-7 Microstructures of Al-Si alloys with (a) 0.3 wt% and (b) 0.7 wt% Fe, respectively (Lu and Dahle, 2005). ... - 13 -
Figure 2-8 Micrographs obtained from : (a) an unmodified base Al alloy; and (b) a Sr-modified Al alloy in as cast condition (E. M. Elgallad, 2010) ... - 14 -
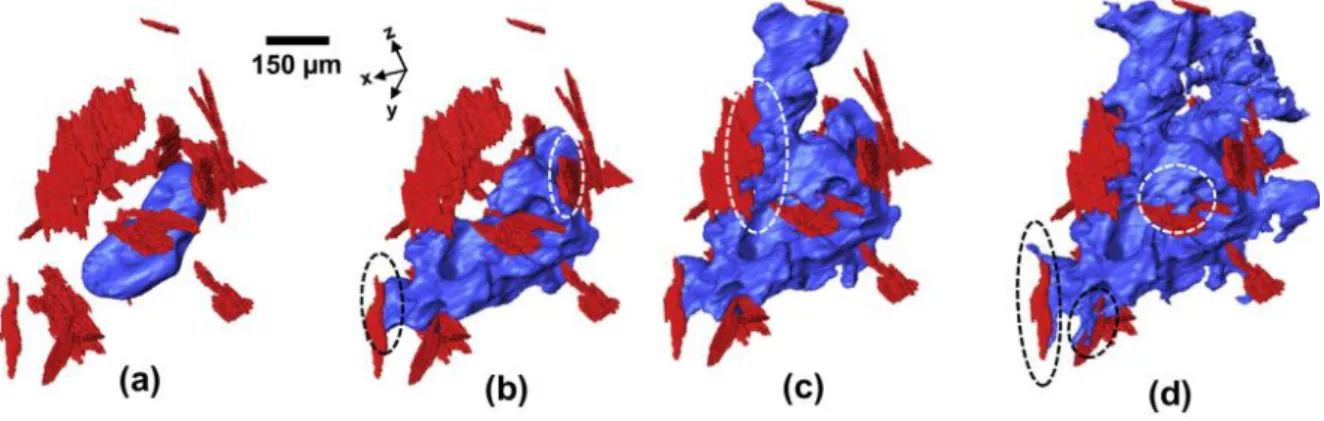
Figure 2-9 Volume fraction of β platelets as a function of solidification time (Salvo et al., 2012). - 14 - Figure 2-10 3-D rendering of pore evolution (blue) in the presence of intermetallics (red) in an A319 alloy at: (a) 565°C, (b) 561°C, (c) 555°C and (d) 550°C. Examples of pore growth along the solid surface of intermetallics are shown in dashed black and white circles (Puncreobutr et al., 2014). . - 15 -
Figure 2-11 Backscattered electron image of an as-cast AlCuSiFe based alloy (E. M. Elgallad, 2010) . - 16 - Figure 2-12 Focussed Ion Beam cross-section of an Al−Si−Cu alloy (a) without Ce and (b) with 0.02% Ce (Voncina et al., 2014) ... - 16 -
Figure 2-13 (a) Segmented Mg2Si coral and (b) segmentation of the phase contrast images of Mg2Si (blue) and the small particles of eutectic Si (including some small Mg2Si particles) (yellow) from tomography images (Tolnai et al., 2009). ... - 17 -
Figure 2-14 Four types of pores in aluminum castings (Monroe, 2005)... - 18 -
Figure 2-15 Illustration of gravity die casting (Niane and Michalet, 2011) ... - 19 -
Figure 2-16 The basic steps of the LFC process (American Foundry Society, 2004) ... - 20 -
V
Figure 2-19 Evolution of pore size with cooling rate for different hydrogen contents in alloy A356.0. Hydrogen content (cm3/100 g): 1, 0.25(no grain refiner); 2, 0.31 (grain refined); 3, 0.25 (grain refined);
4, 0.11 (grain refined); 5, 0.31 (grain refined and modified) (Kaufman and Rooy, 2004). ... - 22 -
Figure 2-20 Interaction of a fatigue crack with Si particles: (a) at ΔK=6 MPa√ a fatigue crack along a grain boundary (left) ran into a Si particle (A) and deflected to follow the interface, causing the particle A to fracture; (b) interface and particle fracture at Si particle (B) located ahead of the crack tip; (c) linkage of the main crack with particle cracks at ΔK=8 MPa√ ; and (d) crack coalescence by fatigue crack growth through the matrix ligament at ΔK=10 MPa√ . The loading axis is vertical (Chan et al., 2003). ... - 26 -
Figure 2-21 SEM micrograph showing fracture of both iron and copper intermetallics in an Al-Si alloy with 0.8%Fe (Ma et al., 2014). ... - 27 -
Figure 2-22 Typical SEM image and EDAX analysis from a thermal-shock crack propagated through the pores and developed by debonding and cracking of (a) large Cu rich and (b) Cu–Mg rich intermetallics in an A319 alloy (Arami et al., 2008). ... - 29 -
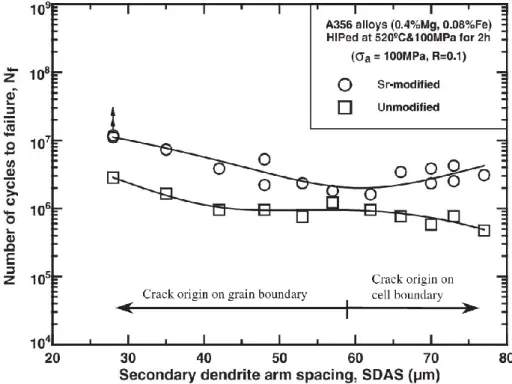
Figure 2-23 Fatigue life for unmodified and Sr-modified A356-T6 alloys as a function of SDAS (Wang et al., 2001b). ... - 30 -
Figure 2-24 Examples of slip bands on the fracture surface indicating the local yielding and dislocation movement (Wang et al., 2001b). ... - 31 -
Figure 2-25 SEM image showing a PSB crack in A356 alloy (Zeng et al., 2014) ... - 32 -
Figure 3-1 OM images of an A356 specimen (a) before and (b) after etching ... - 38 -
Figure 3-2 (a) Principle of tomography; (b) Synchrotron and laboratory tomography. (Salvo et al., 2010) ... - 40 -
Figure 3-3 Absorption contrast and phase contrast. ... - 41 -
Figure 3-4 A CT slice of an A319 alloy from: (a) Lab-CT (only absorption contrast) and (b) SR-CT (absorption and phase contrasts). ... - 41 -
Figure 3-5 (a) Locations of the scans in Specimen 1 (A319) and (b) 3D rendering of the region analyzed in „scan4‟ ... - 43 -
Figure 3-6 (a) Location of the scan in Specimen 2 (A319) and (b) 3D rendering of the analyzed region ... - 43 -
Figure 3-7 (a) Location of the scan in Specimen 3 (A356) and (b) 3D rendering of the analyzed region ... - 44 -
Figure 3-8 Scheme of image processing and analysis ... - 45 -
Figure 3-9 Scheme of image processing and analysis for Specimens 1 and 2 in Avizo ... - 47 -
Figure 3-10 Scheme of image processing and analysis for Specimen 3 in ImageJ ... - 47 -
Figure 3-11 Illustrations of (a) Feret diameter, (b) minimum bounding box and (c) 3D coordinate system in Avizo software (ZIB et al. 2012) ... - 49 -
Figure 3-12 OM images of A319 alloy: (a) shrinkage and (b) gas pores (after etching) ... - 51 -
Figure 3-13 BSE images of A319: (a) shrinkage and (b) gas pores ... - 51 -
Figure 3-14 Relation between equivalent and Feret diameters of pores (Specimen 1) ... - 52 -
Figure 3-15 3D renderings of pores having a Feret diameter (a) less than 20 µm, (b) 20-100 µm, (c) more than 100 µm (Specimen 1) ... - 52 -
VI
Figure 3-16 A close-up view of the largest pore (in yellow) in Figure 3-15 ... - 53 -
Figure 3-17 Distributions of pores as functions of equivalent and Feret diameters (Specimen 1) .. - 54 -
Figure 3-18 Granulometry distribution of pores (Specimen 1) ... - 54 -
Figure 3-19 Variability of 3D analysis results of pores between scans (Specimen 1) ... - 55 -
Figure 3-20 Distributions of Feret diameter of pores in Specimens 1 and 2 ... - 56 -
Figure 3-21 3D renderings of pores having a Feret diameter (a) less than 60 µm, (b) 60-100 µm, (c) 100-1200 µm and (d) more than 1200 µm (Specimen 2) ... - 57 -
Figure 3-22 3D rendering of pores having sphericity factor: (a) F>0.4 and (b) F<0.4 (Specimen 2)- 58 - Figure 3-23 Distributions of pores (F>0.4 and F<0.4) as functions of Feret diameter as compared to the fitting curve in (Charkaluk et al., 2014). ... - 59 -
Figure 3-24 Al matrix and eutectic Si (A319, after etching) in (a) BSE and (b) OM images ... - 60 -
Figure 3-25 3D renderings of Si phase in (a) a volume of 500 × 500 × 500 µm3 and (b) a subvolume .. - 61 - Figure 3-26 Illustration of the problem of threshold range selection for Si ... - 61 -
Figure 3-27 Iron intermetallics in OM image (A319, after etching). ... - 62 -
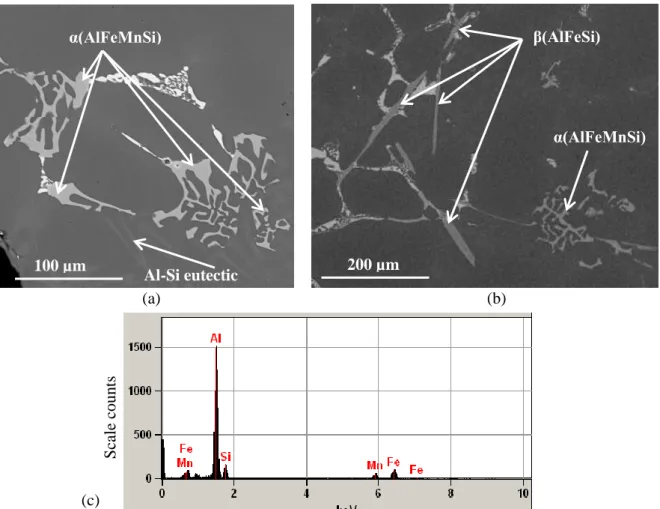
Figure 3-28 BSE image: (a) α phase with "Chinese script" morphology; (b) α phase and needle-like β phase (A319). (c) An example of EDS analysis on α phase. ... - 63 -
Figure 3-29 3D renderings of intermetallics having a Feret diameter (a) less than 20 µm, (b) 20-60 μm, (c) 60-1500 μm, (d) more than 1500 μm ... - 64 -
Figure 3-30 (a) A slice from the Lab-CT image with (b) 3D rendering of intermetallics ... - 65 -
Figure 3-31 (a) A „Chinese script‟ morphology with (b) 3D rendering ... - 65 -
Figure 3-32 Distributions of intermetallics as functions of equivalent and Feret diameters ... - 66 -
Figure 3-33 Granulometry distribution of intermetallics ... - 66 -
Figure 3-34 Copper containing phases (Al2Cu and AlCuMgSi) in OM image (A319, after etching). .... - 67 - Figure 3-35 (a) BSE image: copper containing phases, Al2Cu and AlCuMgSi (A319), and a small connected microstructure of Al2Cu and AlCuMgSi phases marked with a circle. Examples of EDS analysis on (b) AlCuMgSi and (c) Al2Cu. ... - 68 -
Figure 3-36 BSE images: (a) some small connected microstructure of Al2Cu and AlCuMgSi phases, and (b) a zoom on one example of this connected microstructure. ... - 68 -
Figure 3-37 BSE images: copper containing phases connected with (a) Al-Si eutectic and β intermetallics and (b) with α intermetallics ... - 69 -
Figure 3-38 3D renderings of Al2Cu having a Feret diameter (a) less than 20 µm, (b) 20-90µm, (c) 90-750µm,(d) more than 750 µm ... - 70 -
Figure 3-39 (a) A slice from the Lab-CT image and (b) a 3D rendering of Al2Cu ... - 71 -
Figure 3-40 Distributions of Al2Cu as functions of equivalent and Feret diameters ... - 72 -
Figure 3-41 Granulometry distribution of Al2Cu phase ... - 72 -
Figure 3-42 BSE images: Pb particles in A319 alloy ... - 73 -
Figure 3-43 3D renderings of Pb having a Feret diameter (a) less than 30 µm, (b) more than 30 µm, and (c) close-up view of objects in figure (b) ... - 74 -
VII
Figure 3-46 Example of one lab-CT slice (Specimen 3, A356 alloy, voxel of 3.4 µm after binning)
that presents intermetallics, porosity and Al matrix ... - 76 -
Figure 3-47 3D view of (a) pores and iron intermetallics at (b) a 3.4µm voxel size (Specimen 3) and at (c) a 0.9µm voxel size (courtesy of RX-Solutions); intermetallics are in yellow and pores in black- 77 - Figure 3-48 Distributions of Feret diameter of pores in A356 and A319 ... - 78 -
Figure 3-49 Granulometry distributions of intermetallics in A319 and A356 ... - 79 -
Figure 3-50 Distributions of pores, intermetallics, Al2Cu, Pb as a function of size (Feret diameter for pores and Pb, granulometry for intermetallics and Al2Cu) ... - 81 -
Figure 4-1 Extraction of specimens from prototype cylinder heads: (a) small and (b) large size specimens from the fire deck areas and (c) from small pieces. ... - 86 -
Figure 4-2 Size of extracted specimens (in mm) for (a) tensile tests and fatigue tests with 3D in-situ observations, (b) fatigue tests with 2D in-situ observations (X=10 for Specimen F1, and X=8 for Specimen F2). ... - 88 -
Figure 4-3 Examples of OM images on the surface of grinded specimens: (a) unselected and (b) selected. (c): One example of a large casting defect in the shoulder area on the 3D rendered surface (left) and in volume with the material set transparent (right) ... - 90 -
Figure 4-4 Lab-CT at Laboratoire de Mécanique de Lille (LML) ... - 91 -
Figure 4-5 Size distributions of pores in Specimen T3 and in a larger sample (Specimen 2) ... - 92 -
Figure 4-6 Comparison of granulometry distributions of iron intermetallics and Al2Cu phases in Specimen T3 and in larger Specimen 1 ... - 93 -
Figure 4-7 2D in-situ observation equipment ... - 94 -
Figure 4-8 Example of images taken at one step using Questar and stitching of images ... - 94 -
Figure 4-9 Tensile tests with (a) 2D and (b) 3D in-situ observations ... - 95 -
Figure 4-10 Tensile tests process ... - 96 -
Figure 4-11 Fatigue tests with (a) 2D and (b) 3D in-situ observations ... - 97 -
Figure 4-12 Images taken during fatigue tests ... - 97 -
Figure 4-13 Schematic diagram illustrating X-ray mapping area for large size specimens... - 98 -
Figure 4-14 Example showing decohesion and fracture of eutectic Si in X-ray mapping images of two fracture surfaces of the same specimen ... - 98 -
Figure 4-15 Schematic illustration of the two images recorded before and after deformation: a “reference” and a target (or deformed) images. ... - 100 -
Figure 4-16 The basic registration components (Klein and Staring, 2012) ... - 101 -
Figure 4-17 Examples of a strain field calculated: (a) without and (b) with bending energy penalty term („Metric0 Weight = 1.0‟ and „Metric1 Weight = 100‟). ... - 103 -
Figure 4-18 Measurements uncertainties ... - 106 -
Figure 4-19 Four types of tests in this thesis ... - 108 -
VIII
Figure 5-1 (a) Postmortem OM image (bottom) of Specimen T1 compared with radiography (top) and OM (middle) images taken before the tensile test, with (b) a larger magnification in the ROI marked by a rectangle. ... - 111 - Figure 5-2 Postmortem OM image of Specimen T2 (top) compared with radiography (middle) and OM (bottom) images taken before the tensile test ... - 112 - Figure 5-3 Fracture analysis of Specimens (a) T1 and (b) T2 ... - 112 - Figure 5-4 Stitched Questar images at the last step before failure: (a) 7th step of Specimen 1 at 71MPa (large cracks are marked by arrows); (b) 16th step of Specimen 2 at 237MPa ... - 113 - Figure 5-5 SEM postmortem analysis in Specimens (a) T1 and (b) T2: microcracks and final fracture at hard inclusions (Si particles, iron intermetallics). ... - 114 - Figure 5-6 Stress-strain curves deduced from DIC measurements for Specimens T1 and T2 and from a standard test performed on A356 alloy. ... - 115 - Figure 5-7 Displacement fields (U1, in pixels, 1 pixel = 0.34 µm) of Specimen T1 in the loading direction at: (a) 3rd step, (b) 4th step, (c) 5th step, (d) 6th step, (e) 7th step with (f) a close-up view of the region marked with a rectangle in (e). Images obtained with post-mortem SEM are shown in transparency. The stress and mean strain calculated by DIC are specified for each step. ... - 116 - Figure 5-8 (a) Longitudinal strain field (ε11) of Specimen T1 for the 7
th
step and (b) a close-up view of the region marked with a rectangle in (a). Images obtained with post-mortem SEM are shown in transparency. ... - 117 - Figure 5-9 Displacement fields (U1, in pixels) of Specimen T2 in the loading direction: (a) 15th step, (b) 16th step. Images obtained with post-mortem SEM are shown in transparency. The stress and mean strain calculated by DIC are specified for each step. ... - 118 - Figure 5-10 Longitudinal strain field (ε11) of Specimen T2: (a) 15
th
step, (b) 16th step; Equivalent von Mises strain field at (c) 15th step, (d)16th step; (e) A close-up view of the area marked in (b) and (d) compared with the microcracks (circled in red on the SEM image). Post-mortem SEM images (c) are shown in transparency in (c) and (d). ... - 119 - Figure 5-11 Comparison of stress-strain curves from DVC and from a standard test on A319 alloy ... - 120 -
Figure 5-12 Displacement fields (in pixels, 1 pixel = 1.695 µm) and strain fields of Specimen T3- 121 -
Figure 5-13 Comparison of 3D residual error in yellow and segmented cracks in red color in Specimen T3. Pores are rendered in green. ... - 122 - Figure 5-14 3D renderings of Specimen T3 at the 6th step (198MPa): (a) residual error, (b) displacement field (in pixels, 1 pixel = 1.695 µm) along loading direction (z-axis) and (c) εzz strain
field with pores shown in black and cracks in purple color; (d) Comparison between the cracks, in purple color, and pores, in green, with (e) the microstructure observed in one slice of tomography image. ... - 123 - Figure 5-15 A partial view of (a) residual error field at 198MPa in one slice near the specimen‟s flat surface 1 and (b) of tomography image in the corresponding slice; (c) SEM image of surface 1 near the slice shown in (a) and (b) with (d) a higher resolution image on the area where a crack is marked with a red circle in (a)(b)(c) ... - 124 - Figure 5-16 A partial view of (a) residual error field at 198MPa in one slice near surface 2 and (b) of tomography image in the corresponding slice; (c) the SEM image of surface 2, near the slice shown in (a) and (b), with (d) a higher resolution image on the area where a crack is marked with a red circle in (a)(b)(c) ... - 125 - Figure 5-17 SEM image of Specimen T3 showing cracks at Al2Cu and AlCuMgSi phases ... - 126 -
IX
Figure 5-19 (a) Strain field (εzz) from FEM with (b) a focus on the sub volume in the area marked with a red rectangle in (a) that corresponds to the area where the DVC measurements were performed (pores shown in golden, cracks in red) and corresponding strain field from DVC at 198MPa (pores
shown in black and cracks in purple) ... - 132 -
Figure 5-20 Maximum applied stress for Specimen F1 and F2 during 2D in-situ fatigue tests .... - 133 -
Figure 5-21 Stitched Questar image of Specimen F1 before the fatigue test. The crack initiation site after 7 000 cycles is marked by an arrow. ... - 134 -
Figure 5-22 Fracture surface of Specimen F1. The SEM image in Zone B is shown in Figure 5-23. ... - 135 - Figure 5-23 SEM image of the fracture surface of Specimen F1 in Zone B in Figure 5-22 ... - 135 -
Figure 5-24 Zone C in Figure 5-23 observed using SEM with a higher resolution. ... - 136 -
Figure 5-25(a) Stitched Questar image of Specimen F2 after 20 300 cycles with the 2D projection of 3D pores from Figure III-5 in purple; the final fracture is marked with a blue line. (b) The fracture surface observed by SEM in the corresponding area shown in (a). ... - 137 -
Figure 5-26 Stitched Questar images of Specimen F2 during the tensile stage at the 1st cycle at about (a) 80 MPa and (b) 98 MPa ... - 138 -
Figure 5-27 SEM image of Zone A marked in Figure 5-25(b) ... - 138 -
Figure 5-28 Stitched Questar images of Specimen F2: (a) after 15 500 cycles, (b) after 16 000 cycles . - 139 - Figure 5-29 Fracture analysis performed on Zone B marked in Figure 5-25(b) ... - 140 -
Figure 5-30 OM image in ROI of Specimen F2: the observed crack is marked with lines and arrows indicate locations of crack arrest ... - 141 -
Figure 5-31 Cracks length evolution with number of cycles in Specimens F1 and F2 ... - 141 -
Figure 5-32 Questar images in Zone 0 of Specimen F1: (a) after 7 000 cycles; (b) after 13 000 cycles; (c) after 90 000 cycles; (d) after failure at about 100 000 cycles. ... - 142 -
Figure 5-33 BSE image in Zone 0 of specimen F1 ... - 143 -
Figure 5-34 Schematic drawing of the area where crack tip is arrested by barrier ... - 144 -
Figure 5-35 Examples of crack tip having the shape of „Y‟ ... - 145 -
Figure 5-36(a) Plastic zone shapes through specimen thickness obtained by using the theoretical calculations (Botsis and Humbert, 2006); (b) plastic zone in an aluminum sheet (Hutchinson, 1968) ... - 145 - Figure 5-37 BSE images of the surface of Specimen F1 where in-situ observations were done. The selected ROI for in-situ observation is marked with a red rectangle (in left). The area where many microcracks are observed is marked with a yellow rectangle (in right)... - 147 -
Figure 5-38 BSE images of the surface of Specimen F2 where in-situ observations were done. The selected ROI for in-situ observation is marked with a red rectangle (in left). The area where many microcracks were observed is marked with a yellow rectangle (in right). ... - 147 -
Figure 5-39 Evolution of average longitudinal strain in Specimens F1 and F2, as measured by extensometer and DIC at the maximum load, with the number of cycles ... - 149 -
X
Figure 5-41 Field measurement in zone 0 of Specimen F1: (a) displacement (in pixels, 1 pixel = 0.38 µm) and (b) strain field after 13 000 cycles; (c) displacement and (d) strain field after 85 000 cycles .. - 150 -
Figure 5-42 Field measurement in the ROI of Specimen F1: (a) displacement (V, in pixels, 1 pixel = 0.38 µm) and (b) strain (ε22) field after 90 000 cycles (last step before final failure)... - 151 -
Figure 5-43 Field measurement in the ROI of Specimen F2: (a) displacement (V, in pixels, 1 pixel = 0.38 µm) and (b) strain field (ε22) after 18 410 cycles ... - 152 -
Figure 5-44 Evolution of average maximum longitudinal strain in Specimens F3 and F4, as measured by DVC, with the number of cycles ... - 153 - Figure 5-45 (a) 3D rendering of pores and fracture surface of Specimen F3. (b) Displacement field (in pixels, 1 pixel = 1.625 µm) and (c) strain field at 10th cycle shown in translucent with the tomographic image in below. DVC was performed between the minimum loading of the 1st cycle and the maximum loading of the 10th cycle. ... - 154 - Figure 5-46 Two examples showing cracks in Specimen F3 in the same slice at the maximum loading of 1st cycle and 10th cycle, and the final fracture after 10 cycles. ... - 154 - Figure 5-47 (a) 3D cracks and 3D rendering of pores in black; (b) figure (a) shown with fracture surface. ... - 156 - Figure 5-48 Comparison of 3D rendering of pores and fracture surface and tomographic image slice revealed the two main cracks initiated around a large pore (in the left image) and at hard inclusions (in the right image) in Specimen F4 ... - 157 - Figure 5-49 3D cracks in Specimen F4 around the 3D rendered pores at different cycles. View along the loading direction. ... - 158 - Figure 5-50(a) Cracks length evolution with the number of cycles in Specimen F4 with (b) the projection plane used for the cracks measurements ... - 159 - Figure 5-51 One slice (about 65 µm below the flat surface) shown with a 3D rendering of pores and fracture surface of Specimen F4 ... - 159 - Figure 5-52 DVC displacement fields (in pixels, 1 pixel = 1.625 µm) of one slice (about 65 µm below the flat surface) of Specimen F4 at different cycles. ... - 160 - Figure 5-53 DVC strain fields of the same slice (about 65 µm below the flat surface) of Specimen F4 in Figure 5-52 at different cycles. ... - 160 - Figure 5-54 Examples showing residual plastic zones with a shape of „Y‟ near cracks tips: (a) about 80 µm and (b) about 200 µm below flat surface of Specimen F4. DVC was performed between the minimum loads of the 1st cycle and of the 10 500th cycle ... - 162 - Figure 5-55 Residual plastic strain localizations in the same slice at different cycles (Specimen F4) .... - 163 -
Figure 5-56 Cracks opening displacement map of Specimens F3. ... - 164 - Figure 5-57 Cracks opening displacement map of Crack 1 and Crack 2 in Specimen F4. The location of each crack was shown by a circle in the last cycle. ... - 164 - Figure 5-58 Comparison of same slice (390 µm below the flat surface) between FEM simulation results and the tomographic image at 10 500 cycle (Specimen F4) ... - 167 - Figure 5-59 Equivalent Von Mises strain field from DVC: correlation between the minimum loading of 1st cycle and the maximum loading of (a) 2nd cycle and (b) 20th cycle. (c) PEEQ field (after 3 cycles) from FE simulation. (Slice shown is about 680 µm below the flat surface of Specimen F4) ... - 171 -
XI
Figure I-4 Pre-treatment methods for SR-CT images: (a) original image; (b) a strong filter is performed on image (a); (c) the roughly segmented image from image (b); (d) a closing operation is performed on image (c); (e) an opening operation is performed on image (d) and the segmentation of porosity is finished; (f) invert color of image (e) to obtain a mask; (g) the original image (a) covered by the mask (f) in order to segment Si; (h) erosion/dilation operation performed on the mask (f) to enlarge the pores and cover the bright contrast around the pores; (i) the original image (a) covered by
the mask (h) in order to segment iron intermetallics and Al2Cu phases... - 188 -
Figure I-5 Distributions of intermetallics as functions of equivalent and Feret diameters ... - 189 -
Figure I-6 Comparison of 3D renderings between standard threshold (104-177) (in the left, purple) and upper bound threshold (102-182) (in the right, green) ... - 190 -
Figure I-7 Comparison of 3D renderings between standard threshold (104 -177) (in the left, purple) and lower bound threshold (106-174) (in the right, yellow) ... - 190 -
Figure I-8 Illustration of the problem of threshold range selection: the original image (a), the threshold range selected (99-150) are shown by red colour ... - 191 -
Figure I-9 Eroding of an object. ... - 192 -
Figure I-10 Dilation of an object... - 192 -
Figure I-11 Example of opening operation. ... - 193 -
Figure I-12 Example of closing operation. ... - 193 -
Figure I-13 Examples of Dendrite Arm Spacing (DAS) measurements performed in 3D rendering of pores ... - 194 -
Figure II-1 Schematic of FE mesh process ... - 196 -
Figure III-1 Specimen T1: (a) radiography and (b) OM image with the ROI marked by a rectangle. .... - 198 - Figure III-2 Specimen T2: (a) radiography and (b) OM image with the ROI marked by a rectangle. .... - 199 - Figure III-3 (a) 3D rendering of pores in Specimen T3; the selected ROI is marked by a red rectangle. (b) A close up-view of the largest pore in (a) marked by an arrow. ... - 200 -
Figure III-4 Specimen F1: 3D rendering of (a) pores in bulk (b) and surface pore in the notched surface marked with a yellow arrow; the specimen surface was set transparent in the left image and opaque in the right image. (c) OM image of the specimen surface after etching: the pore marked with the yellow arrow was projected on the surface and is shown in purple; the selected ROI for the in-situ observation with Questar microscope is marked with a red rectangle; where crack initiated after 7000 cycles on the surface is marked with a green arrow... - 201 -
Figure III-5 3D rendering of a cluster of pores near the flat observed surface: in (a) view intercepted perpendicular to the flat surface, (b) view intercepted parallel to the flat surface. (c) OM image taken after etching with the projection of pores shown in (b). (d) OM image taken after etching, the selected ROI was marked with a blue rectangle. ... - 203 -
Figure III-6 Specimen F3: (a) distribution of pores and (b) FEM simulation results (E33: longitudinal strain); the selected ROI is marked by a red rectangle. ... - 205 -
Figure III-7 Thickness distribution of hard inclusions in Specimen F3 ... - 205 -
Figure III-8 Specimen F4: (a) distribution of pores and (b) FE simulation results (E33: longitudinal strain) with selected ROI marked by a red rectangle. ... - 206 -
XII
Figure IV-1 The basic registration components of image correlation platform at LML ... - 207 -
Figure V-1 Crack length measurement method. ... - 212 -
Figure VI-1 X-ray mapping of Si (Specimen F1) ... - 214 -
Figure VI-2 X-ray mapping of Fe (Specimen F1) ... - 214 -
Figure VI-3 X-ray mapping of Mn (Specimen F1) ... - 214 -
Figure VI-4 X-ray mapping of Cu (Specimen F1) ... - 215 -
Figure VI-5 X-ray mapping of Si (Specimen F2) ... - 215 -
Figure VI-6 X-ray mapping of Fe (Specimen F2) ... - 215 -
Figure VI-7 X-ray mapping of Mn (Specimen F2) ... - 216 -
Figure VI-8 X-ray mapping of Cu (Specimen F2) ... - 216 -
Figure VI-9 X-ray mapping of Si (Specimen F3) ... - 216 -
Figure VI-10 X-ray mapping of Fe (Specimen F3) ... - 217 -
Figure VI-11 X-ray mapping of Mn (Specimen F3) ... - 217 -
Figure VI-12 X-ray mapping of Cu (Specimen F3) ... - 217 -
Figure VI-13 X-ray mapping of Si (Specimen F4) ... - 218 -
Figure VI-14 X-ray mapping of Fe (Specimen F4) ... - 218 -
Figure VI-15 X-ray mapping of Mn (Specimen F4) ... - 218 -
XIII
List of Tables
Table 2-1 Reactions occurring during solidification of two A319 alloys (Martínez D. et al., 2005)
according to (Bäckerud et al., 1990) and (Samuel et al., 1996) ... - 9 -
Table 2-2 Main microstructure constituents and casting defects in Al-Si alloy ... - 34 -
Table 2-3 Micromechanisms of fatigue damage in Al-Si casting alloys ... - 35 -
Table 3-1 Chemical composition of Lost Foam Casting A356 and A319 alloys (wt.%)... - 37 -
Table 3-2 Phases or constituents studied in 3D in A356 and A319 alloys ... - 37 -
Table 3-3 Specimens studied in this chapter ... - 43 -
Table 3-4 Parameter settings of laboratory X-ray microtomography ... - 44 -
Table 3-5 Size and volume of analysed volume for each specimen ... - 46 -
Table 3-6 2D and 3D results of pores in A319 alloy ... - 53 -
Table 3-7 3D and 2D results of pores in A319 alloy ... - 56 -
Table 3-8 DAS values measured on 3D images (Specimen 2) ... - 59 -
Table 3-9 Results of segmentation tests for Si phase ... - 62 -
Table 3-10 Comparisons between 3D and 2D results of iron intermetallics ... - 64 -
Table 3-11 Comparison of 3D and 2D results of Al2Cu ... - 69 -
Table 3-12 3D results of Pb (Specimen 1) ... - 73 -
Table 3-13 3D vs. 2D results of pores and intermetallics in A356 ... - 77 -
Table 3-14 Comparison of the different characterization methods used ... - 79 -
Table 3-15 Mechanical properties of Al and Pb ... - 81 -
Table 3-16 Summary of 2D and 3D characterization ... - 84 -
Table 4-1 Extraction, preparation, selection and in-situ observations of specimens ... - 87 -
Table 4-2 Parameter settings for 3D in-situ observations ... - 95 -
Table 4-3 Natural tracers for DIC and DVC ... - 107 -
Table 4-4 Selected element size for each measurement ... - 107 -
Table 5-1 Results of 2D tensile tests ... - 111 -
Table 5-2 Results of 2D fatigue tests ... - 133 -
Table 5-3 Results of 3D fatigue tests ... - 153 -
Table 5-4 Parameters of large pores in Figure 5-47 ... - 156 -
Table 5-5 Basic information on fatigue tests ... - 165 -
Table 5-6 Ratios of elements mass fraction on fracture surface and on flat surface ... - 172 -
XIV
Table I-2 Threshold ranges of the different phases in all the specimens ... - 186 - Table I-3 Results of the segmentation tests on intermetallics ... - 189 - Table III-1 Size and location of Pore A, B and C shown in Figure III-5 (b) ... - 204 -
- 1 -
Chapter 1 Introduction
Contents
1.1 Background ... 1 -1.2 Aim and objectives ... 3 -1.3 Thesis structure ... 3
-1.1 Background
The development of automotive industry must meet economic and ecological objectives and at the same time ensure performance, driving quality and safety. Reduction of cars weight not only saves fuel but also reduces emission of CO2.A reduction of 100 kg in the mass of a car induces a reduction
of about 9 grams of CO2 per kilometer (Hirsch, 2011). In order to achieve these goals, it is necessary
to choose a suitable material for automobile manufacturing.
Aluminum alloys have high strength to weight ratio, good machinability, corrosion resistance, optimum surface finish and high electrical and thermal conductivity (Tabibian et al., 2013) (Gruzleski and Closset, 1990); they can also save the weight of parts up to 50% (Hirsch, 2011). Therefore, they are widely used in automotive industry, such as for chassis, structure, components, seam welded tubes, car body, engine blocks, heat exchanger.
Al-Si alloy is one of the most commonly used Al alloys in automotive industry mainly in engine parts. Cylinder head is one of the key components of the engine, it composes engine with cylinder block, pistons, crankcase, crankshaft and connecting rod. Its main role is to seal the cylinders and to form the combustion chamber with pistons and cylinder block. The compressed combustibles gas burning and swelling in combustion chamber, push the piston and the crankshaft connecting rod mechanism to provide power. Thus cylinder heads (Figure 1-1) are submitted to severe thermomechanical stresses (temperature gradient, high cyclic loadings, and thermal shock) with temperature variation from 20 to 250°C. In particular, the inter-valve zone in fire deck is the most critical area. In order to adapt to these working conditions, there is a high requirement for the material mechanical properties of cylinder head, for example, in fatigue and more particularly in Low Cycle Fatigue (LCF).
Chapter 1 Introduction
- 2 -
Figure 1-1 Cylinder head and temperature field in the fire deck (PSA data)
The conventional casting process to manufacture cylinder head is gravity Die Casting (DC) process, but it is progressively being replaced by the Lost Foam Casting (LFC) process for the purpose of geometry optimization, cost reduction and consumption control. However, aluminum alloy automotive parts produced by the LFC process have a coarser microstructure and more porosity defects than parts produced with conventional casting processes at faster cooling rates (Figure 1-2) and it is well known that microstructure has a major influence on the fatigue properties. In a previous thesis (Tabibian, 2011) performed in the laboratory, the fatigue life of LFC A319 alloy was drastically reduced compared to DC A319 alloy while the strain-stress hysteresis loop was virtually unchanged (see Figure 1-3).
Figure 1-2 LFC and DC casting process (Tabibian, 2011)
(a) (b)
Figure 1-3 Comparisons between A319-LFC and A319-DC: (a) normalized axial stress cyclic versus number of cycles (Tabibian et al., 2010); (b) stabilized hysteresis loop (Tabibian, 2011).
- 3 -
Moreover, in past years, some studies have been performed in order to reveal the damage mechanisms of Al-Si alloys. Above a critical size (Wang et al., 2001) (Zhang et al., 2007) (Mu et al., 2014), pores play a decisive role by providing preferential crack initiation sites (Ammar et al., 2008). An influence of Si phase (Buffière et al., 2001) (Stolarz et al., 2001), iron intermetallics and copper containing phases (Firouzdor et al., 2007) (Tabibian et al., 2013) is also observed. However, most of these studies were performed in High Cycle Fatigue (HCF) regime. Only a few studies focused on the damage mechanisms in Al-Si alloy with large casting defects in Low Cycle Fatigue (LCF) regime. Moreover, even if post-failure analysis makes it possible to track the defect at the initiation site, it does not allow for studying the relationship between microstructure and crack growth kinetic at the surface and in volume. In LCF, this analysis is made even more difficult as failure often results from multicracking (Stolarz et al., 2001) rather than from a single crack. Thus the damage mechanisms in LFC Al-Si alloys in LCF are still unclear and should be further studied.
1.2 Aim and objectives
The aim of this thesis is to develop an experimental method to study the damage micromechanisms of LFC Al-Si alloy in LCF at room temperature. This method allows following cracks initiation and their propagations both on surface and in volume and thus allows identifying the relation between damage mechanisms and casting microstructure. In order to achieve this goal, several experimental techniques have been coupled. 2D (Questar long distance microscope) and 3D (X-Ray tomography) in situ tracking of the damage at microstructural scale in real time were used both in monotonic tension and fatigue. 2D/3D displacement and strain fields, which are measured using Digital Image Correlation (DIC) and Digital Volume Correlation (DVC), allow analyzing the relation between the measured fields and damage behavior. In addition, a preliminary characterization of specimens before tests is necessary for the selection of the most suitable and representative specimen and of the ROI for the following analysis. Postmortem analysis using Optical Microscopy (OM), Scanning Electron Microscopy (SEM), and Energy Dispersive Spectrometer (EDS) and FEM simulation give more information to understand the damage mechanisms.
The studied material is from an A319 LFC cylinder head (composition presented in chapter 3). However, due to a lack of A319 material in the early stage of this thesis, specimens extracted from an A356 LFC cylinder head were used to validate the experimental protocol in tensile tests with 2D in-situ observations.
1.3 Thesis structure
Chapter 1 Introduction
- 4 -
The literature review in Chapter 2 is divided into two parts. Firstly, the microstructure of Al-Si alloy is introduced. α-Aluminum phase, Si phase, iron intermetallics, copper containing phases, addition elements for grain refining and for improving mechanical properties, casting defects including pores and oxides films are presented. At the end of the first part, LFC process that has an important influence on microstructure of casting alloys is detailed. Secondly, the influence of the microstructure on fatigue damage is presented in three aspects: influence of casting defects including pores and oxide films; influence of hard inclusions including eutectic Si, iron intermetallics, copper containing phases and magnesium containing phases; influence of microstructural features such as SDAS, slip bands and grain boundaries.
The microstructure of the studied materials is characterized both in 2D and 3D in Chapter 3. The used characterization methods, i.e. OM, SEM-EDS, X-ray Laboratory Computerized Tomography (Lab-CT) and Synchrotron Radiation Computerized Tomography (SR-(Lab-CT), are introduced at first. Then, A319 alloy is fully characterized whereas A356 alloy is not characterized in detail.
The experimental protocol is detailed in Chapter 4. The protocol has been first developed in tensile tests for validation before being applied in fatigue tests. The basic steps are similar: extraction, preparation and selection of specimens, tensile/fatigue tests with in-situ observations on surface using Questar microscope and in volume using Lab-CT/SR-CT, postmortem analyses using OM, SEM and EDS, field measurements using DIC in 2D and DVC in 3D.
Chapter 5 presents and discusses experimental results and reveals the damage mechanisms in tensile and cyclic loading. Results of tensile tests on A356 alloy with 2D in-situ observations and on A319 alloy with 3D situ observations are presented separately at first. Then tensile mechanisms and the application of experimental protocol are discussed. Afterwards results of fatigue tests on A319 alloy with 2D and 3D in-situ observations are presented and analyzed respectively. Damage mechanisms in LCF are then discussed by comparison of the above results. Finally, the experimental protocol is evaluated according to its application in this study, and some conclusions are drawn about damage mechanisms in tensile loading and in LCF.
- 5 -
Chapter 2 Literature review
Contents
2.1 Introduction ... - 6 - 2.2 Al-Si Casting Alloys ... - 6 -
2.2.1 Introduction ... - 6 - 2.2.2 Microstructure of Al-Si Casting Alloys ... - 7 - 2.2.2.1 α-Aluminum phase ... - 9 - 2.2.2.2 Silicon phase ... - 9 - 2.2.2.3 Iron intermetallic phases ... - 11 - Morphology of intermetallics phases ... - 12 - Influence of Fe intermetallics on porosity ... - 14 - 2.2.2.4 Copper containing phases ... - 15 - 2.2.2.5 Other phases ... - 16 - Grain refining ... - 16 - Improving mechanical properties ... - 17 - 2.2.2.6 Casting defects ... - 18 - 2.2.3 Lost foam casting ... - 19 -
2.3 Micromechanisms of fatigue damage in Al-Si casting alloys ... - 22 -
2.3.1 Influence of casting defects ... - 22 - 2.3.1.1 Pores ... - 23 - 2.3.1.2 Oxide films ... - 24 - 2.3.2 Influence of microstructural constituents/features ... - 25 - 2.3.2.1 Hard inclusions ... - 25 - Eutectic silicon particles ... - 25 - Iron intermetallics ... - 27 - Copper containing phases and magnesium containing phases ... - 28 - 2.3.2.2 Microstructural features ... - 29 - SDAS ... - 29 - Slip bands and grain boundaries ... - 31 -
Chapter 2 Literature review
- 6 -
2.1 Introduction
Aluminum silicon (Al-Si) casting alloy is a widely used aluminum alloy in the automotive industry. Many alloying elements, such as Cu, Ni, Mg, are added to form various constituents and improve its performances. During the casting process, defects inevitably occur. Therefore the complex microstructure of Al-Si alloys inherited from the casting process affects the fatigue behavior. Many studies were focused on this microstructure and on its influence on fatigue damage in the past years, and some of them are presented in this chapter, which is divided into two parts.
Al-Si alloys, including their microstructure and casting process, are presented in the first part (§ 2.2). After a brief introduction about Al-Si alloys in § 2.2.1, their microstructure, including α-Aluminum phase, silicon phase, iron intermetallics, copper containing phases, some other phases, e.g. phases containing Mg, Ti, Ni, V, P, and casting defects (porosity and oxides films), is detailed in § 2.2.2. The Lost Foam Casting (LFC) process, i.e. the casting method, its advantages /disadvantages and its influence on the microstructure, is presented at last (§ 2.2.3).
The micromechanisms of fatigue damage in Al-Si alloys are presented in the second part (§ 2.3). The influence of casting defects on fatigue behavior is detailed at first (§ 2.3.1). Then the influence of microstructural constituents/features, including hard inclusions (Si phase, iron intermetallics, Cu containing and Mg containing phases) and microstructure features (slip bands, grain boundaries and SDAS (Secondary Dendrite Arm Spacing)), are presented in § 2.3.2.
2.2 Al-Si Casting Alloys
2.2.1 Introduction
Aluminum alloys have many excellent features, such as light weight, high strength-to-weight ratio, corrosion resistance, relatively low cost (aluminum is the most widely distributed of the elements, except for oxygen, nitrogen, and silicon), high electrical and thermal conductivities, ease of manufacturing, and ready availability (Department of defense, U.S.A, 1966). Owing to these properties, they have been widely used in many industrial applications including in the transport industry, e.g. automobiles (Miller et al., 2000), trains (Skillingberg and Green, 2007), ships (Kyle et al., 2012), aviation (Liu et al., 2010), aerospace (Heinz et al., 2000), and in some other fields, such as building structures (Shi et al., 2005).
The growing demand for more fuel-efficient vehicles to reduce energy consumption and air pollution is a challenge for the automotive industry. The characteristic properties of aluminum make it the ideal candidate to replace heavier materials (steel or cast iron) to respond to the weight reduction demand
- 7 -
(Miller et al., 2000). Use of aluminum alloys can make the cars lightweight, environmentally friendly, and energy-saving. For example, they are widely used in the cylinder block and cylinder head of the engine, which are the key components and should withstand high temperatures and cyclic loadings. Therefore, the research and development of automotive aluminum alloys is a key feature.
Commercial cast Al-Si alloys are multiphase materials belonging to the aluminum association classification series 3xx.x for aluminum silicon plus magnesium and/or copper alloys, such as the commonly used alloys in the automotive industry: 319, 356, 357, 380 and 390 aluminum alloys (Albonetti, 2000).
2.2.2 Microstructure of Al-Si Casting Alloys
The two principal phases present in Al-Si alloys are primary aluminum based α-Al and silicon phases. The α-Al phase, which has the largest volume fraction, acts as a matrix for the alloys. The silicon content in standardized commercial cast Al-Si alloys varies from 5 to 23 wt. %. Depending on this content, the structure of the alloy can be hypoeutectic, eutectic, or hypereutectic, as can be seen on the equilibrium phase diagram (Figure 2-1) (Warmuzek, 2004).
Solidification is the stage when the microstructure is formed. During the solidification of an Al-Si alloy, primary aluminum forms and grows in dendrites if the alloy is hypoeutectic or, silicon phase forms and grows in angular primary particles if the alloy is hypereutectic. Once the eutectic point is reached, the eutectic Al-Si constituent nucleates and grows until the end of solidification.
A319 alloy is a hypoeutectic Al–Si alloy („a‟ in Figure 2-1(a)) with two main solidification stages (Figure 2-2): (1) formation of aluminum rich (α-Al) dendrites, (2) development of two-phase (Al)–Si eutectic. However, the presence of additional alloying elements such as Mg and Cu, as well as of impurities such as Fe, leads to more complex solidification reactions (Dobrzański et al., 2006), which are listed in Table 2-1 (Martínez D. et al., 2005) for two A319 alloys.
Chapter 2 Literature review
- 8 -
Figure 2-1 Commercial cast Al-Si alloys. (a) Al-Si equilibrium diagram and microstructure of (b) hypoeutectic (1.65-12.6 wt% Si), (c) eutectic (12.6% Si), and (d) hypereutectic (>12.6% Si) alloys.
(Warmuzek, 2004)
Figure 2-2 Solidification process of Al-Si Alloy (Albonetti, 2000) b c d
- 9 -
Table 2-1 Reactions occurring during solidification of two A319 alloys (Martínez D. et al., 2005) according to (Bäckerud et al., 1990) and (Samuel et al., 1996)
2.2.2.1 α-Aluminum phase
α-Aluminum phase usually has a dendritic structure, which depends on the solidification conditions (Figure 2-1) (Warmuzek, 2004) (Moffat, 2007). The crystallographic orientation of the aluminum within the eutectic was found to be the same as the surrounding dendrites in both unmodified and Sr-modified alloys (Boulos et al., 2012).
2.2.2.2 Silicon phase
Silicon in aluminum alloys improves the casting characteristics. Indeed addition of silicon dramatically enhances fluidity, hot tear resistance and feeding characteristics (Pavlovic-Krstic, 2010). At room temperature, hypoeutectic alloys consist of a hard and brittle eutectic silicon phase and a soft and ductile primary aluminum phase (Ye, 2003).
As shown in Figure 2-1, the silicon content can affect the microstructure of Al-Si alloys. The silicon precipitates, which are almost pure, faceted crystals of Si, can have different morphology: primary, compact or massive precipitates in hypereutectic alloy or branched plates in eutectic alloy (See Figure 2-3) (Warmuzek, 2004). Moffat et al. (Moffat et al., 2006) reported that reducing Si content results in formation of clusters of intermetallics and increases porosity.
Chapter 2 Literature review
- 10 -
Figure 2-3 Morphology of the Si crystals in Al-Si alloys observed with Scanning Electron Microscope: (a) in eutectic and (b) in hypereutectic as-cast alloys, and (c) in modified hypoeutectic alloy after heat
treatment. (Warmuzek, 2004)
The addition of strontium in Al-Si alloy causes Si phase to be more rounded and to present a coralline-like structure (Figure 2-4) (Gruzleski et al., 1990) (Barrirero et al., 2013) (Barrirero et al., 2014). If the content of Sr is below a critical value, the modification effect is insignificant (Ammar et al., 2008a). Then, at increasing content of Sr, the modification effect becomes more and more significant until another critical value is reached, above which the modification effect is stabilized (see Figure 2-5) (Kosa et al., 2012). However these critical values depend on the chemical composition of the alloy and on the cooling rate. A quicker cooling results in a finer eutectic at the same Sr content (Kosa et al., 2012). The content of Sr, above which the modification effect is significant, varies from 50 ppm, to 500 ppm in the literature (Gruzleski et al., 1990) (Kosa et al., 2012) (Ammar et al., 2008b).
- 11 -
Figure 2-4 Optical micrographs of : (a) unmodified AlSi7 alloy showing plate-like Si eutectic structure and (b) modified AlSi7 + 150ppm Sr with coralline-like Si structure. (Barrirero et al., 2013)
Figure 2-5 Effects of Sr on the parameters of the eutectic Si particles (Kosa et al., 2012)
2.2.2.3 Iron intermetallic phases
Due to the use of secondary (recycled) Al-Si alloys and of steel equipment used in the casting processes, Fe can be found as an impurity up to 0.6% in A319 alloy and up to 0.3% in A356 alloy. Therefore, Fe-containing phases are commonly found such as β(AlFeSi), Al9FeNi, π(Al8FeMg3Si6) and α(AlFeMnSi) phases (Moffat, 2007). The iron intermetallic phases observed in this study are α(AlFeMnSi) and β(AlFeSi).
Chapter 2 Literature review
- 12 - Morphology of intermetallics phases
α phase has a central polyhedral particle and an external highly convoluted three-dimensional structure (Dinnis et al., 2005). Thus it is often called "Chinese script" or script phase (Tabibian et al., 2010). β phase has a detrimental plate-like morphology (Tabibian et al., 2010), and is considered more harmful than α phase (Belmares-Perales et al., 2008). By using synchrotron tomography, the solidification process of two independently nucleated β plates in an AlSiFeCu alloy is shown in 3D in Figure 2-6 (Terzi et al., 2010). Herein, the cooling rate was controlled at 1.4 °C/min. These β plates may present a complex branching morphology in 3D. A three-stage mechanism for their formation, i.e. lateral growth, attachment and diffusion-limited growth, final step growth, was proposed in (Wang et al., 2009).
Figure 2-6 A series of reconstructed images from independently nucleated complex β plates, taken at several time steps during their growth by using synchrotron tomography (Terzi et al., 2010).
The cooling rate, casting temperature, iron content and alloying additives control the content and morphology of intermetallics.
The morphology and size of α phase depend on the cooling rate. α phase solidifies in a fine compact morphology if the cooling rate is high and forms a compact and star-like Chinese script morphology if the cooling rate is low (Ji et al., 2013). Besides, when the casting temperature is increased, the α content increases while the β content decreases (Albonetti, 2000).
579.9°C 578.6°C 576.0°C 573.3°C
- 13 -
Increasing the iron content increases the amount of β phase and results in the precipitation of coarse binary β platelets (see Figure 2-7) at a higher temperature by changing the precipitation sequence of the β phase (Lu and Dahle, 2005). The influence of alloying additives, such as strontium (Sr), manganese (Mg), silicon (Si) and copper (Cu), is also reported in the literature:
Addition of Sr restrains the formation of the coarse binary β platelets (Lu and Dahle, 2005) and refines the morphology of α phase (see Figure 2-8) (E. M. Elgallad, 2010).
Mn also refines the morphology of α phase and increases the ratio between α phase and β phase, but it also increases the total amount of iron intermetallics (Lu and Dahle, 2005). Besides excess Mn results in hard inclusions and difficulties in machining due to the formation of α phase although the ductility is improved (Taylor, 2004) (Rana et al., 2012). The commonly used Mn:Fe ratio in the so called „iron neutralization‟ process is at least 0.5; however, this treatment does not always work effectively (Taylor, 2004).
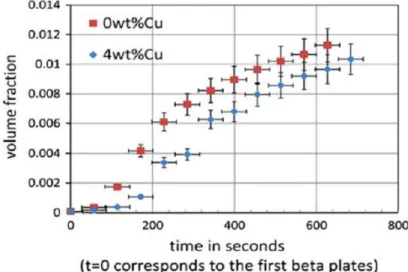
The coarse binary β platelets could be suppressed by Si and Cu (Figure 2-9) (Salvo et al., 2012) while the total amount of intermetallics is not increased (Lu and Dahle, 2005).
Figure 2-7 Microstructures of Al-Si alloys with (a) 0.3 wt% and (b) 0.7 wt% Fe, respectively (Lu and Dahle, 2005).
Chapter 2 Literature review
- 14 -
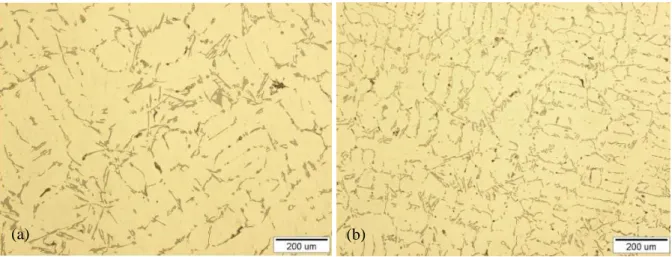
Figure 2-8 Micrographs obtained from : (a) an unmodified base Al alloy; and (b) a Sr-modified Al alloy in as cast condition (E. M. Elgallad, 2010)
Figure 2-9 Volume fraction of β platelets as a function of solidification time (Salvo et al., 2012).
Influence of Fe intermetallics on porosity
The Fe-rich intermetallics affect the formation of porosity because iron forms large flakes that provide good „nucleation sites‟ for pores due to its restriction of the flow of the cast (Chirita, 2011). A pore was indeed observed to grow preferentially along the solid surfaces of the β plates using synchrotron tomography, as shown in Figure 2-10 (Puncreobutr et al., 2014). Dinnis et al (Dinnis et al., 2006) reported that increasing the iron content increases porosity in all alloys except in the copper-containing Al–5% Si alloy, which displays a minimum porosity at a critical iron content. Besides, Taylor et al (Taylor, 2004) claimed that “ iron levels above the critical level for the silicon content of the alloy should be avoided as this can cause serious loss of ductility in the final cast product and decrease casting productivity through increased rejects due to shrinkage porosity ”. They also proposed a formula to calculate the critical iron content (in wt.%) for a given alloy: Fecrit≈0.08×
[ %Si]-0.05.
- 15 -
Figure 2-10 3-D rendering of pore evolution (blue) in the presence of intermetallics (red) in an A319 alloy at: (a) 565°C, (b) 561°C, (c) 555°C and (d) 550°C. Examples of pore growth along the solid
surface of intermetallics are shown in dashed black and white circles (Puncreobutr et al., 2014).
2.2.2.4 Copper containing phases
The addition of Cu to Al-Si alloys could improve their mechanical properties due to precipitation hardening. The hardness of an Al-Si alloy increases from HB 55 to HB 118 with an increase of Cu content from 3% to 5% (Zeren et al., 2011). Several Cu containing phases have been observed in Al-Si alloys, such as AlCuMgAl-Si, AlCuAl-SiCe (Wu et al., 2009), AlMnFeCuAl-Si (Tanem et al., 2005), and Al2Cu (Tabibian, 2011). The Cu containing phases in this study are Al2Cu and AlCuMgSi, and their
morphologies in a new AlCuSiFe alloy are shown in Figure 2-11 for Scanning Electron Microscope (SEM) images and in Figure 2-8 for Optical Microscope (OM) image (E. M. Elgallad, 2010). The crystallization of all copper based intermetallics in aluminum alloys occurs at the end of solidification in the remaining inter dendritic liquid (Martínez D. et al., 2005).
Al2Cu phase forms in a limited space, confined within α(Al) solid solution, plates of eutectic Si phase
and plates of intermetallic phase: it is coarser in Ce-containing alloys (See Figure 2-12). They solidify in two forms: the block-like Al2Cu and the finer eutectic-like Al+Al2Cu (Sjölander and Seifeddine,
2010) (Dobrzański et al., 2007). Besides, the addition of Ce to Al−Si−Cu alloy increases the formation temperature of Al2Cu, while the solidification sequence is apparently unaffected (Voncina
et al., 2014). In addition, the Al2Cu phase is segregated away from the Al-Si eutectic regions by the
addition of Sr and its dissolution during solution heat treatment is retarded. Addition of Fe can accelerate the copper phase dissolution as the β phase platelets “act as preferred precipitation sites for the copper phase and hence lessen the degree of segregation” (Li et al., 2003).
The quaternary eutectic AlCuMgSi phase with low melting point of 507 °C forms “when Cu content is more than 2% and its amount increases with increasing Cu content” (Zeren et al., 2011).
Chapter 2 Literature review
- 16 -
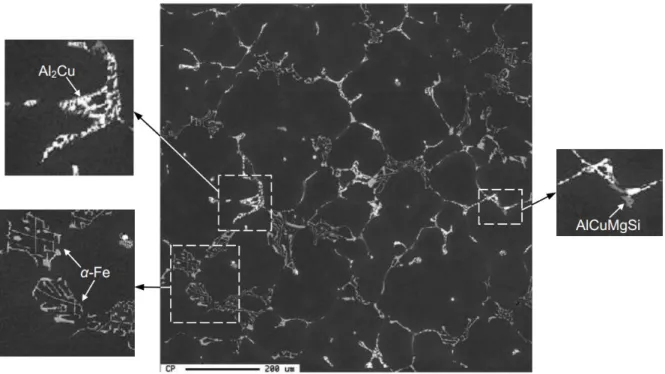
Figure 2-11 Backscattered electron image of an as-cast AlCuSiFe based alloy (E. M. Elgallad, 2010)
Figure 2-12 Focussed Ion Beam cross-section of an Al−Si−Cu alloy (a) without Ce and (b) with 0.02% Ce (Voncina et al., 2014)
2.2.2.5 Other phases
Other elements may be added in Al-Si alloys for the purpose of: (1) grain refining; (2) improving mechanical properties by precipitation of a new phase.
Grain refining
Some elements are usually added for the purpose of grain refinement, which is used to obtain grain boundary strengthening. The most classical refinement, which was used in this thesis at a Ti content of about 0.12%, is performed by adding titanium (Ti) and boron (B) from an Al-Ti-B master alloy.
- 17 -
The formation of nano-sized particles of TiB2 particles (Emamy et al., 2006) (El-Labban, 2013)
provides heterogeneous sites for nucleation during solidification and thus it promotes the nucleation of fine grains from α-Al matrix.
The addition of vanadium (V) enhances grain refining at content above 1% due to the presence of VAl particles (Edwards, 2002). Phosphorus (P) may also be added and forms AlP phase which “acts as a nucleation site for primary „blocky‟ Si particles inhibiting the formation of large Si plates and thus has an indirect effect on the material properties, by altering the principal microstructural features” (Chirita, 2011).
Improving mechanical properties
Mg is often added to Al-Si alloys to improve their mechanical properties. The Mg2Si phase often
present in some commercial alloys, such as A356, has a small black script morphology in SEM observations and develops in the final stages of solidification (Tabibian et al., 2010). The complex shape of Mg2Si phase was better revealed using synchrotron tomography (Tolnai et al., 2009); 3D
reconstruction (Figure 2-13(a)) demonstrates the coral like connectivity of these particles. Besides, the small particles of eutectic Si around the Mg2Si phase are also revealed (Figure 2-13 (b)).
Figure 2-13 (a) Segmented Mg2Si coral and (b) segmentation of the phase contrast images of Mg2Si
(blue) and the small particles of eutectic Si (including some small Mg2Si particles) (yellow) from
tomography images (Tolnai et al., 2009).
The addition of Ni to Al-Si alloys could increase their high temperature strength. AlNi phase is the binary phase from the Al-Ni system and forms in the case of a high content of Ni. For lower Ni contents ternary phases may form, such as AlCuNi and AlFeNi phases (Edwards, 2002). By using
Chapter 2 Literature review
- 18 -
tomography, AlSiNi phase is found to present “networks of connected Si lamellae as well as complex 3D shapes of Ni-containing aluminides” in as-cast condition (Asghar et al., 2009).
2.2.2.6 Casting defects
Because liquid aluminum is prone to hydrogen adsorption and oxidation, pores are the most common casting defects in Al-Si alloy (Wang, 2013) and they often bring serious harm to the mechanical properties. Their formation may be due to “entrapped air during mold filling, centerline shrinkage that occurs during the final solidification, blowholes from unvented cores, reactions at the mold wall, dissolved gases from melting and dross or slag containing gas porosity” (Monroe, 2005). The various porosity morphologies are shown in Figure 2-14. Generally, pores are divided into two main types : (1) gas porosity resulting from entrapped gases look like smooth bubbles, (2) shrinkage porosity forming during the cooling stage look like rough bubbles (Sobolev and Guilemany, 1996) (Lee and Gokhale, 2006) (Nicoletto et al., 2012). If the casting is not properly fed, shrinkage porosity will form. Compared to gas pores, which are typically spherical, shrinkage pores have an irregular 3D shape, which induces stress concentration, so they will be deleterious to fatigue properties (Wang, 2013).
Figure 2-14 Four types of pores in aluminum castings (Monroe, 2005).
The formation of porosity depends on the solidification rate: pores increase in size and decrease in amount with a decrease in solidification rate (Nguyen, 2005) (Lee and Hunt, 1997). It could also be influenced by the content of Si (Zhao et al., 2011). At a high Si content (13%), spherical pores formed