HAL Id: tel-01726970
https://tel.archives-ouvertes.fr/tel-01726970
Submitted on 8 Mar 2018
HAL is a multi-disciplinary open access
archive for the deposit and dissemination of sci-entific research documents, whether they are pub-lished or not. The documents may come from teaching and research institutions in France or abroad, or from public or private research centers.
L’archive ouverte pluridisciplinaire HAL, est destinée au dépôt et à la diffusion de documents scientifiques de niveau recherche, publiés ou non, émanant des établissements d’enseignement et de recherche français ou étrangers, des laboratoires publics ou privés.
Reconstruction of gene regulatory networks defining the
cell fate transition processes
Valeriya Malysheva
To cite this version:
Valeriya Malysheva. Reconstruction of gene regulatory networks defining the cell fate transition processes. Genomics [q-bio.GN]. Université de Strasbourg, 2016. English. �NNT : 2016STRAJ084�. �tel-01726970�
UNIVERSITÉ DE STRASBOURG
ÉCOLE DOCTORALE – ED 414 - Science de la vie et de la Santé
THÈSE présenté par: Valeriya MALYSHEVA
Soutenue le: 10 Novembre 2016
Pour obtenir le grade de : Docteur de l’Université de Strasbourg Discipline/ Spécialité: Aspects Moléculaires et Cellulaires de la Biologie
RECONSTRUCTION OF GENE REGULATORY NETWORKS
DEFINING THE CELL FATE TRANSITION PROCESSES
THÈSE dirigée par:
M. GRONEMEYER Hinrich Dr., IGBMC
RAPPORTEURS:
M. BISCHOF Oliver Dr., Institut Pasteur
M. SPICUGLIA Salvatore Dr., TAGC
EXAMINATEURS:
M. BARILLOT Emmanuel M. FRASER Peter
Mme. HIBNER Urszula Dr., IGMM
M. SEXTON Thomas M. SPITZ François Dr., Institut Curie Dr., Babraham Institute Dr., IGBMC Dr., Institut Pasteur
2
A
CKNOWLEDGEMENTSFirst of all, I would like to thank my PhD supervisor Dr. Hinrich Gronemeyer for giving me this outstanding opportunity to work in his team on this extremely interesting and challenging project, for his courage to accept me as a PhD student, while I am coming from a different scientific field without the necessary experience, for constant enormous support and advice during my PhD and for his always positive attitude. This was THE place to learn and grow. This was my… fate.
Next, I would like to thank all my Jury members Dr. Emmanuel Barillot, Dr. Oliver Bischof, Dr. Peter Fraser, Dr. Urszula Hibner, Dr. Thomas Sexton, Dr. Salvatore Spicuglia, and Dr. Francois Spitz for kindly accepting to read and evaluate my PhD work.
I would like to thank Marco, my supervisor who was leading me through all these years and formed me as a scientist, for his help, guidance and training. Marco, you not only taught me new molecular biology techniques but also showed how to decorticate the problems when experiments do not work, you taught me how to be stable to failures, you made me strong. Without you this work would not be possible and I am infinitely grateful for everything you have done for me.
I would like to thank Matthias Blum, for his enormous every day support and patience while teaching me programming and correcting my Python scripts, when I was lost in manuals and documentation.
I thank all the other current members of the Gronemeyer team and those who left: Valeria, Maxi, Akin, Pierre-Etienne, Michele, Cathie, Aurelie, Lisa, Ashick, Ben and Gosia - thank you for all the help and support throughout these years.
I am also grateful for all the help provided by the IGBMC facilities and administration, Valérie and Violaine for their kind and friendly nature, support and help with translations.
Last but not the least, I would especially like to thank my family that always believed in me, supported me every day and gave me energy, courage and love. I dedicate this work to you.
3
C
ONTENTS Table of figures ... 5 List of abbreviations ... 6 Foreword ... 7 Introduction ... 81. A (very) brief history of time: the cell fate. ... 8
1.1. The uncertainty principle. The fate of a cell and its plasticity. ... 8
1.2. Cell transformation – aberrant fate of a cell ... 9
1.2.1. Principles of cell transformation ... 9
1.2.2. Genetic regulators of cell transformation ... 11
1.2.3. Stepwise transformation systems. ... 14
2. Space and time. Chromatin structure and gene regulation ... 16
2.1. The three-dimensional structure of chromatin ... 16
2.1.1. Chromatin fiber ... 16
2.1.2. Topologically associated domains ... 17
2.1.3. Chromosome territories ... 18
2.2. Experimental techniques for chromatin structure investigation ... 19
2.2.1. Microscopy-based approaches ... 19
2.2.2. Chromosome Conformation Capture and its derivatives ... 19
2.3. Transcription regulation by epigenome and chromatin architecture ... 23
2.3.1. Epigenetic regulation of gene expression ... 24
2.3.2. Gene regulation in 3D context ... 26
2.3.3. Transcription factories ... 27
3. Gene regulatory networks ... 28
3.1. Network inception... 28
3.2. Gene regulatory network reconstruction – How and why? ... 30
3.3. Chromatin structure implication in gene regulatory networks ... 32
Thesis objectives: ... 34
Results... 40
Discussion ... 41
1. How it begins: Initiation of decisions that determine cell fates ... 42
2. Epigenome ... 44
3. 3D organization: cause or effect? ... 46
4. Limitations of proximity ligation methods ... 47
4
6. Thoughts about the beginning, non-equality and diversification ... 52
Perspectives and Conclusions ... 56
References ... 60
5
T
ABLE OF FIGURESFigure 1. The hallmarks of cancer.. ... 10
Figure 2. Loop extrusion model . ... 18
Figure 3. 3C based techniques.. ... 20
Figure 4. Overview of the HiC procedure. ... 21
Figure 5. Capture-HiC principle.. ... 23
Figure 6. Problem of Seven Bridges of Konigsberg.. ... 29
6
L
IST OF ABBREVIATIONS3C Chromosome Conformation Capture
4C Chromosome Conformation Capture on Chip
5C Carbon-Copy Chromosome Conformation Capture
ATRA (RA) All-Trans Retinoic Acid
ChIA-PET Chromatin Interaction Analysis with Paired-End Tag Sequencing
ChIP Chromatin Immunoprecipitation
CRISPR Clustered Regularly Interspaced Short Palindromic Repeats
CRMs Chromatin Remodelers/Modifiers
CT Chromosome territory
EC Embryo Carcinoma
ESCs Embryonic Stem Cells
FAIRE Formaldehyde-Assisted Isolation of Regulatory Elements
FISH Fluorescence In-situ Hybridization
GEO Gene Expression Omnibus
GRN Gene Regulatory Network
GWAS Genome-Wide Association Studies
HOT High-Occupancy Target
HTS High-throughput Sequencing
iPSC (iPS) induced Pluripotent Stem Cell
lncRNA long non-coding RNA
LOGIQA Long-range Genome Interactions Quality Assessment
LOH Loss of Heterozygosity
mRNA messenger RNA
PRC Polycomb Repressive Complex
TAD Topologically Associating Domains
TF Transcription Factor
7
F
OREWORD“The eventual goal of science is to provide a single theory that describes the whole universe. However, the approach most scientists actually follow is to separate the problem into two parts. First, there are the laws that tell us how the universe changes with time. (If we know what the universe is like at any one time, these physical laws tell us how it will look at any later time.) Second, there is the question of the initial state of the universe. (…) it seems ... reasonable to suppose that there are also laws governing the initial state.”
Stephen Hawking “A Brief History of Time”
Though the idea of the eventual goal of the science is debatable and every scientist has different objectives, we are all working on the creation of the grand unifying theory of the universe by fulfilling the gaps of unknown. Starting from different points of cosmology, physics or biology, integrating the knowledge of on-edge sciences, we reconstruct the multi-dimensional puzzle of our universe. Keeping this idea in my mind and in my heart I worked on my PhD projects, amazed by the complexity of our universe and hoping that it will help to put at least one small piece of the puzzle in place.
8
I
NTRODUCTION1.
A
(
VERY)
BRIEF HISTORY OF TIME:
THE CELL FATE.
1.1. THE UNCERTAINTY PRINCIPLE.THE FATE OF A CELL AND ITS PLASTICITY.
Every organism can be seen as a (complex) system that functions according to a biological/chemical program that is specified by genetically encoded information whose storage, maintenance and reading is based on the laws of physics. The fate of each cell is defined by this program and adapted to the developmental history and environmental context in which the cell is placed. However, the algorithms of this program are not yet fully understood nor the limits of the cell fate potential specified in this program.
Initially, cell fate acquisition has been viewed as an irreversible unidirectional path from pluripotent to the differentiated state; Waddington depicted it as a path of a ball down the hill of a landscape1. According to this model the destiny of line-committed cells was pre-defined, unidirectional and irreversible. However, experiments involving the transfer of somatic nuclei into an enucleated egg or fusion of a somatic cell with a pluripotent stem cell provided the proofs of cellular fate plasticity and demonstrated moreover that somatic cell memory can be erased and the cell can be reprogrammed to the pluripotent state 2,3.
Decades later it became clear that differentiated cells can be not only rejuvenated but also directly converted from one cell type to another bypassing the pluripotent state (trans-differentiation) by ectopic expression of a single transcription factor 4–7.
The discovery of the induced pluripotent stem cells (iPSCs) became a milestone in the history of reprogramming. Takahashi and Yamanaka demonstrated that pluripotent stem cells can be directly generated from differentiated cells by the addition of only a few defined transcription factors (OSKM factors: OCT3/4, SOX2, KLF4 and MYC), showing the great plasticity and potential of the cell 8. Thus, the deterministic view of a cell fate is no longer valid and cells may adopt other cell fates if needed. The regenerating lens of the newt is a perfect illustration for such naturally occurring cell fate re-adaptation/ trans-differentiation 9. When the lens is removed, pigmented epithelial cells (PECs) from the dorsal iris dedifferentiate and proliferate to create a new lens vesicle, and then differentiate into the mature cells of the lens. Microarray analyses
9 have revealed that during this process, PECs upregulate cancer and apoptosis-related genes, along with epigenetic modifiers, such as histone deacetylases and histone demethylases 10.
All these studies supported the idea of the transcription factors acting as master regulators of cell identity and fate. However, albeit key TFs have been identified that are sufficient for cell reprogramming 11–14, our knowledge about the temporal evolution and regulation of those TF-specified gene networks that execute cell fate acquisitions and which are essential to understand cell plasticity, has remained fragmentary.
1.2. CELL TRANSFORMATION – ABERRANT FATE OF A CELL
Cell fate transitions are at the basis of essentially all biological processes in multicellular organisms and are tightly controlled. However, escape from the control mechanisms can lead to pathophysiological phenomena. Cancer is such a progressive multistep transition process that – due to (a few or a plethora of) mutations that lead to deregulation of control and failsafe mechanisms of the system - ultimately leads to cell transformation, characterized by aberrant proliferation or survival of cells that have escaped the (immune)surveillance mechanism of the host organism, lost their own control mechanisms, and acquired specific features that enable them to develop an “organism inside the organism”.
1.2.1. PRINCIPLES OF CELL TRANSFORMATION
The complex process of cancer development typically involves multiple genetic, epigenetic and
chromatin changes
.
In a landmark paper Hanahan and Weinberg summarized the common traitsfor the majority of cancer types in hallmarks of cancer 15. The defined traits are limitless proliferative potential, self-sufficiency in growth signaling and insensitivity to growth inhibitory signals, resistance to cell death, induction of angiogenesis and the ability to invade tissue and form metastases. These, together with the recent additions of evasion from the immune system and modification to adapt to the altered metabolism of a transformed cell 16 (Figure 1), describe a prototypic cancer phenotype.
10
In fact, the tumorigenic transformation can be seen as an aberrant cell fate transition that happened due to the abnormal re-wiring of the gene regulatory network underlying the cell state, achieved through gradual accumulation of (epi)genetic changes. A general estimation of the number of these changes suggests that around 2-6 suffice for tumorigenesis 17 and given (1) that the mutation rate in normal human cells is extremely low (100 - 200 mutations per generation 18) and (2) that the majority of them are in non-coding regions, some of the cancer driving mutations (a mutation that is causally implicated in oncogenesis 19) may for example target regulators of genome stability, key factors involved in differentiation, factors regulating the cell suicide in case of serious damage or modulators of the immune system. In some cases, such as for colon carcinoma, the order in which the mutations appear has been defined, suggesting that each one of them is necessary for the next step of cell transformation 20. However, recent reports reveal the existence of an additional rather dramatic mechanism of tumor development that occurs in about 2-3% of all types of cancers, involving massive chromosomal rearrangements in a single step catastrophic event termed chromotripsis 21.
With the improved sequencing technologies, it is now possible to identify the critical (epi)genome changes that are responsible for the development of human tumors, and a concept has been developed which discriminates between the actual "driver" mutations, necessary for
11 tumor growth and secondary “passengers” events, which are not causally involved in the generation of tumor clones. Several large-scale studies gave an extensive description of this dichotomy 22,23 and identification of novel driver mutations 24,25 can further be applied for the design of novel anti-cancer therapies.
Besides genetic changes, cancer cells are also characterized by epigenetic alterations - heritable gene expression modifications that do not involve changes in the DNA sequence. In general, cancer cells exhibit enhanced global DNA hypomethylation, gene-specific local hypermethylation (e.g. of tumor suppressor genes) and altered functions, expression 26 and/or recruitment of epigenetic modulators. Each of these features contributes to global genome instability, repression of tumor suppressors and other cancer-specific changes 27,28.
The genetic and epigenetic processes can act in concert, such that epigenetic changes influence the genome function and vice versa; indeed, oncogene signaling can reshape the epigenetic landscape 29. For example, deamination of 5-methylcytosine (5mC) creates a T:G mismatch which is a hotspot for somatic mutations 30. The inverse also applies when somatic mutations give rise to epigenetic changes, as seen in the case of mutations in genes coding for some of the epigenetic enzymes, such as DNA methytransferase like DNMT3A or the histone methyltransferase KMT6A (also known as EZH2), commonly found deregulated in AML patients 31and lymphomas 32,33.
Understanding cancer was for a long time limited to purely correlative observations and cancer heterogeneity remained largely unexplored. However, recent technological advances have facilitated insight into cause-consequence relationships and the functional complexity of cancer such that a major focus is now on single-cell cancer genomics and systems biology studies of the epigenome 34, offering a view into the complex molecular architecture of cancer. A large amount of data obtained using these approaches has fostered our understanding of the (molecular and cellular) origins of cancer 35,36 and aided in the design of novel cancer therapies 37,38.
1.2.2. GENETIC REGULATORS OF CELL TRANSFORMATION
Genes that regulate cell transformation are divided into two functional groups: oncogenes and tumor suppressor genes. While tumor suppressors - molecular brakes of tumor development – require generally “loss of function” mutations (or deletion) of both alleles in order to produce an
12
effect, oncogenes require only one hit, which endows them with a “gain of function” mutation that suffices for tumor development.
Oncogenes. Proto-oncogenes normally exist in the genome and code for proteins that promote
cell proliferation and growth, but due to mutations and/or overexpression their function(s) become uncontrolled/corrupted and contribute to cancer development. Based on their functions, they can be divided into several categories: growth factors, growth factor receptors, signal transducers (such as the tyrosine kinase Src, the serine/threonine kinase Raf-1 or the small GTPase Ras family), transcription factors (Fos, Jun, Myc, Myb) and cell death regulators (like
Bcl-2).
The first oncogene was Ras, identified in 1982 as a transforming agent in NIH-3T3 mouse fibroblasts and cloned from the T24 and EJ bladder carcinoma cell lines 39–41. In my studies I used a stepwise cellular transformation system where the oncogene c-Myc was used, one of the most prominent oncogenes in humans. c-Myc, which together with N-Myc and L-Myc forms the
Myc family is a gene coding for a transcription factor that was discovered in patients with
Burkitt’s lymphoma. These lymphomas originate from characteristic chromosomal translocations of c-Myc to distinct loci, such as the immunoglobulin heavy chain in the most frequent t(8;14)(q24;q32) translocation, which puts c-Myc under the control of the IGH gene 42. Despite some controversial views on the mechanism by which MYC regulates genes 43, it became increasingly evident that MYC differentially controls discrete sets of genes (up to 15% of the complete genome 44) affecting global transcript levels and altering diverse cellular processes, including cell growth and cell cycle, by deregulation of other TFs and chromatin remodelers. MYC is also known to block cell adhesion, cell-cell communication and/or terminal differentiation and influences apoptosis 45–47.
Heterocomplexes of MYC and the MYC-associated factor X (MAX) enhance transcription by binding to target sequences (‘E boxes’) within the promoters/enhancers of cognate genes. They recruit additional transcriptional activators and chromatin remodelers 48 (such as histone acetyl transferases - GCN5, TIP48) that leads to transcriptional upregulation of target genes. This
action of MYC is antagonized by formation of a second type of MAX complex 49 (MAD-MAX
13 decreased target gene transcription. Thus, depending on the balance of E box occupancy with MYC-MAX or MAD-MAX heterodimers, target genes will be either activated or repressed. Myc also acts as a transcriptional repressor of multiple target genes (p15, p21, p27) by blocking the action of the appropriate transcription factors (such as SMAD, YY-1, SP1, MIZ-1) 50. In the latter case MYC does not bind to target DNA directly, but instead binds to MIZ1 at the site of the core promoter. Gene repression is achieved through competition of MYC and the coactivator p300 for binding to MIZ-1, but also through MYC’s ability to recruit the DNA methyltransferase Dnmt3a to MIZ-1 regulated genes 51.
MYC is a short-lived protein (t1/2 ~ 20 min), but controls a significant number of genes; it is sensitive to subtle changes in amounts that are accompanied by changes in co-regulator recruitment. The model of MYC action suggests that it does not bind to all targets at the same time, but that they all ultimately become transiently occupied in a certain short period 45.
MYC is tightly controlled at multiple levels. Various signaling cascades, such as WNT, RAS/RAF/MAPK, JAK/STAT, TGFβ and others, contribute to increases in MYC transcription. Additionally MYC is heavily controlled at the posttranscriptional level through phosphorylation, ubiquitinylation or acetylation, which affect its stability and activity 52–56.
Importantly MYC stability is altered by other oncogenes and RAS/RAF/ERK pathway through phosphorylation 57, which suggests oncogenic synergy in signaling, where MYC probably acts as a central regulator of cellular transformation 26,58. In support of this, the crucial role of MYC signaling is seen in vivo in mice models of RAS-induced lung adenocarcinoma and SV40-driven pancreatic tumor model, where systemic MYC inhibition by a dominant negative mutant (‘Omomyc’), led to tumor regression 59,60
. These mice also showed profound changes in proliferating tissues, which is in accordance with the well-described central role of c-MYC in cell pluripotency, as it is a part of Takahashi/Yamanaka reprogramming cocktail 8,61. Indeed, cancer and stem cells have some similarities, e.g. ability to proliferate extensively and in case of cancer stem cells to generate populations of non-tumorigenic cells 62 in the way normal cancer cells give rise to differentiated progeny. Our studies also indicated that during the stepwise tumorigenesis cells gradually acquire embryonic stem cell traits, suggesting that oncogene induces or facilitates the re-wiring of normal cells GRNs to stem cell GRNs 26.That implies that
14
deciphering of these GRN transitions will help to understand the principles of key processes of tumorigenic cell transformation.
Tumor suppressors. Based on the role they perform, tumor suppressor genes can be divided
into two categories - caretakers and gatekeepers.
Gatekeepers sense stress or damage within a cell that represents a threat to the fidelity of replication and act to halt proliferation. Once gatekeeper pathways are activated, cell can either be physically removed by apoptosis or permanently growth arrested by becoming senescent. Key regulators of these two processes are the same and the two most important ones are TP53 and RB1. The tumor suppressor TP53 is a transcription factor that is stabilized upon DNA damage and other stress, and acts as a transcriptional repressor of anti-apoptotic genes like BCL-2 and a transcriptional activator of pro-apoptotic genes, therefore leading to apoptosis induction. Conversely, activation of TP53 can also favor senescence via induction of the cyclin-dependent kinase inhibitor (CDKI) CDKN1A, which blocks cell proliferation. The other major tumor suppressor, RB1 is active in its hypo-phosphorylated state and functions by blocking the progression of the cell cycle from G1 to S. In the presence of stress or DNA damage signals, CDKN2A interacts with CDK4 and CKD6, blocking their phosphorylation of RB1, thus keeping it in its active state. Inherited mutations in gatekeeper genes require only one additional mutation in the second allele to produce an effect. Thus, mutations in gatekeepers greatly increase the risk of cancer and these genes are relatively often found in sporadic mutations.
Caretakers have a role in maintaining the genome integrity and preventing the formation of mutations. They are generally involved in DNA repair and can be either the sensors of the DNA lesions (like ATR or BRCA1 or 2) or part of the repair machinery. A single mutation in a caretaker gene needs a mutation in the other allele (or undergo LOH) to become prevalent and yet does not lead to neoplasia but only to higher incidence in the acquisition of other mutations; and thus caretaker-driven tumorigenesis is rarely seen in sporadic cancers 63.
1.2.3. STEPWISE TRANSFORMATION SYSTEMS.
Human cancer cell lines derived from human tumor specimens are extensively used for identification of molecules and pathways involved in malignant transformation as well as for preclinical testing of potential therapeutic anti-cancer compounds. However, these experimental
15 models suffer from several limitations. As such, human-derived cancer cell lines can bear a high number of genetic mutations that complicates deduction of the cause-consequence relationships and reconstruction of the information flux from the initial signal. For the same reason it is difficult to generate stable cell lines using tumor explants, as they accumulate mutations in prolonged cultures. The functional consequences of these mutations are unknown and introduce bias in experiments performed with non-isogenic cells. Additionally, continuous passaging of cell lines derived from human tumors can lead to the selection of fast growing sub-clones that can progressively dominate the culture and do not represent anymore the original cancer type studied, thus introducing a serious bias in the study results.
Due to the multiple levels of tumor complexity mentioned before, a reductionist approach has been developed to understand the basic principles of cancer development. It consists of identification of the minimal fundamental changes required in different cell types for their transformation. In their landmark paper Hahn and Weinberg described a stepwise tumorigenic model system, in which defined genetic changes had been introduced into several primary normal cell types in order to generate cancer cells. Successful transformation of normal cells was achieved by expression of catalytic subunit of telomerase hTERT (which prevents telomere shortening), the oncoproteins of the Simian virus early region 64 (SV40 ER, expressing small and large T) and an overexpressed oncogene. The genetic elements introduced allow cells to bypass several pre-existing barriers in cancer development. Blocking tumor suppressors by SV40 expression among others blocks TP53, RB1 (by large T) and PP2A (by small t) and prevents cell senescence. The additional expression of hTERT enables cells to surpass cell crisis. The advantage of such cell models for experimental studies is their isogenicity, which we validated in our studies 26, thus enabling solid conclusions about the net effect and the role of the introduced genetic elements in tumorigenesis and to accurately compare the immortalized and tumor stages with their normal counterpart.
Full transformation was achieved in this stepwise model in multiple cell types, confirming that the rules of tumorigenic transformation are somewhat universal and that despite the heterogeneity of cancer, there are basic mechanisms that govern the ontogeny of cancer cells. The fully transformed cells exhibit cancer-specific characteristics, such as anchorage-independent growth (as validated in our study 26), tumor formation in nude mice 65,66 and they are
16
sensitive to TRAIL-induced apoptosis 26,46,67,68. These systems provide a valuable tool in studying the processes of transformation, the transformation-related characteristics and is a perfect platform for prediction of new key regulators of tumorigenesis that could be further studied as a potential target in cancer treatment development.
2. S
PACE AND TIME.
C
HROMATIN STRUCTURE AND GENE REGULATION2.1. THE THREE-DIMENSIONAL STRUCTURE OF CHROMATIN
The 3D architecture of the genome influences key cellular processes such as gene regulation, replication and differentiation 69. In order to preserve the integrity and ensure functionality, the DNA in the eukaryotic cell nucleus has to adopt an adjustable and robust non-random dense structure that would at the same time guarantee the accessibility of various DNA binding components of the replication or transcription machineries, epigenome modulators/interpreters and DNA repair enzymes. Thus, tight regulation of chromatin organization in space and time is a key for a proper functioning of the cell fate program. The following section describes different experimental approaches to investigate the chromatin structure itself and the hierarchy of chromatin organization, ranging from the DNA polymer to functional chromatin/nuclear territories.
2.1.1. CHROMATIN FIBER
The DNA consists of two helical chains of 1nm radius centred around the common axis and wrapped around the octamer of histone proteins in 1.65 turns covering 145-147 bp, thereby forming the nucleosomes – repeating building blocks of chromatin separated by linker DNA of 20-50 bp 70. By coiling chromatin folds into highly ordered structures: first, nucleosomal “beads-on-a string” fibers of 11nm in diameter, which are further condensed into 30nm fibers with the help of linker histones 71. Despite efforts during the last decades, the exact arrangement of chromatin into these higher-order structures remained largely uncharacterized, proposing still debatable models of arrangement like solenoid and Zig-Zag models 72–74, which may actually coexist depending on the functional context 75. Similarly, the dynamics and integrity of this fiber during the transcription, cell cycle, differentiation and tumorigenesis, and its topological anchoring and consistence, have remained elusive.
17
2.1.2. TOPOLOGICALLY ASSOCIATED DOMAINS
The next level of organization of metazoan interphase chromosomes are topologically associating domains (TADs) – self-interacting regions of chromatin at a sub-megabase scale 76– 79
. Detected by methods such as microscopy 80 and HiC 76,81, these contiguous regions favor internal contacts and are relatively insulated from the neighboring domains, though contacts between TADs do occur at a relatively lower level 82. Interestingly, TADs have not (yet) been detected in plants 83 and yeast 84, demonstrating that they possess (an) alternative mode(s) of genome folding. Co-localization between TADs composed of similarly transcriptionally permissive or inert chromatin leads to the establishment of A and B compartments, or open and closed compartments, respectively 81.
An increasing number of studies describe an important functional role of TADs in gene regulation 85–87. Some TADs have homogeneous interiors, while others have a rather nested structure and are partitioned into smaller sub-TADs that are thought to vary and may facilitate changes in gene expression during cell differentiation 88, DNA replication 89 and development 90. Upon experimental deletion of a TAD boundary, the TAD spreads to the next boundary, indicating that inter-TAD contacts are not hard-wired and that boundary-associated elements play crucial roles 77.
Formation and maintenance of TADs are mediated by various architectural proteins, including CTCF, and the Cohesin and the Mediator complexes 91, which stabilize these contacts and restrict the distance over which enhancer-promoter interaction can occur 92. However, despite an enrichment at TAD boundaries, neither the presence of CTCF/Cohesin sites nor CTCF binding is sufficient to establish TAD boundaries; indeed only 15 % of all CTCF binding sites are found at TAD boundaries 76. Similarly, insulator-binding proteins do not always block inter-TAD chromatin interactions. At the same time, knockdown of CTCF results in less well-defined TAD boundaries, reducing intra-TAD and increasing inter-TAD interactions, which is accompanied by changes in gene expression93. Neither disruption of the Cohesin complex nor its deletion destabilizes TAD boundaries 93,94, though its disruption leads to a diminution of intra-TAD interaction. All these studies indicate, that although architectural proteins are required for proper chromatin organization in some cases, they are not necessary for TAD boundary formation, which may depend on contextual factors.
18
Another open question is mechanism of TAD formation. Based on polymer simulations of the chromatin fiber it was recently proposed that cis-acting loop-extruding factors (potentially Cohesins) form progressively larger loops by extrusion, but are stalled by boundary elements,
such as CTCF at TAD boundaries 95. The proposed mechanism suggests that TADs consist of
dynamically forming, growing and dissociating loops. Interestingly, this model stands against the popular view of TADs as stable loops, as the modeling of such scenario provides some of the worst fits to HiC data 95. Importantly, the loop extrusion mechanism (Figure 2) recapitulates the results of TAD boundary deletion experiments 77, further supporting this hypothesis.
2.1.3. CHROMOSOME TERRITORIES
Each chromosome, subdivided into many TADs, resides within a discrete volume of space known as a chromosome territory (CT), as has been demonstrated by microscopy-based approaches 96. The potential formation of CTs has been described also by several polymer models (equilibrium model, fractal globule 81). Transcriptionally repressed genes tend to be positioned at the nuclear periphery and are often attached to the nuclear lamina 97, while
Figure 2.Loop extrusion model proposing that tads consist of dynamically forming, growing and
19 transcriptionally active genes prefer interior nuclear regions 98. However, some exceptions do exist, like the case of rod photoreceptor cells of nocturnal animals, where the euchromatin is expelled to the nuclear periphery and heterochromatin occupies the central part of the nucleus, thus serving as an optical lens for efficient light detection 99.
2.2. EXPERIMENTAL TECHNIQUES FOR CHROMATIN STRUCTURE INVESTIGATION
There are two major approaches to investigate chromatin architecture: one is imaging, including microscopy combined with various fluorophores, the other is based on the Chromosome Conformation Capture (3C) assays, giving the read-outs through qPCR or HTS.
2.2.1. MICROSCOPY-BASED APPROACHES
The first method applied in studies of chromosome shape and size was microscopy, which enabled the establishment of karyotypes of human cells. Giemsa staining further improved the method, resulting in the detection of G-bands of chromosomes and of large-scale genome aberrations, such as chromosomal translocations.
Fluorescence In-situ Hybridization (FISH)100 uses fluorophore-labelled custom DNA probes, which hybridize with genomic DNA, allowing targeted visualization of loci at a 200nm resolution. To trace DNA in a 3D space, 3D FISH has been developed by taking advantage of multiple fluorophores and guide DNAs. RNA-FISH allows the detection of various RNA species, like messenger RNA (mRNA) and long non-coding RNA (lncRNA). Combining such spatial data from a few hundred cells one can estimate the frequency of co-localization between selected loci. However, this technique is limited in coverage, such that only a few loci can be monitored simultaneously.
2.2.2. CHROMOSOME CONFORMATION CAPTURE AND ITS DERIVATIVES
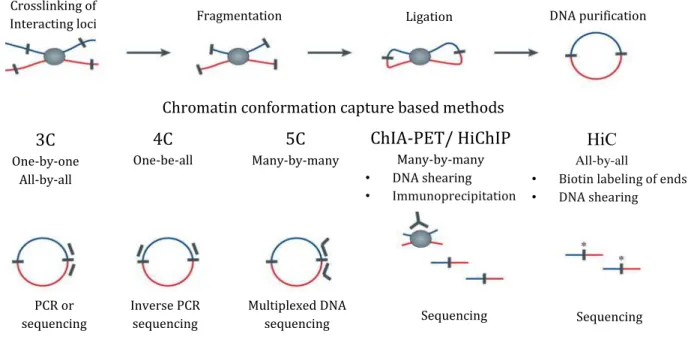
Chromosome Conformation Capture(3C) was the first molecular method in a 3C family 101; it investigates the genome organization relying on proximity ligation (Figure 3). In brief, the chromatin undergoes sequentially through the following steps: crosslinki, digestion by a
20
restriction enzyme ii, ligation, purification and analysis by PCR, qPCR using sequence specific primers or by sequencing.
There are a number of 3C-derived methods, like 4C and 5C, aiming to investigate larger number of interactions, with HiC ultimately monitoring long-range chromatin interactions at genome-wide scale, albeit with still fairly low resolution (Figure 3).
In 4C – Chromosome Conformation Capture on Chip 102 – the 3C library is cut with a second restriction enzyme. The fragments are circularized during the second round of ligation and further amplified by Inverse Polymerase Chain Reaction. The advantage of this additional circularization step is that the amplification reaction can be done using only one end of the fragment of interest - bait. The 4C library is further analyzed using hybridization to DNA microarray or by HTS 103. Thus this procedure allows the discovery of all the interactions with one site of interest iii.
iioften HindIII is used; sonication/tagmentation approaches are less used but attractive alternatives in view of
increased resolution
iii the so-called “viewpoint”; this approach is also referred to as “one-by-all” 3C One-by-one All-by-all 4C One-be-all 5C Many-by-many HiC All-by-all
• Biotin labeling of ends
• DNA shearing
Principle of capturing of long-range chromatin interactions
Chromatin conformation capture based methods
ChIA-PET/ HiChIP Many-by-many • DNA shearing • Immunoprecipitation PCR or sequencing Inverse PCR sequencing Multiplexed DNA
sequencing Sequencing Sequencing
Crosslinking of
Interacting loci Fragmentation Ligation DNA purification
21 The Carbon-Copy Chromosome Conformation Capture (5C) 104 gave the possibility to inspect the interactions of many different sites at the same time, as the library is amplified with multiple primers through the multiplex ligation-mediated amplification (LMA). This procedure allows the capture of any fragments defined by the primer set iv. These primers are custom selected, though in the majority of studies these primers cover a continuous genomic region of several megabase.
The development of the HiC method in 2009 81 revolutionized the world of chromatin organization studies, as this method reports interactions between any pair of loci in the genome. The concept of HiC is similar to 3C with several important modifications (Figure 3, Figure 4). After the digestion with the restriction enzyme, the DNA overhangs are filled in with nucleotides, one of which is biotinylated, followed by the blunt-end ligation. After purification of the DNA, it is sheared by sonication and the biotinylated fragments are pulled down with streptavidin-coated magnetic beads to enrich the final library with the ligation products, which are further amplified by PCR and sequenced. While the idea of HiC is very simple, the original protocol contained several weak points and needed optimization, which I performed during the experimental work in the context of my PhD studies (see Materials and Methods of Publication N° 4 Malysheva et al. 2016. ‘Chromatin structure dynamics directs cell fate acquisition’, manuscript in preparation).
Although in theory HiC gives the most comprehensive map of interactions, the complexity of the HiC libraries is very high and to reveal all interactions that took place in an experimental sample needs a very high sequencing depth. Assuming that every restriction fragment can interact with
iv this approach is referred to as “many-by-many”
22
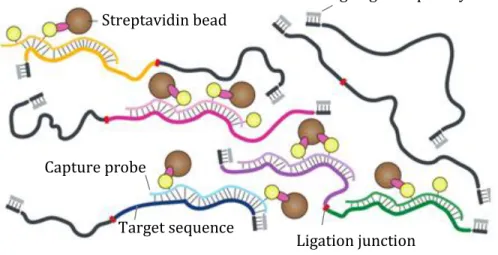
any other fragment, one would expect a theoretical number of 1011 possible HindIII restriction fragment pairs from the human genome. Moreover, the more frequent are the restriction sites of the enzyme in use, the higher should be the sequencing depth, as more potential interacting fragments will be produced. For example, the usage of DpnII as a restriction enzyme would theoretically generate 1013 possible restriction fragment interaction pairs. Thus, it is difficult to generate a Hi-C library with enough complexity at a sequencing depth that covers all possible restriction fragment interactions. This indicates that the current HiC datasets of large genomes are far from being sequenced at optimal depths, while for small genomes, e.g. Drosophila, this is much easier to attain. Our tool for the quality estimation of long-range chromatin interactions (LOGIQA 105) confirms this notion, as the quality of the HiC datasets are in general increasing with increasing sequencing depth, while for Drosophila quality-vs-depth curve reaches a plateau much earlier. Techniques such as ChIA-PET, 4C, Capture HiC and the recently developed HiChIP can help to localize the view v, thus to reduce the library complexity and the minimum needed coverage depth, while providing more details in the interactions of the regions of interest. In Capture-HiC 106, sequences of interest can be enriched from a Hi-C DNA library to obtain highly multiplexed, targeted interaction profiles (Figure 5). This involves the hybridization of biotinylated capture-probes to DNA sequences of interest followed by capturing of this library of probe–target sequence complexes on streptavidin beads.
Another limitation of C-based techniques is that the primary signal is averaged over millions of cells. Though this data may uncover the preferred conformation of loci, it doesn’t give an information about cell-to-cell variability in a way that DNA FISH does. To address the heterogeneity of the sample single-cell HiC has been developed 107. As any given site can only be ligated only ones (or maximum n times with copy number n), the amount of signal from a single-cell experiment is much less than in Hi-C. However, pooling maps from single cell experiments results in interaction matrices similar to HiC, showing it to be a faithful average of single-cell data. Comparison of whole chromosome contact maps suggested that domain intactness is generally conserved at the single cell level, with intra-domain structures showing much less variability than inter-domain contacts 107. This corroborates the previously observed stability of TADs.
23 The first technique developed to investigate chromatin interactions, mediated by a protein of interest, in a genome wide manner was Chromatin Interaction Analysis with Paired-End Tag
Sequencing (ChIA-PET) 108. In this method the crosslinked chromatin is first immunoprecipitated prior ligation by using the antibody directed against the protein of interest. The ChIA-PET library is further read by HTS. This technique has been used to study interactions involving subsets of functional genomic elements bound by estrogen receptor 1, ESR1, RNA Polymerase II, CTCF, SMC1A and RAD21 as well as various histone marks, such as H3K4me1,
H3K4me2, H3K4me3 and H3K27ac 109–115.
However, ChIA-PET requires hundreds of millions of cells per experiment and results in a small fraction of informative reads for a given sequencing depth 116. The recently developed HiChIP technique 117 somewhat reversed the ChIA-PET protocol by performing the ChIP with ligated chromatin (including also some additional technical modifications) that improved the yield of conformation informative reads by over 10-fold and requires over 100-fold less of the input material relative to ChIA-PET 117. Thus, HiChIP is a new promising method for 3D genome structure studies.
2.3. TRANSCRIPTION REGULATION BY EPIGENOME AND CHROMATIN ARCHITECTURE
The epigenetic environment and the chromatin structure into which a gene is embedded have a strong influence on transcription, as many nuclear regulatory mechanisms act locally in a 3D
Streptavidin bead
Ligation junction Capture probe
Target sequence
Blocking oligo-adapter hybrid
24
nuclear space. As such the local concentration of transcription factors, RNA polymerase II and the associated factors/complexes/machineries, as well as the accessibility of local chromatin have a large impact on transcription118. Similarly, histone modifications and DNA methylation patterns influence gene transcription as well. Finally, the spatial distribution of small RNA molecules can also affect gene regulation, as in the case of the silent mammalian X-chromosome in females, which is inactivated vi by the actions of the Xist non-coding RNA and its regulators, such as the repressor Tsix, the activator Rnf12 and other putative positive regulators (Jpx, Ftx and Xpr), resulting in specific chromatin modifications, spatial reorganization of the chromosome and its almost complete transcriptional silencing119–121. Interestingly, these studies showed a functional connectivity between the chromatin organization, epigenetics and gene expression/silencing. Indeed, Tsix transcription levels were correlated with TAD compaction using RNA and DNA FISH in the same cells. It was thus proposed that structural fluctuations within TADs may underlie differential transcriptional status and contribute to generating asymmetries between the two X chromosomes, hence influencing choice during the onset of X chromosome inactivation 122.
2.3.1. EPIGENETIC REGULATION OF GENE EXPRESSION
Ground-breaking studies in the mid-20th century on position-effect variegation and transposable elements 123,124, followed by the discovery of X-chromosome inactivation 125 and imprinting 126,127
led to the concept that identical genetic material can be maintained in different ‘on’ or ‘off’ states in the same nucleus affecting the phenotype. These observations supported the idea of the epigenetic changes – initially coined by Waddington as changes of phenotype without changes in genotype – as being an additional regulation mechanism of cell-type identity, transducing the inheritance of gene expression patterns without altering the underlying DNA sequence.
First reported epigenetic modification was the DNA methylation, which connection with gene expression has been established in numerous studies on ovalbumin and globin genes 128,129, showing the anti-correlation between the level of DNA methylation and gene expression levels. Soon thereafter, the implication of global DNA hypomethylation (at CpG dinucleotides) in cancer has been reported 27 and further local DNA hypermethylation of tumour suppressor genes 130
. Examples of genes affected by hypomethylation include oncogene HRAS 131, CCND2 in
25 gastric carcinoma 132, human papillomavirus 16 (HPV16) in cervical cancer 133, etc. Indeed, the frequency of hypomethylated sites appears to be high, as indicated by high throughput genomic-methylation analysis of tumors 134, including cancers of stomach, colon, pancreas, liver, uterus, lung and many others. Moreover, pre-malignant adenomas also had generally altered DNA methylation patterns 135,136.
Discoveries of post-translational modifications of histones and development of modification- or site-specific antibodies implication in gene regulation enabled the identification of the role of these modifications, in addition to DNA methylation, in regulating gene activity 137–139. Today we possess the knowledge about a large spectrum of histone modifications that led us to distinguish active and repressed genomic regions. The epigenetic landscape of chromatin is not even and there are modification-rich ‘islands’, which tend to be the regions that regulate transcription or are the sites of active transcription. As such, active transcriptional enhancers are marked with H3K4me1 and H3K27ac 140–142, while promoters of active genes possess a high enrichment of H3K4me3, H3K9ac and in some cases H3K27ac. In addition, H3K36me3 is highly enriched throughout the entire transcribed region. At the same time, trimethylation of lysines 27 and 9 of H3 – are classical markers of repressed transcription.
Furthermore, bivalent domains, defined by the co-existence of a H3K4me3 permissive histone mark and a repressive H3K27me3, are thought to play an important role in pluripotency by keeping the developmental genes in a poised state ready for activation upon differentiation of ESCs 143,144 or of epiblasts 145. However, the nature of bivalency has been recently questioned. It has been proposed to be an in vitro artifact resulting from suboptimal culture conditions 146 or from technical difficulties associated with the low amounts of available material 147,148. There have been also controversy reports from non-mammalian species, with bivalent domains present in zebrafish 149 but absent in Xenopus or Drosohila embryo 150. However recent studies in primordial germ cells (PGCs), embryonic precursors of the germline, have shown developmental regulatory genes remaining bivalent and silent in vivo 151, but they do not maintain these features in the adjacent somatic cells, which represents a scenario similar to cultured ESCs that differentiate. Potentially, the maintenance of bivalency through the germline could provide the basis for the controversially disputed transgenerational epigenetic inheritance [for a classical example of this hypothesis, see 152]. Interestingly, loss of the H3K27me3 mark from bivalent
26
promoters has been reported to lead to activation of cancer-promoting genes in colorectal cancer 153, including stem cell regulators, oncogenes and proliferation-associated genes.
New advances in technology allow now the analysis of single-cell epigenomes with more precision 154,155, indicating that almost the entire genome is transcribed, giving rise to a range of ncRNA with distinct regulatory functions 156 and many others among them remaining under investigation.
2.3.2. GENE REGULATION IN 3D CONTEXT
Metazoan genomes are organized in linear clusters of co-expressed genes that span about 100kb in Drosophila melanogaster 157 and 1 Mb in humans 158, this size corresponds to the average TAD in these species. Furthermore, TADs were found to overlap with the chromatin states 76,78,159, thus assigning a certain chromatin type to each TAD.
The position of a TAD in the nucleus relatively to other TADs or nuclear structures, such as nuclear lamina, can change during the development, supporting a role of a TAD localization in cell type specification. For example, entire TADs on the X-chromosome re-localize to the nuclear lamina during the X-chromosome inactivation in the early embryonic development 77. TADs harbor multiple genes and correlate with active and repressive epigenetic marks. This discovery brought a missing link to chromosome biology, linking thousands of genes and enhancers in a structured way. Genes in the same domain tend to be physically close and have similar epigenetic make-up, such as chromatin marks or DNA methylation patterns.
Chromatin looping can occur between a variety of genetic elements within a given cell type, linking local genome organization to cis-regulation of both, gene expression and alternative splicing. Studies conducted by the ENCODE consortium demonstrated that many promoters in a given cell are contacted by multiple enhancers, and vice versa, and that gene expression driven from a given promoter positively correlates with the number of enhancers contacting it in a cell population160. As the one of the main drivers of cell type-specific gene expression, enhancer usage is dynamic during the cell proliferation, differentiation and other cell physiological processes 161. Correlating chromatin state and RNA polymerase II occupancy at enhancers and promoters enabled the identification of co-regulated elements that tend to co-localize within a same TAD, thus supporting the model that functional promoter-enhancer interactions are
27 delimited by TAD boundaries 87,92. At the same time, genes that are located in-between TADs, so-called TAD boundaries, are able to change the direction of their interaction preferences, switching their interactions from one TAD to another, like in the case of Hox cluster genes 85.
2.3.3. TRANSCRIPTION FACTORIES
Previous studies suggested that the transcriptional activity in a cell may take place in a few hundred transcription factories162–164. According to this hypothesis RNA polymerase is immobilized, while the DNA is going through it creating nascent RNA165. Accordingly, genes move in and out of these factories, creating bursts of transcription. The fact that the foci remain stable even after the inhibition of RNA polymerase II lends some support to the hypothesis of transcription factories; indeed, if transcription factories were just aggregations of active genes one could expect that they would fall apart if transcription stopped. Moreover, it has been demonstrated that co-regulated genes binding the same transcription factors tend to co-localize at common transcription factories166. Taking into account that co-regulated genes and enhancers tend to be found in the same TAD it is tempting to hypothesize that there is a cross-talk between TADs and transcription factories.
In addition, recent integrative study of long-range chromatin interactions in K562 cells showed that high-occupancy target (HOT) regions, marking promoters of highly expressed genes 167,168, were enriched at interacting loci and tended to interact with other HOT regions. This finding supports the transcription factory model. The strong enrichment for cohesion, CTCF, and ZNF143 at all interacting loci including HOT regions suggests that these factors are possible regulators or facilitators of transcription factories 115.
However, the hypothesis of transcription factories is still debatable raising the questions of their generality and importance for transcriptional regulation. In particular, it is unknown how such a ‘factory’ is capable of transcribing genes on the (+)-strand and (-)-strand at the same genomic locus at the same time. There is also no convincing experimentally supported model revealing how the polymerase remains immobilized or how and to what structure it is tethered to.
28
3. G
ENE REGULATORY NETWORKSAll the aspects discussed above deal with the structural organization of chromatin and its functional modifications as a complex regulatory platform that has one function: to regulate the expression of genes in a dynamic, temporally defined manner, specific for a particular cell type and responding to the cognate signaling inputs. Altogether, this results in cell fate-specific expression of coding and non-coding RNAs, which is instructed by a gene-regulatory program that triggers cell homeostasis and cell fate progression along a physiological or pathological trajectory. Thus, one could look at the organism with its multitude of diverse cell types, each of them with an imprinted/memorized history and (more or less, depending on the cell) specified future, as a temporal program that defines a complex map of cell fate probabilities. To understand this map of cell fates we have to reconstruct the roadmaps of cell fate regulation – i.e., the gene regulatory networks.
3.1.
N
ETWORK INCEPTIONThe dramatic progress in molecular biology, biotechnology and bioinformatics over the past years has allowed us to discover plethora of novel molecular interactions giving rise to metabolic circuits, signaling networks and molecular machineries. Each of these circuits doesn’t function as an isolated complex but contains up to several thousands of different types of interconnected components engaged in a complex regulatory network. This network, when extended to the cell level, ultimately represents a complex map of cell abilities, a plethora of programs that a cell has to follow or, alternatively, could potentially follow. The interactions of these programs will specify the characteristics of tissues, organs and finally of the whole organism. Thus, understanding of the global topological organization of such complex networks is a crucial step towards elucidating a comprehensive functional map for the entire cell, and is critical for deciphering the acquisition of the diverse cell fates, and the maintenance and dynamics of cell functions. All these features are essential to guarantee the development and proper function of cells and organs in the compartmentalized mammalian body. While some variations are tolerated and rescue/failsafe systems are operative surveillance units, intolerable deviations can occur, particularly at key nodes and lead to pathological malfunction. Therefore, network analysis has emerged also as a powerful approach to elucidate disease processes169.
29 Though being a relatively recent problem to solve, the history of network “decryption” goes back to 1736 and the famous ‘Euler’s problem of Seven Bridges of Königsberg’ 170
(Figure 6). The initial problem was as simple as finding a way of walking around the city by crossing each of the
bridges exactly once. He also addressed the generalized problem: given any division of a river into branches and any arrangement of bridges, is there a general method for determining whether such a route exists. Though in the particular case of the seven Königsberg bridges such a walk was impossible, the reasoning why it is actually impossible led to some of the original concepts of node-edge relationships and the following constraints of a walk through the graph. These ideas initiated the topology and graph theories, the concepts of which have evolved significantly through the past several hundred years and have been applied in studies of diverse networks across multiple disciplines.
Real-world complex systems, abstracted to networks, including biological networks share common global architecture termed the ‘small-world’171
and ‘scale-free’. ‘Small-world’ stands for a network with small characteristic path lengths and a relatively high level of clustering vii. ‘Scale-free’ refers to the to the node connectivity in the real world networks, which have been shown to fit a power-law distribution, with most nodes having few connections and a few nodes being highly connected (scale-free networks) 172,173. These two key observations initiated a new approach to model biochemical reactions in a cell. Instead of viewing reactions in pathways as interaction of enzyme with a substrate followed by generation of a product or a binding reaction, biochemical interactions were now abstracted to nodes and links (‘edges’) forming a network174
.
vii
i.e., groups of nodes have many interactions with one another
30
3.2.
G
ENE REGULATORY NETWORK RECONSTRUCTION–
H
OW AND WHY?
There are two fundamental approaches to use the graph theory in the analysis of regulatory biological networks. The first provides an understanding of the global organization of such networks. For this, the properties and attributes computed for individual nodes, links, and/or groups of nodes and links are averaged, or the distribution of such properties is analyzed and compared with the distributions found in randomly reorganized network. The second approach uses the prior knowledge of multivariate experiments (e.g., microarray data sets) in the context of known pathways and networks to infer cause-consequence relationships and regulatory links. Depending on the question of a particular study one can use both approaches or rather try to find key regulators/pathways by analyzing the attributes of nodes or edges.
An important attribute/property of nodes is their degree - the number of direct neighbors of a node. Different types of biochemical networks across different species were found to have a connectivity degree distribution that fits a power-law function172,175,176; this can be explained by the fact the proteins in the cell are pleiotypic, serving many different functions. In real world-networks most nodes have few neighbors but a substantial number of nodes have a high degree, termed hubs. The identification of hubs is often of interest, as they have been shown to be topologically and functionally important: the deletion of genes encoding hub proteins frequently correlates with lethality in yeast (the centrality-lethality rule175). Hubs might be master regulators of biological processes177 and have been found to be preferentially targeted by both bacterial and viral pathogens178.
In addition, another layer of topological metrics can be analyzed – bottleneck nodes, defined as those interconnecting highly connected nodes or hubs in the system. Previous reports demonstrated that bottleneck nodes might represent highly relevant components of the signal transduction process 179.
One of the approaches to construct a network is to query different interaction databases to identify the ‘interactors’ of a list of genes or proteins of interest (e.g., differentially expressed genes). The query of protein-protein databases would result in an undirected network where the information of a signal flux direction is not represented, while the use of other databases/tools like CellNet 180 would result in a directed network. In the latter case the database contains the
31 information of transcription factor- target gene (TF-TG) that enables following the propagation of the signal through the network. Once the network is reconstructed one can identify the hubs and/or bottlenecks of the network. This approach enables the identification of a larger network for analysis than in the case where one restricted the interactions to only those that occur between nodes in the gene/protein list. In addition, this way of network analysis can help to identify sub-networks that are enriched in co-regulated genes, or identify non-differentially expressed nodes that are topologically important in the network, both of which would not be identified otherwise.
However, analysis of complex comprehensive network is a challenge, as the number of nodes and connections can easily extend to tens of thousands. Moreover, biological networks, are not static entities181, and as the cell undergoes diverse process (e.g., (trans)differentiation), hubs may (dis)appear or the spectrum of hub actions can vary along the temporal dimension182,183. In this case integrating contextual information, such as gene expression data, with standard network analysis can provide information about the most relevant key factors and sub-networks in a particular context184–186. To address this challenge and identify hubs in networks a number of
tools has been developed, including Hubba187, APID2Net188, PinnacleZ189,
NetworkAnalyzer190,191 and CentiScaPe192; these tools are based on different node parameters, such as degree, Maximum Neighborhood Component (MNC), Density of Maximum Neighborhood Component (DMNC) and other parameters.
Altogether network reconstruction may aid in the identification of potential drug-targets for the development of novel therapies, including not only cancer but also inflammation, degenerative diseases or infectious disease caused by emerging pathogens 193. Examples of cancer systems biology 194 are the identification of (rare) driver mutations in cancer 195,196 or of pathways associated with survival of cancer patients in view of a personalized therapy 197, or the mode of action of pharmacological compounds 198. Another area, which gains progressively attention in the scientific community, is the assessment of cells destined for regenerative medicine. Obviously, the demonstration of the ability of such stem/precursor cell to adopt in vitro a cell fate and a functionality that is essential for its use in regeneration, as deduced from the reconstructed network and comparison with the (normal) cells to be substituted, will be a milestone achievement towards a successful therapeutic use.
32
3.3.
C
HROMATIN STRUCTURE IMPLICATION IN GENE REGULATORYNETWORKS
Systematic mapping of transcription factor binding sites and open chromatin regions have uncovered complex regulatory networks revealing mechanisms of gene regulation 199. However, in addition to local interactions, 3D contacts between distal regulatory elements play an important role in gene regulation 166,200,201. Comparison of long-range interactions between cell types revealed that enhancer-promoter interactions are highly cell type-specific 115. Construction and comparison of distal and proximal regulatory networks revealed a difference in structure and biological functions. Proximal binding events appear to be enriched in genes with housekeeping functions, while many cell-type-specific and dynamic biological processes were regulated by distal binding of TFs 115.
Supporting a causative relationship between cell type-specific GRNs and genome organization, loss of Klf 202, Nanog or Oct4203 disrupted pluripotency-specific long-range chromatin contacts in pluripotent cells. Furthermore, ectopic recruitment of Nanog to chromatin was sufficient to induce chromatin interaction between the targeted locus and other Nanog-bound regions203. These functional studies clearly show that regulatory factors play causal roles in the establishment of chromatin organization
However, despite these advances the mechanism of establishment and regulation of long-range interactions in cell fate acquisition process as well as their role in this process remains elusive. Moreover, how the aberrant re-wiring of chromatin regulatory interactions, their cross-talk with epigenome and their role in GRN establishment of tumorigenesis is a key question to answer in order to understand the cell transformation process. Answering these questions requires (i) a comprehensive map of short-range and long-range interactions between regulatory elements (‘chromatin interactome’), (ii) detailed maps of transcription factor binding (‘cistromes’), (iii) histone modification (‘epigenome’) and (iv) gene expression (‘transcriptome’) analysis in the investigated cells and (v) integration of all these levels along the temporal dimension during the processes of normal and aberrant cell fate acquisition.
To address these questions for two model systems of cell fate transitions, namely the neuronal and endodermal cell differentiation induced by the morphogen retinoic acid and the stepwise
33 tumorigenesis of primary human cells, which are the topics of my PhD project, we conducted integrative transcriptome, epigenome and chromatin architecture studies. Through extensive integration with thousands of available genomic data sets, we deciphered the gene regulatory networks of these processes and revealed new insights in the molecular circuitry of cell fate acquisition.
34
T
HESIS OBJECTIVES:
Study I. Reconstruction of gene regulatory networks of tumorigenesis to define key transcription factors and chromatin remodelers in cell transformation. (Malysheva
Valeriya, Marco-Antonio Mendoza-Parra, Mohamed Ashick Mohamed Saleem and Hinrich Gronemeyer. Reconstruction of gene regulatory networks reveals chromatin remodelers and key transcription factors in tumorigenesis. Genome Medicine. (2016) 8, 1–16 2016)
Alterations in genetic and epigenetic landscapes are known to contribute to the development of different types of cancer. However, the mechanistic links between transcription factors and the epigenome which coordinate the deregulation of gene networks during cell transformation are largely unknown.
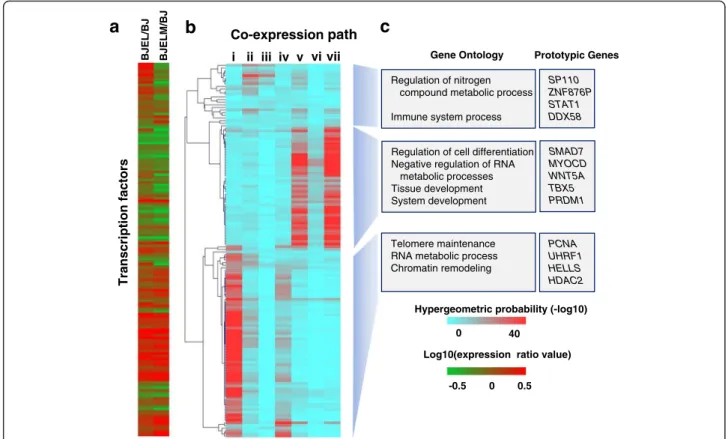
To monitor the progressive deregulation of gene networks upon immortalization and oncogene-induced transformation while ensuring cell-to-cell comparability, a stepwise human cellular transformation model was chosen for the current study. In this model primary human cells (BJ) were first immortalized and pre-transformed into BJEL cells by the introduction of hTERT (the catalytic subunit of telomerase) and the large T and small t-antigen of the SV40 early region. The full transformation into bona fide tumor cells was achieved by overexpression of the c-MYC oncogene. The experimental advantage of this system is that normal, immortalized, and tumor cells are near isogenic, as revealed by single-nucleotide polymorphism (SNP) analysis, such that data obtained for the pre-transformed and cancer cell can be accurately compared with the normal counterpart.
We applied a systems biology approach by combining transcriptome and epigenome data for each step during transformation and integrated transcription factor–target gene associations in order to reconstruct the gene regulatory networks that are at the basis of the transformation process. The following questions were addressed:
(i) how are the global patterns of gene expression and chromatin organization changed; (ii) how are these levels coordinated during tumorigenesis; and