HAL Id: tel-02926274
https://tel.archives-ouvertes.fr/tel-02926274
Submitted on 31 Aug 2020HAL is a multi-disciplinary open access
archive for the deposit and dissemination of sci-entific research documents, whether they are pub-lished or not. The documents may come from teaching and research institutions in France or abroad, or from public or private research centers.
L’archive ouverte pluridisciplinaire HAL, est destinée au dépôt et à la diffusion de documents scientifiques de niveau recherche, publiés ou non, émanant des établissements d’enseignement et de recherche français ou étrangers, des laboratoires publics ou privés.
Explicit memory inclusion for efficient artificial
bandwidth extension
Pramod Bachhav
To cite this version:
Pramod Bachhav. Explicit memory inclusion for efficient artificial bandwidth extension. Signal and Image Processing. Sorbonne Université, 2019. English. �NNT : 2019SORUS492�. �tel-02926274�
Explicit memory inclusion for
efficient artificial bandwidth extension
Dissertation
submitted to
Sorbonne Université
in partial fulfilment of the requirements for the
degree of Doctor of Philosophy
by
Pramod BACHHAV
14
thNovember, 2019
Thesis Advisor Prof. Nicholas EVANS, EURECOM, France
Reviewers Prof. Tim FINGSCHEIDT, Technische Universität Braunschweig, Germany
Prof. Tom BÄCKSTRÖM, Aalto University, Finland
Examiners Dr. Christophe BEAUGEANT, Renault, France
Abstract
Legacy telephony terminals and infrastructure typically operate with bandwidths of 0.3-3.4kHz. At such narrow bandwidths, speech quality and intelligibility can be poor, especially for consonant sounds. Today’s terminals and infrastructure, in contrast, operate at wider bandwidths for which speech quality and intelligibility is greatly improved. Naturally, though, the complete transition from narrowband to wideband (0.05-7kHz) and super-wideband (0.05-14kHz) communications will require considerable time. As a result, wide and super-wideband technology must interoperate with narrowband technology. In this case, users will experience substantial variations in speech quality and intelligibility. Artificial bandwidth extension (ABE) algorithms have been developed to improve speech quality and intelligibility in situations where wideband (or super-wideband) capable technology is used alongside narrowband (or wideband) terminals or infrastructure. ABE involves the automatic estimation of missing higher frequency components from available lower frequency components.
Most ABE algorithms exploit contextual information or memory captured via the use of static or dynamic features extracted from neighbouring speech frames. The use of memory leads to higher dimensional features and increased computational complexity. When information from look-ahead frames is also utilised, then latency also increases. Past work points toward the benefit to ABE of exploiting memory in the form of dynamic features with a standard regression model. Even so, the literature is missing a quantitative analysis of the relative benefit of explicit memory inclusion. The research presented in this thesis assesses the degree to which explicit memory is of benefit and furthermore reports a number of different techniques that allow for its inclusion without significant increases to latency and computational complexity. Benefits are shown through both a quantitative analysis with an information-theoretic measure and subjective listening tests. Key contributions relate to the preservation of computational efficiency through the
Abstract
use of dimensionality reduction in the form of principal component analysis, semi-supervised stacked autoencoders and conditional variational auto-encoders. The two latter techniques optimise dimensionality reduction to deliver superior ABE performance.
The potential gain in speech quality when extending from wide to superwide band speech is much less than when extending from narrow to wideband speech. In this case, increases to computational complexity can be difficult to justify. The final key contributions reported in this thesis involve the development of an especially efficient approach to super-wideband ABE based on linear prediction analysis-synthesis which avoids the statistical estimation of missing higher frequency components. In addition to computational efficiency, the solution delivers speech of superior quality to wideband speech signals processed with an adaptive-multirate wideband codec.
Contents
Abstract i
List of Abbreviations ix
List of Figures xv
List of Tables xix
1 Introduction 1
1.1 Evolution of communication systems . . . 2
1.1.1 Analog and digital telephony . . . 2
1.1.2 Wireless cellular networks . . . 3
1.2 Speech production . . . 5
1.2.1 Speech sounds . . . 6
1.2.2 Spectral characteristics of speech sounds . . . 8
1.2.3 Effect of bandwidth on speech quality and intelligibility . . . 9
1.3 Speech coding . . . 11
1.3.1 Narrowband coding . . . 11
1.3.2 Wideband coding . . . 13
1.3.3 Super-wideband or full band coding . . . 15
1.4 Artificial bandwidth extension . . . 18
1.4.1 Non-blind methods . . . 18
1.4.2 Blind methods . . . 19
1.4.3 Motivation and applications . . . 19
1.5 Super-wide bandwidth extension . . . 23
1.6 Contributions . . . 23
1.7 Outline of the thesis . . . 29
2 Literature survey 31 2.1 Non-model based ABE approaches . . . 31
Contents
2.2 ABE approaches based on source-filter model . . . 32
2.2.1 Extension of spectral envelope . . . 32
2.2.2 Extension of excitation . . . 37
2.3 ABE approaches based on direct modelling of spectra . . . 39
2.4 End-to-end approaches to ABE . . . 40
2.5 ABE with modified loss functions . . . 41
2.6 Feature selection and memory inclusion for ABE . . . 42
2.6.1 Feature selection . . . 42
2.6.2 Memory inclusion . . . 43
2.7 Evaluation of speech quality . . . 44
2.7.1 Assessement of different ABE algorithms . . . 47
2.8 Approaches to super-wide bandwidth extension (SWBE) . . . 49
2.8.1 SWBE for audio signals (speech and music) . . . 49
2.8.2 SWBE for speech only . . . 50
2.9 Summary . . . 50
3 Baseline, databases and metrics 53 3.1 ABE algorithm . . . 53 3.1.1 Training . . . 55 3.1.2 Estimation . . . 56 3.1.3 Resynthesis . . . 59 3.2 Databases . . . 63 3.2.1 TIMIT . . . 63 3.2.2 TSP speech database . . . 64 3.2.3 CMU-Arctic database . . . 64 3.2.4 3GPP database . . . 65
3.3 Data pre-processing and distribution . . . 65
3.3.1 Data pre-processing . . . 65
3.3.2 Training, validation and test data . . . 66
3.4 Performance assessment . . . 66
3.4.1 Subjective assessment . . . 67
3.4.2 Objective assessment metrics . . . 67
3.4.3 Mutual information assessment . . . 69
4 ABE with explicit memory inclusion 71 4.1 Memory inclusion for ABE . . . 72
Contents
4.2 Brief overview of memory inclusion for ABE via delta features: Past
work . . . 73
4.2.1 Memory inclusion scenarios . . . 73
4.2.2 Highband certainty . . . 74
4.2.3 Analysis and results . . . 75
4.2.4 Discussion . . . 76
4.3 Assessing the benefit of explicit memory to ABE . . . 77
4.3.1 Analysis . . . 78
4.3.2 Findings . . . 80
4.3.3 Need for dimensionality reduction . . . 82
4.4 ABE with explicit memory inclusion . . . 84
4.4.1 Training . . . 84
4.4.2 Estimation . . . 85
4.4.3 Resynthesis . . . 85
4.5 Experimental setup and results . . . 85
4.5.1 Implementation details and baseline . . . 86
4.5.2 Objective assessment . . . 86
4.5.3 Subjective assessment . . . 88
4.5.4 Mutual information assessment . . . 88
4.5.5 Discussion . . . 89
4.6 Summary . . . 92
5 ABE with memory inclusion using semi-supervised stacked auto-encoders 93 5.1 Unsupervised dimensionality reduction . . . 94
5.1.1 Principal component analysis . . . 94
5.1.2 Stacked auto-encoders . . . 95
5.2 ABE using semi-supervised stacked auto-encoders . . . 99
5.2.1 Semi-supervised stacked auto-encoders . . . 100
5.2.2 Application to ABE . . . 101
5.3 Experimental setup . . . 102
5.3.1 SSAE training, configuration and optimisation . . . 102
5.3.2 Databases and metrics . . . 104
5.4 Results . . . 105
5.4.1 Speech quality assessment . . . 105
5.4.2 Mutual information assessment . . . 107
Contents
6 Latent representation learning for ABE 109
6.1 Variational auto-encoders . . . 110
6.1.1 Variational lower bound . . . 111
6.1.2 Reparameterisation trick . . . 112
6.1.3 Relation to conventional auto-encoders . . . 113
6.1.4 VAEs for real valued Gaussian data . . . 114
6.2 Conditional variational auto-encoders . . . 115
6.3 Application to ABE . . . 118
6.3.1 Motivation . . . 118
6.3.2 Extracting latent representations . . . 119
6.3.3 Direct estimation using CVAE-DNN . . . 122
6.4 Experimental setup and results . . . 122
6.4.1 CVAE configuration and training . . . 123
6.4.2 Analysis of weighting factor α . . . 124
6.4.3 Objective assessment . . . 126
6.4.4 Subjective assessment . . . 127
6.5 Summary . . . 129
7 Super-wide bandwidth extension 131 7.1 Motivation . . . 132
7.2 Past work . . . 132
7.3 Super-wide bandwidth extension (SWBE) . . . 133
7.3.1 High frequency component estimation . . . 134
7.3.2 Low frequency component upsampling . . . 134
7.3.3 Resynthesis . . . 135
7.4 Spectral envelope extension . . . 135
7.4.1 Effect of sampling frequency . . . 135
7.4.2 Extension . . . 137
7.4.3 Comparison . . . 138
7.5 Experimental setup and results . . . 139
7.5.1 Databases . . . 140
7.5.2 Data pre-processing . . . 140
7.5.3 Assessment and baseline algorithm . . . 141
7.5.4 Objective assessment . . . 142
7.5.5 Subjective assessment . . . 143
7.5.6 Discussion . . . 145
7.6 Summary . . . 146
Contents 8 Conclusions and future directions 147
8.1 Contributions and conclusions . . . 147 8.2 Future directions . . . 149
List of Abbreviations
1G 1st generation
2G 2nd generation
3G 3rd generation
3GPP 3rd Generation Partnership Project
3GPP2 3rd Generation Partnership Project 2
4G 4th generation
ABE artificial bandwidth extension
ACELP algebraic code-excited linear prediction
ACR absolute category rating
ADPCM adaptive differential pulse code modulation
AE auto-encoder
AM amplitude modulation
AMPS Advanced Mobile Telephone System
AMR adaptive multi-rate
AMR-WB adaptive multi-rate wideband
ASR automatic speech recognition
CCITT International Telegraph and Telephone Consultative Committee
List of Abbreviations
CDMA code division multiple access
CELP code-excited linear prediction
CGM conditional generative model
CI confidence interval
CMOS comparison mean opinion score
CS-ACELP conjugate-structure algebraic code-excited linear prediction
CVAE conditional variational auto-encoder
DCR degradation category rating
DFT discrete Fourier transform
DNN deep neural network
EFR enhanced full rate
ELBO evidence lower bound
ETSI European Telecommunications Standards Institute
EVS Enhanced voice services
FDMA Frequency Division Multiple Access
FFT fast Fourier transform
FM frequency modulation
FT Fourier transform
GMM Gaussian mixture model
GMMR Gaussian mixture model regression
GPU graphics processing unit
GSM Global System for Mobile
HB highband
HD high definition
List of Abbreviations
HF high frequency
HMM hidden Markov model
HPF highpass filter
IMT-2000 international mobile telecommunications-2000
IRS intermediate reference system
ISDN integrated services digital network
ITU International Telecommunication Union
ITU-T Telecommunication Standardization Sector of the International Telecommunication Union
kbps kilobits per second
KLT Karhunen–Loève transform
LDA linear discriminant analysis
LF low frequency
logMFE log-Mel filter energy
LP linear prediction
LPC linear predictive coding
LPF lowpass filter
LPS log power spectrum
LSD logarithmic spectral distortion
LSF line spectral frequency
MAP maximum a posteriori
MDCT modified discrete cosine transform
MFB Mel filterbank
List of Abbreviations
MI mutual information
ML maximum likelihood
MMSE minimum mean square error
MOS mean opinion score
MSIN mobile station input
MVN mean and variance normalisation
NB narrowband
NMT Nordic Mobile Telephone (NMT)
OLA overlap and add
PCA principal component analysis
PCM pulse code modulation
PDF probability density function
PESQ perceptual evaluation of speech quality
PGM probabilistic graphical model
PS power spectrum
PSTN public switched telephone network
RE reconstruction error
RMS root-mean-square
RPCA robust principal component analysis
RPE-LTP regular pulse excitation with long-term prediction (codec)
SAE stacked auto-encoder
SGD stochastic gradient descent
SGVB stochastic gradient variational Bayes (SGVB)
SLP selective linear prediction
List of Abbreviations
SNR signal-to-noise ratio
SSAE semi-supervised stacked auto-encoder
SWB super-wideband
SWBE superwide bandwidth extension
UMTS Universal Mobile Telecommunication System
VAE variational auto-encoder
VoIP voice over Internet Protocol
VQ vector quantisation
List of Figures
1.1 An evolution of mobile handsets with advancements in the cellular communication systems reproduced from [9]. . . 4
1.2 Model of human speech production mechanism (adapted from [10]). 6
1.3 An illustration of phone calls at different bandwidths at receiving mo-bile terminal (adapted from [60]). A NB far-end terminal transmits a NB signal through a NB network and the near-end-user receives (a) NB speech through a NB terminal, (b) artificially
bandwidth-extended speech through a NB terminal (with ABE), (c) artificially bandwidth-extended speech through a WB terminal (with ABE). A WB far-end terminal transmits speech in NB if either the network is NB or the receiver is a NB terminal; the user then receives (d) artificially bandwidth-extended speech if the terminal includes ABE. WB transmission is achieved only when (e) both the terminals and the network support WB. . . 21
1.4 Outline of the thesis and connections among various chapters. . . . 28
3.1 A block diagram of the baseline ABE system. A modified version of the ABE system presented in [78]. sNB
t denotes a NB speech frame at a sampling rate of 16kHz. . . 54
3.2 Illustration of concatenation of lowband (LB), narrowband (NB) and estimated highband (HB) power spectra to obtain the estimated wideband (WB) power spectrum PtWB(k) calculated according to Eq. 3.10 for 1024-point FFT. . . 58
List of Figures
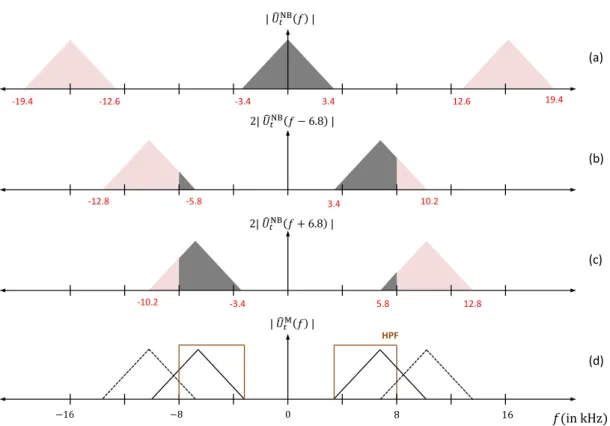
3.3 Illustration of excitation extension via spectral translation with mod-ulation frequency fm = 6.8kHz. Plot (a) represents the magnitude spectrum | ˆUNB
t (f )| of a narrowband (NB) speech frame ˆsNBk (at 16kHz) with a bandwidth of 3.4kHz. Plots (b) and (c) illustrate the translated copies of | ˆUNB
t (f )| after modulation with a cosine signal of frequency 6.8kHz. Plot (d) shows the magnitude spectrum of the resulting modulated frame to which a HPF is applied to extract the highband (HB) excitation components. . . 61
3.4 Data pre-processing protocol used for ABE. LA = level alignment to -26 dBov. MSIN = mobile station input filtering. . . 66
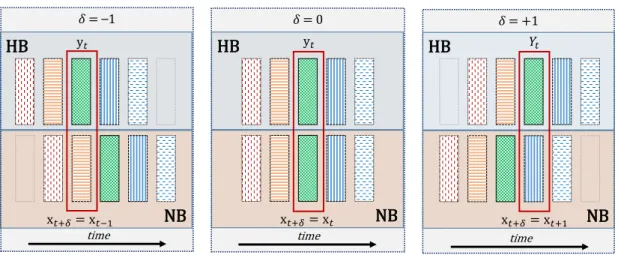
4.1 An Illustration of mutual information (MI) estimation with contex-tual information from neighbouring frames. Vertical bars represent NB (bottom) and HB (top) feature vectors. Red boxes represent the pair of NB (xt+δ, δ = −1, 0, 1) and HB (yt) components used for MI calculations. . . 79
4.2 An illustration of the variation in mutual information (MI) between static highband (HB) features yt and static narrowband (NB) fea-tures xt+δ, (blue profiles) extracted from neighbouring frames and delta features ∆xt,L (red profiles). . . 80
4.3 A block diagram of the artificial bandwidth extension (ABE) system with explicit memory inclusion. . . 83
4.4 A comparison of true wideband (WB) linear prediction (LP) gain
gWBtrueto estimated WB LP gain ˆgWB for ABE systems M2 and B1. A
comparison of corresponding speech spectrograms is shown in Fig 4.5. 90
4.5 A comparison of spectrograms of wideband (WB) speech signals
artificially bandwidth-extended using ABE systems (a) B1 and (b)
M2 to that of (c) original WB speech signal. The comparison is
shown for the utterance “Not surprisingly, this approach did not work” from the TIMIT test set. . . 90
5.1 The architecture of (a) an auto-encoder (AE) and (b) stacked (deep) auto-encoder (SAE). . . 96
5.2 A semi-supervised stacked auto-encoder (SSAE). . . 101
List of Figures
6.1 A variational auto-encoder (VAE) as a directed graphical model (adapted from [266]). Solid lines represent the generative model
pθ(x, z) = pθ(z)pθ(x|z) with parameters θ (shown in (a)). Dashed lines represent the inference of the true posterior pθ(z|x) performed via the variational approximation qφ(z|x) with parameters φ (shown in (b)). Dashed and solid lines alternately represent encoding and
decoding phases respectively. The shaded node represents the
ob-served variable x. The generative parameters θ and the variational parameters φ are jointly learned during optimisation. . . 110 6.2 An illustration of the variational auto-encoder (VAE) generative
model that learns a joint distribution pθ(x, z) = pθ(z)pθ(x|z). The latent space (with prior distribution p(z)) is inferred using the prob-abilistic encoder qφ(z|x), that approximates the true but intractable posterior pθ(z|x) of the generative model pθ(x, z). The latent space is mapped back to the input space using the probabilistic decoder
pθ(x|z). . . . 113 6.3 A conditional variational auto-encoder (CVAE) model as a
con-ditional directed graphical model. The solid lines represent the generative model pθ(y, z|x) = pθ(z)pθ(y|z, x) with parameters θ. The dashed lines represent the inference of the true posterior pθ(z|y) performed via the variational approximation qφ(z|y) with param-eters φ. The observed variables x and y are represented by the shaded nodes. . . 117 6.4 A feature extraction scheme using (a) VAE and (b) CVAE. . . 120
6.5 The proposed CVAE scheme as a conditional directed graphical
model. The solid lines represent the generative model pθ(y, zy|zx) = pθ(zy)pθ(y|zx, zy) with parameters θ. The dashed lines represent the
inference of the true posterior pθ(zy|y) performed via the variational
approximation qφ(zy|y) with parameters φ. The observed variables
x and y are represented by the shaded nodes. . . 121
6.6 A schematic of CVAE-DNN, a DNN formed using a CVAE with
stochastic layers zx and zy during (a) training (or reconstruction)
and (b) testing (or prediction) phases. . . . 124
7.1 A block diagram of the proposed approach to super-wide bandwidth extension (SWBE). . . 134
List of Figures
7.2 (a) Discrete-time processing of continuous-time signals. (b) Fre-quency response of the discrete-time system h[n]. (c) Corresponding
effective continuous-time frequency response for the bandlimited
input xc(t). Adapted from [278, Section 4.4]. . . 136 7.3 Illustration of the envelope extension process for an arbitrary voiced
speech frame. (a) wideband (WB) spectral envelope represented by the filter H(ω), (b) spectrum of residual component ewb[n], (c)
spectrum of the upsampled excitation component ˆeswb[n], (d) the
effective frequency response of the filter H(ω) for the input ˆeswb[n]. . 137
7.4 A comparison of spectral envelopes for an arbitrary unvoiced speech frame. (a) Spectral envelope profiles are shown for true WB (blue,
p = 16), true SWB (dashed-black, p = 32) speech frames with
stretched copy of WB envelope (red). Spectral envelopes (dashed-black profiles, p = 32) extracted from (b) true and (c) extended SWB speech frames are shown with spectra of respective speech frames (green profiles). . . 139 7.5 A comparison of spectral envelopes similar to that shown in Fig. 7.4
for an arbitrary voiced speech frame. . . 140 7.6 Protocol used for data pre-processing. LA = level alignment to -26
dBov. . . 141 7.7 An approach to efficient high-frequency bandwidth extension (EHBE) [208]142 7.8 Subjective test results in terms of CMOS for bandwidth extended
speech generated with the proposed (Prop) algorithm (A) versus either AMR-WB, EVS or EHBE processed speech (B). Each bar indicates the relative frequency that (blue bars) A was preferred to B (score>0), that (green bars) quality was indistinguishable (score=0), or that (red bars) B was preferred to A (score< 0). Scores illustrated to the top are CMOS points with corresponding CI95. . . 144
7.9 Spectrograms of a AMR-WB processed speech segment extended by the proposed algorithm (a) and the EHBE baseline (b) compared to true SWB speech (c). LF components (0-8kHz) in plots (a) and (b) are different than those in plot (c) due to AMR-WB processing. . . 145
List of Tables
4.1 Objective assessment results (with mean and standard deviation values). RMS-LSD and dCOSH are distance measures (lower values
indicate better performance) in dB whereas MOS-LQOWB values reflect quality (higher values indicate better performance). . . 87 4.2 Subjective assessment results in terms of CMOS (with corresponding
95% confidence interval (CI95)). . . 88
4.3 Mutual information assessment results. I(x; y) denotes the MI between features x and y. . . . 88
5.1 MSE for different SSAE configurations with either ReLU or tanh activation functions, with and without dropout (dr) and batch normalisation (bn) either after (a) or before (b) activation. dr value represents fraction (p) of randomly chosen hidden units being set to 0. Results are illustrated for the each SSAE configuration on training (T) and validation (V) datasets. . . 104
5.2 Objective performance metric results (with mean and standard
deviation values) for ABE system MSSAE_2. dRMS-LSD and dCOSH
are spectral distortion measures in dB (lower values indicate better performance) whereas MOS-LQOWB values reflect quality (higher values indicate better performance). . . 106 5.3 Objective assessment results for ABE system MSSAE_2 using log
power spectrum (LPS) inputs in place of log-Mel filter energy (logMFE). . . 106 5.4 Mutual information assessment results. I(x; y) denotes the MI
between features x and y. . . 106
6.1 Effect of weighing factor αcvaeon DKL and RE during both training (or reconstruction) and testing (or prediction) phases for CVAE-DNN.
List of Tables
6.2 Effect of weighing factor αvae and αcvae on RE in case of estimation
using GMMR. Results shown for the validation dataset. . . 126 6.3 Objective assessment results (with mean and standard deviation
values). RMS-LSD and dCOSH are distance measures (lower values
indicate better performance) in dB, whereas MOS-LQOWB values reflect quality (higher values indicate better performance). . . 128
6.4 Subjective assessment results for the ABE systems with CVAE,
SSAE + MVN and PCA dimensionality reduction techniques in terms of CMOS points with corresponding 95% confidence interval (CI95). . . 128
7.1 RMS-LSD results in dB (standard deviation). . . 143
Chapter 1
Introduction
The quality of speech offered by communication systems is highly dependent on the bandwidth of speech signals. Due to the bandwidth limitations imposed by communication systems, speech signals often lack higher frequency content and thus suffer from limited quality and intelligibility. Artificial bandwidth extension (ABE) algorithms have thus been developed to improve the quality of speech signals by artificially estimating the missing frequency components. Higher bandwidths lead to better, more comfortable conversations due to increased speech quality and intelligibility.
This thesis concerns the research topic of ABE for speech signals and its applications. This chapter provides an introduction to the topic. Section 1.1 provides a brief history on the evolution of telephony systems from analog to digital and from wired to wireless modes of communication. The speech production mechanism and physiology is discussed in Section 1.2 and describes different speech sounds and their spectral characteristics. The effect of bandwidth on speech quality and intelligibility is also explained. In Section 1.3 different types of speech coding methods (or codecs) based on their operational bandwidths are explained. Section 1.4 then introduces narrowband-to-widebandwith extension and its applications. Wideband-to-super-wide bandwidth extension is explained in Section 1.5. Sections 1.6 and 1.7 present contributions and an outline of this thesis respectively.
Chapter 1. Introduction
1.1
Evolution of communication systems
This section presents a brief overview of the evolution of communication systems from analog to digital and from wired to wireless modes of communication.
1.1.1
Analog and digital telephony
The transmission of the very first sentence “Mr. Watson, come here, I want to see you,” uttered by Graham Bell over an electric telephone in 1876 laid the foundation for enormous progress in communication systems [1]. This led to the installation of over 3000 telephones and the first public telephone exchange in the US by 1878 [2]. Different operators started providing telephone services, however, subscribers to different services could not communicate with each other. American Telephone and Telegraph (AT&T) started providing an universal service and an unified telephone network to subscribers, allowing them to make long-distance telephone calls by the 1950s [3, Section 1.2.4]. By then, the telephone networks, referred to as public switched telephone networks (PSTNs)1, were still analog utilizing frequency division
multiplexing (FDM). The speech signals, limited to a frequency range of 0.3-3.4Hz referred to as narrowband (NB), were transmitted over different frequency channels with a frequency separation of 4kHz. The narrowband limitation of transmission comes from the characteristics of the transducers and hardware (such as copper lines) employed in PSTNs2.
A demonstration of wireless the transmission of Morse code signals by Guglielmo Marconi in 1895 started parallel developments of radio communications. The first wireless voice transmission in 1915 signaled a start to the convergence of radio and telephony [3, Section 1.2.3]. In 1937, Alex Reeves conceived the idea of pulse code modulation (PCM) based on the time-division multiplexing principle [5]. The development of PCM marked the first step towards digitization for voice communications. Due to the invention of transistors, the commercial use of PCM was possible only in the late 1950s [6] when the era of digital transmission of speech over telephone networks started. In accordance with the then existing
1Also known as plain old telephone services (POTSs).
2The lower limit, i.e., 300Hz was chosen to decrease susceptibility to interference caused by
AC electric power lines. The analysis presented in [4] showed that a bandwidth of 3 or 3.1kHz provided good quality both in terms of articulation and naturalness. The suggested bandwidth was a economical choice to achieve desired transmission quality and thus the upper limit of the telephone band was set 3.4kHz.
1.1. Evolution of communication systems
PSTNs, PCM adopted the typical bandwidth of 0.3-3.4kHz3 for communication and therefore, for many years, subscribers were offered only NB communication services.
1.1.2
Wireless cellular networks
After Marconi’s successful attempt at wireless transmission, engineers and scientists started research on developing efficient means of communications using radio frequency (RF)/radio waves. The idea of cellular telephone systems started to be explored in the 1970s. The concept involved the division of a geographical area into adjacent, non-overlapping, hexagonal-shaped cells [3, Section 1.2.6]. In this scheme, all mobile units in a given cell could communicate via a transmitter and a receiver dedicated to each cell (referred to as the base station); communication (or handoff) between the units crossing cell boundaries was coordinated via a mobile switching station. The first generation (1G) wireless mobile phone system was developed by Martin Cooper at Motorola in 1973 but not commercialised until 1984. Wireless communications have progressed remarkably in last few decades. Mobile handsets have also advanced alongside the generations (from 1G to 4G) with added functionalities. An illustration of the typical mobile devices introduced in different generations is shown in Fig 1.1. As of today, current wireless mobile telephone systems can be divided into four generations.
The first generation cellular systems, introduced in the 1980s, used analogue cellular and cordless telephone technology. The cordless telephone was connected to PSTNs over radio. The Advanced Mobile Telephone System (AMPS) and Nordic Mobile Telephone (NMT) are notable examples of 1G analogue standards. A frequency division multiple access (FDMA) technique was utilised enabling multiple users to share the same frequency spectrum. Transmissions over radio were susceptible to eavesdropping and could be easily intercepted by a standard radio receiver [5, Section 1.4.1].
Second generation (2G) systems, introduced in the late 1980s, used digital
3In 1960s, the bandwidth of the PSTN was standardized by Consultative Committee for
International Telephony and Telegraphy (CCITT) to 0.3-3.4Hz. CCITT was later renamed to International Telecommunication Union for Telecommunication standardization sector (ITU-T). According to ITU-T Rec. G.120 [7] the attenuation in the NB should not exceed 9dB compared to the value for 1020Hz whereas the attenuation distortion at 0.3kHz and 3.4kHz should never exceed 3dB.
Chapter 1. Introduction
Figure 1.1: An evolution of mobile handsets with advancements in the cellular communication systems reproduced from [9].
speech transmission. These systems supported additional services such as voice mail, text transmission, speed dialing, roaming, etc. 2G systems used advanced coding and compression techniques to utilise the allocated spectrum more efficiently. Network-control techniques were improved to conserve bandwidth and privacy was improved to prevent eavesdropping [5, Section 1.4.2]. Widespread 2G standards are the Global System for Mobile communications (GSM), IS-136 and IS-954. 2G
services were designed specifically for voice transmission and were not efficient for data transmission [8, page 321].
Third-generation systems, introduced in the early 2000s, provide advanced voice and high-speed data services that could not be delivered via 2G technology. While data transmission is done via packet switching, voice is transmitted using circuit-switching technology. The most common 3G technologies are Universal Mobile Telecommunication System (UMTS) or wideband CDMA (WCDMA), time division-synchronous CDMA (TD-SCDMA) and CDMA2000. These are collectively referred to as International Mobile Telecommunications-2000 (IMT-2000) [8, page 324]. Most GSM operators upgraded (from 2G) to UMTS/WCDMA 3G services. Upgrades usually required changes to existing infrastructure in the form of more base stations and the replacement of time-division access by code-division access.
Fourth generation (4G) systems employ an all-internet packet infrastructure
4The standards IS-136 and IS-95 employ time-division multiple access (TDMA) and code
division multiple access (CDMA) techniques respectively
1.2. Speech production
that supports data rates of 100Mbps. Packet switching technology is used for both voice as well as data. Worldwide Interoperability for Microwave Access 2 (WiMAX 2) and Long-Term Evolution Advanced (LTE-Advanced) are the two popular 4G protocols, also referred to together as IMT advanced [8, page 332].
1.2
Speech production
A study of the underlying anatomy and physiology of the human speech production system provides useful insights in order to analyse different acoustic as well as articulatory properties of speech signals. These properties help to understand spectral and temporal characteristics of various speech sounds. A model of the human speech production system is illustrated in Fig. 1.2. A speech signal is produced by a speaker at his/her mouth or lips in the form of pressure waves. The organs that are involved in the speech production mechanism are: the lungs, larynx and vocal tract. The lungs produce an airflow which is modulated by vocal
chords or vocal folds of the larynx. The airflow passing through the glottis – a
slit-like orifice between the two vocal folds – is converted to either a quasi-periodic or noisy airflow by vibration of the vocal folds. The resultant airflow source excites the vocal tract that comprises oral, nasal and pharynx cavities. The vocal tract performs spectral shaping or colouring of the excitation source. The subsequent variation of air pressure at the lips is radiated in the form of travelling waves called speech [10, Section 3.1]. Speech signals can be seen as the output of a filtering operation in which the vocal tract system (or filter) is excited by the modulation of an excitation source or airflow. The mechanism is typically known as the source-filter model of speech production which allows the modelling of speech signals as a convolution of the impulse response of the vocal tract filter5 and the
excitation source (also referred to as glottal flow).
Speech is a non-stationary signal consisting of different speech sounds, each of which is characterised by a distinct position of the vocal tract articulators (vocal folds, tongue, lips, teeth, velum, jaw) [11, Section 3.1]. Speech sounds are,
therefore classified according to: the nature of the excitation source (which is mainly categorised as periodic, noisy, impulsive or combinations of the three) and the shape
5The vocal tract can be modelled as a linear time-invariant filter which exhibits resonance
frequencies, typically known as formant frequencies or formants. Generally vocal tract takes form an all-pole filter – the approach referred to as linear prediction analysis – where the conjugate poles represent the formants.
Chapter 1. Introduction Larynx Lungs Nasal Cavity Oral Cavity Pharynx Power supply Vocal Tract Periodic puffs Noise Impulse Modulator
~
Figure 1.2: Model of human speech production mechanism (adapted from [10]).
of the vocal tract (which can be described by the place and manner of articulation (or constriction) in the vocal tract) [10, Section 3.4]. This section provides a brief overview of different speech sounds, their spectral characteristics and how the bandwidth limitations imposed by telephone filter results in intelligibility and quality.
1.2.1
Speech sounds
Speech sounds are broadly divided into two categories: vowels and consonants.
Vowels form the largest group of phonemes. The characteristics of vowels
differ based on the position of the tongue – that mainly determine the vocal tract shape – towards the front, centre or back of the oral cavity. Each vowel phoneme thus corresponds to an unique, stable vocal tract configuration during most of the sound generation. The excitation source has quasi-periodic nature which is generated by vibration of the vocal folds at a certain fundamental frequency (also knowns as pitch frequency or pitch).
Consonants form the second largest group of phonemes which are
sub-categorised into nasals, plosives, fricatives, whispers and affricates.
1.2. Speech production
• Nasals or murmurs are closest to vowels and are produced at the nostrils by the quasi-periodic airflow only through the nasal cavity; the oral cavity remains constricted. Depending upon the place of constriction that is formed by the tongue across the oral cavity, nasals are distinguished, e.g. /m/ as in “mo” and /n/ as in “no”.
• Fricatives are of two types. Unvoiced fricatives (e.g., /sh/ in “should”) are characterised by a noise source generated due to turbulent airflow near the vocal tract constriction. The noise source is spectrally shaped depending upon the location and the degree of constriction formed by the tongue at the teeth or lips or along the oral cavity. In contrast, voiced fricatives (e.g. /z/ as in “zebra”) are generated by the simultaneous generation of noise at the constriction and vibration of the vocal folds. These sounds thus are formed by a combination of a noisy and periodic airflow.
• During production of plosive or stop sounds, the air pressure is first built up due to closure of the oral cavity. The pressure is then released over a very short duration. This results in a burst or impulsive source that excites the vocal tract at the constriction. In unvoiced plosives (e.g., /k/ in “baker”), the burst is followed by aspiration6 caused by turbulence at the open vocal folds. In voiced plosives (e.g., /g/ in “go”) there is little or no aspiration as the vocal folds are also vibrating.
• Whisper sounds are similar to unvoiced fricatives, however, the turbulence occurs at the glottis rather than at a vocal tract construction, e.g, /h/ as in “he”. The size of the glottis influences the spectral characteristics of whisper
sounds.
There is another category of phones which represents transitional speech sounds. These are associated with changes or transitions during movement of articulators from one position to another. Such sounds are “non stationary” and are associated with the rapid spectral changes during transition between two articulatory states corresponding to two different sounds. This phenomenon is known as coarticulation.
• Diphthongs are produced by vibrating vocal folds similar to vowels, however, the vocal tract does not remain steady (as in vowels) but varies smoothly
6Aspiration is caused due to turbulence of the glottal airflow at the glottis when the vocal
folds are open. The vocal folds do not vibrate, or remain fixed partly or completely leading to whispered and breathy voice respectively [10, page 64].
Chapter 1. Introduction
between two vowel configurations. Diphthongs are thus characterised by formant transitions as the vocal tract articulation changes gradually between two vowel positions. The examples of diphthongs are /Y/ as in “hide”, /W/ as in “out”, /O/ as in “boy” and /JU/ as in “new”.
• Semi-vowels or sonorants are categorised into glides and liquids. Glides (e.g., /w/ as in “we” and /y/ in “you”) are dynamic and transitional sounds that often occur before a vowel or between vowels. In the later case, they are similar to diphthongs, however the constriction of the oral tract is narrower and the transition between two vowels in quicker than in diphthongs. Thus glides are characterised with faster formant transitions and weaker articulation.
Liquids (e.g. /r/ as in “read” and /l/ as in “let”) exhibit different types of
constriction formed by the tongue than in glides.
• Affricates are the sounds representing transitions from plosives to fricatives, e.g., affricate /tS/ as in “chew” representing a transition from the plosive /t/ to the fricative /S/.
1.2.2
Spectral characteristics of speech sounds
Different speech sounds are characterised by different temporal and spectral char-acteristics. They can be distinguished from each other based upon their acoustic properties such as rapid transitions in spectral content, abrupt changes in amplitude, presence or lack or combination of voicing and aspiration and, the spectral shape attributed to the vocal tract configuration [12]. The spectral content of speech sounds is mainly dependant upon the nature of the glottal airflow or excitation source and the shape of the vocal tract7. Based on their spectral properties, speech
sounds can be classified into voiced and unvoiced sounds.
• The voiced sounds are the result of excitation of the vocal tract by a quasi-periodic glottal airflow. They are characterised by a quasi-quasi-periodic time-domain waveform with large variations in amplitude. The periodicity is measured in terms of the pitch period. The magnitude spectra of voiced sounds thus exhibit harmonic structure with peaks at integer multiples of the fundamental frequency or pitch, especially in the lower frequency region. The
7The shape of the vocal tract is defined by the place (or manner) of constriction (also referred
to as articulation.
1.2. Speech production
spectral envelope (smoothed version of the speech spectrum) is characterised by the presence of peaks which correspond to formants of the vocal tract filter.
Vowels and diphthongs (except when whispered) are mainly voiced sounds which ranging from 50 to 400 ms duration in normal speech. While vowels exhibit line spectra with energy concentrated at multiples of F0, the spectra primarily are characterised by the first three formants: F1, F2 and F3. They occur on average every 1kHz for adult males [11, Section 3.4.2].
Voiced sounds generally have low-pass characteristics and most of the energy is concentrated in the lower part (below 1kHz) of the audio spectrum. Thus, a significant portion of the voiced spectrum is covered adequately by NB or telephone speech despite the bandwidth limitations. While the fundamental frequency might be missing, the human ear is nonetheless capable of hearing pitch properly [13, Section 2.2.1].
• Unvoiced sounds are characterised by time domain waveforms with relatively lower amplitude than voiced sounds, however, with rapid variations due to noise-like nature of the excitation source. Thus, the spectrum of unvoiced speech extends over the entire audio spectrum. Unvoiced sounds contain significant energy above 3.4kHz and thus a larger portion of information is missing in NB speech signals.
Fricatives fall into the category of unvoiced sounds. Fricatives are char-acterised by a lack of energy at lower frequencies. They have a highpass spectrum and therefore, most of the energy is concentrated above 2.5-3.2kHz frequency region.
1.2.3
Effect of bandwidth on speech quality and
intelligi-bility
The choice of cut-off frequencies (0.3kHz and 3.4kHz) and characteristics of the telephone filter specified in ITU-T Rec. G.120 [7] was based on the bandwidth limitations imposed by analog transmission systems. The choices were motivated by results obtained from subjective listening tests [14, Section 10.1]. In order to retain compatibility with existing analogue PSTNs, initial progress in digital telephony have occurred with bandwidth constraints of 0.3-3.4kHz, e.g, the bandwidth of PCM. After digitisation of voice transmission, speech coding techniques were
Chapter 1. Introduction
developed in order to compress speech signals to lower bit rates than that in PCM, without degrading speech quality. Therefore, the bandwidth available for voice transmission was dictated by both the development of cellular systems and speech coding techniques. However, the frequency content of speech signals range from 60Hz to 20kHz. The limitations upon the telephone bandwidth thus result in a lack of distinctive spectral properties of speech sounds.
Some fricatives such as /f/ and /s/ differ in the location of the lowest spectral peak, which occur typically around 2.5kHz and 4kHz for a male adult speaker respectively. Such distinctive properties are lost in typical telephone speech, which often causes troubles to the listener in distinguishing between different fricative sounds [15, 1.1.3.1]. Some plosives (/t/ and /d/) are characterised by higher energy bursts occurring around 3.9kHz. Others (/b/, /p/) also exhibit similar energy bursts albeit with less intensity. These distinct properties are lost in NB speech, once again leading to reduced intelligibility and naturalness for plosives. Nasals are too affected. They are dominated by the first formant F1 which typically occurs around 250Hz. This is also lost due to the lower cut-off of the telephone band.
Due to the loss of such important information, the intelligibility of syllables can be degraded. During a telephone call, sometimes high frequency sounds such as /f/ and /s/ (or /p/ and /t/) are thus difficult to differentiate and, in the absence of informative contextual information, must be spelled out for effective communications. Improvements in intelligibility are thus necessary to reduce the listening effort, in order to provide comfortable communications [16].
The perceived quality as well as the intelligibility of speech signals increases with increases in acoustic bandwidth, particularly for unvoiced sounds. This is because they contain a substantial portion of their spectral content above 3.4kHz. A transition from NB to WB communication then naturally leads to an increase in syllable and sentence intelligibility from 90% and 99.3% to 98% and 99.9% respectively [16,17]. The speech quality is also improved by 1.42 MOS points [17]. The quality of communication is further improved at super-wide bandwidths.
Even though intelligibility relates to the recognisability of speech sounds, speech quality measures are mainly used to evaluate the performance of speech codecs in transmission systems. Similarly, ABE algorithms are also evaluated in terms of speech quality by using either subjective or objective measures.
1.3. Speech coding
1.3
Speech coding
Speech coding or speech compression algorithms have the goal of estimating the
compact digital representations of analogue voice signals for their efficient storage and transmission [18]. In the 1990s, the increased number of mobile phones and the increase in demands to mobile communications brought new challenges for digital speech transmission systems, especially regarding the limitations of bandwidth and its implications upon PCM speech quality [13, Chapter 1].
The digital transmission of speech involves the use of codecs in order to con-vert analogue signals into digital format. A codec consists of an encoder at the transmitter end that converts an analogue signal into compressed, digital bits. These bits can be transmitted over digital landlines or wireless networks. At the receiver, the digital bitstream is converted back to an analogue signal using a
decoder. Codecs are used in telephones, cellular networks, televisions, set-top boxes
and TV transmitters and receivers [8, page 18]. The purpose of speech coding is to compress data so that speech transmission can be performed at lower bit rates while maintaining high speech quality [19, Section 3.5]. Speech codecs should thus operate at low bit rates with low complexity and limited delay; these requirements are especially important in mobile communications considering the limited number of radio network resources and requirement for low power consumption in mobile, battery powered devices [14, Section 8.1], [19, Section 3.5].
Various speech coding standards and speech codecs have proposed in the past decades. They can be categorised in terms of their operational bandwidths.
1.3.1
Narrowband coding
Chapter 1. Introduction Pulse-code modulation (PCM)
PCM [20] is a simple waveform8 based coding method that performs discrete-time,
discrete-amplitude approximation of analog signals in the time domain. Signals are sampled at a sampling rate of 8kHz and quantised using non-uniform quantisation levels at 64kbps. PCM supports narrowband (0.3-3.4kHz) communication that is compatible with older analog telephone systems. The transmission characteristics of PCM for voice signals are standardised in ITU-Recs. G.711 [21] and G.712 [22]. PCM coding is widely used in PSTNs and mobile networks.
For economical and complexity reasons, higher bit rates (e.g., 64kbps employed with PCM) are reduced to between 4 and 32kbps in radio cellular systems such as cordless phones and cellular radio networks while maintaining similar narrowband speech quality of PCM. To achieve this, most coding algorithms are based on the source-filter model of speech production and also exploit properties of the human auditory system [14, Chapter 8].
An extension of PCM, known as adaptive differential PCM (ADPCM), stan-dardised in ITU-T Rec. G.726 [23], supports multiple bit rates of 16, 24, 32 and 40kbps. In ADPCM quantisation of residual error signal instead of the speech waveform itself is performed [24, Chapter 10]. ADPCM is typically used in cordless phones.
GSM full rate (FR) and enhanced full rate (EFR) codecs
The regular pulse excitation with long-term prediction (RPE-LTP) codec, also referred to as the GSM full rate (GSM-FR) codec, is based on linear predictive coding (LPC) which uses short-term LP analysis for spectral envelope modelling and long-term LP analysis to obtain residual error signal. The error signal is then quantised using ADPCM [24, Section 10.2]. The scheme operates at 13kbps and was adopted by ETSI in the GSM 6.10 standard (ETSI Rec. GSM 06.10 [25]) in
8Waveform coding methods aim to achieve lower bit rates through quantisation of either speech
signal itself or residual error obtained via linear prediction (LP) analysis (e.g, PCM, ADPCM).
Parametric coders (also called vocoders), e.g., linear predictive coding (LPC) vocoder, encode a
set of model parameters instead of the time domain waveforms. These parameters represent the vocal tract system configuration, e.g., LP coefficients. While sufficient intelligibility is achieved at lower bit rates, produced speech still sounds synthetic. Hybrid methods exploit advantages of both the schemes; coefficients of the synthesis filter are transmitted as side information whereas quantisation of LP residual error signal is performed, e.g., code-excited linear prediction (CELP) coding [14, Section 8.1]
1.3. Speech coding
1992 for digital mobile radio communications.
GSM-FR was further improved using an efficient vector quantisation technique for residual error signal using algebraic code-excited LP (ACELP) algorithm [26,27]. It was standardised as the GSM enhanced full rate (GSM-EFR) codec in ETSI Rec. GSM 06.60 [28] in 1996 and operates at 12.2kbps. The GSM-EFR codec achieved speech quality equivalent to that of ADPCM at 32kbps [14, Section 8.5.3.3].
G.729
The codec standardised in ITU-T Rec. G.729 [29] in 1995 operates at 8kbps and is based on so-called conjugate-structure ACELP (CS-ACELP). It is widely used in VOIP infrastructures.
Adaptive mulit-rate (AMR)
An extension of the EFR codec with eight possible bit rates ranging from 4.75 to 12.2 kbps, known as the AMR codec, was standardised for GSM (2G) and UMTS networks (3G) by ETSI (ETSI Rec. GSM 06.90 [30]). The quality at the highest bit rate is equivalent to that of the EFR codec. 3GPP adopted AMR as the default speech codec for 3G wideband systems such as UMTS and CDMA2000 (3GPP TS 26.090 [31]). AMR coding involves the transcoding of AMR-coded speech signals to/from PCM format [32]. Signals are thus encoded and decoded twice in succession which leads to added complexity and reduced speech quality.
1.3.2
Wideband coding
In order to support wideband transmission in telephone networks (at least) new terminals need to include front-ends with better electro-acoustic, improved analogue to digital (A/D) converters and new speech codecs. Cellular radio networks also need expensive base station modifications [14, Section 10.1]. As WB transmission improves the quality of voice transmission, there is increasing demand for WB communication services in fixed and mobile networks at lower bits rates. WB coding aims at voice communication at broader bandwidths of 0.05-7kHz.
Chapter 1. Introduction
in 1985 by CCITT [14, Section 10.1]. The ITU-T Rec. G.722 [33] specifies the characteristics of an audio WB coding system in which a frequency band is split into two, lower and higher, sub-bands such that both are encoded using ADPCM (the technique referred to as sub-band ADPCM (SB-ADPCM)). The codec supports bit rates of 4, 56 and 64 kbps and a fall-back capability to NB standards. The G.722 standard is usually used as a reference for the evaluation of other codecs [24, Appendix C]. In 1999, a low-complexity WB codec was introduced in ITU-T Rec G.722.1 [34] for hands-free applications. It achieved comparable speech quality at reduced bit rates of 24 and 32 kbps.
Adaptive multi-rate wideband (AMR-WB)
The breakthrough in WB speech coding and quality was brought by a wideband extension to the AMR codec, referred to as AMR-WB, which encodes speech within bandwidth of 0.05-7kHz. The AMR-WB codec was first standardised in 2001 by 3GPP (3GPP TS 26.190 [35]) for 3G cellular networks. It is based on the ACELP technique and employs artificial bandwidth extension for signal resynthesis beyond 6.4kHz. It is also adopted by ITU-T for WB speech coding and is specified in ITU-T Rec. G.722.2 [36]. It supports nine bit rates ranging from 6.6 to 23.85 kbps. The AMR-WB codec operating at 8.85 kbps achieves higher speech quality than AMR at 12.2kbps [37].
Voice transmission by AMR-WB provides significantly better quality than NB telephony due to the increased bandwidth. Therefore, conversations are more natural, thereby improving the user experience. AMR-WB technology is generally referred to as high-definition (HD) voice. HD voice also improves hearing in noisy environment. By May, 2016, 164 mobile operators (17 on GSM (2G), 130 on UMTS (3G) and 63 on LTE (4G) networks)9 have launched commercial HD voice services
in 88 countries [32]. HD voice services work best when two HD mobile phones are in communication over a HD-voice compatible network. Improved acoustic properties and noise reduction capabilities of the most recent HD smart phones also improve call quality.
The transmission of WB voice over GSM or UMTS networks needs tandem-free (TFO) or transcoder-free operation (TrFO). In TFO, the coded WB parameters are transmitted within the PCM bitstream to achieve WB speech quality. However,
9Some operators offer HD voice service on more than one network.
1.3. Speech coding
this requires a bit rate of 64kbps. In TrFO, double encoding can be avoided when the end-to-end transmission links both employ the same type of codec [13, Section 3.4]. Therefore, the combination of TFO and TrFO operations makes WB calls possible between all types of network.
The transmission of voice packets over LTE networks is referred to as voice over LTE (VoLTE). LTE systems, being all-IP and optimised specifically for data transfer, do not support circuit switching which is needed for voice and SMS services. Voice calls are thus handled using circuit switched fall back (CSFB) when the data connection “falls back” to 2G or 3G network connection before call initiation [32].
G.729.1
ITU-T Rec. G.729.1 [38] defines an extension to the G.729 codec providing for the scalable narrowband and wideband coding of speech and audio signals from 8-32kbps. G729.1 is the first layered10 codec that is designed with an embedded
scalable structure in order to extend the functionalities of the existing G.729 standard [39, Section 4.2.1.1].
1.3.3
Super-wideband or full band coding
SWB or FB voice communications, also referred to as full HD voice services, transmit almost the entire human voice spectrum which makes conversations much more natural and understandable than in the case of NB or WB communications. Full HD voice thus improves the call experience beyond that obtained by HD voice services, bringing quality closer to what is achieved in face-to-face conversations.
10Before G.729.1, the WB codecs did not extend the operation of existing NB codecs. Such
extension requires, (i) detection of bandwidth of an incoming signal before encoding and (ii) the interoperability among various mobile networks and devices (which support different coding standards). Layered extension of existing codecs provides these features. In layered coding, the core layer of a codec is overlaid with multiple enhancement layers, e.g, the core layer is designed for NB coding whereas the enhancement layers provide more improvements at the cost of additional bit rate. Such scheme provides the features of bandwidth scalability [39, Section 4.1.2].
Chapter 1. Introduction G.729.1 Annex E
G.729.1 Annex E [40] extends the 32kbps mode of the G.729 codec to super-wideband mode providing bit rates in the range of 36-64kbps. The codec uses MDCT coding. A SWB extension to the scalable WB codec G.729.1 proposed in [41] achieves improved audio quality (especially for music signals) in comparison to the existing SWB extension G.722.1 Annex E with ≈ 18% reduction in bitrate.
Extended AMR-WB (AMR-WB+)
The AMR-WB+ standard (3GPP TS 26.290 [42]) is an super-wide extension to the AMR-WB codec that operates up to an increased frequency range of 16kHz and bit rates up to 32kbps [14, Section 10.1]. It is a hybrid codec that combines linear predictive and transform coding techniques depending on the signal type, e.g., speech or audio. AMR-WB+ provides high quality for audio or music signals while meeting the strict requirements for multimedia codec bit rates and complexity [43].
G.719
A low-complexity coding algorithm for full-band speech and audio signals is de-scribed in ITU-T Rec. G.719 [44]. The coding technique offers bitrates from 32 up to 128 kbps.
HE-AAC
The high-efficiency advanced audio codec (HE-AAC) uses a so-called spectral band replication (SBR) [45,46] approach for efficient coding of audio signals. HE-AAC was developed by the International Organization for Standardization/International Electrotechnical Commission (ISO/IEC) Moving Picture Experts Group (MPEG) by subsequent extension of the established Advanced Audio Coding (AAC) archi-tecture [47]. The SBR technique exploits properties of the human auditory system – that the higher frequencies in audio spectrum contribute marginally to perception – and it is mainly focused on generic audio (speech and music) signals. The audio content above 8kHz can thus be encoded efficiently to achieve higher compression rates. HE-AAC is employed in mobiles, internet streaming, TV digital radio and TV broadcasting mainly for music and audio content [47].
1.3. Speech coding Over the top (OTT) conversational codecs
Over the top (OTT) service providers (e.g., Skype) provide point-to-point services for VoIP. The use of proprietary codecs such as SiLK allows for conventional NB voice services to be shifted towards WB and SWB communications via the use of broadband IP services [48].
Opus11 is another high quality codec which combines technologies from Skype’s SilK and Xiph.Org’s CELT12 audio codecs, providing bit rates of 6 kbps (for NB
mono speech) to 510 kbps (for high quality stereo music). It was standardised by the Internet Engineering task force (IETF). It is used for interactive speech and music transmission (supporting audio bandwidth from NB to FB) over the Internet. Opus performs hybrid coding which involves the coding of frequencies up to 8kHz using the SiLK codec. Frequencies above 8kHz are coded using CELT [39, 4.2.2.1]. Opus provides SWB or FB transmission at, and above 24 kbps. Unfortunately, however, the bit rate is too high for efficient use of radio resources for speech and audio in mobile systems [48].
Enhanced voice services
3GPP carried out a preliminary study [49] in 2010 in order to investigate use-cases of enhanced voice services (EVS) over the packet system of LTE networks. The study further led to the standardisation of the EVS codec in 2014. EVS is the first conversational (low delay) codec that can encode speech as well as other audio signals with a SWB (0.05-14kHz) at bit rates as low as 9.6kbps [39, 4.2.3]. It operates at four different bandwidths, namely, NB (0.02-4kHz), WB (0.05-7kHz), SWB (0.05-16kHz) and FB (0.05-20kHz)13. The key features of EVS include: (i)
enhanced quality for mixed signal content such as speech as well as music leading to improved user experience via features such as in-call music; (ii) improved coding efficiency for NB and WB communications thereby providing better quality than existing AMR and AMR-WB codecs at similar bit rates; (iii) backward compatibility to the AMR and AMR-WB codecs; (iv) improved robustness to packet loss, frame erasures and jitter [48]. EVS supports twelve bit rates ranging from 5.9 to 128 kbps with SWB and FB services starting at or above 9.6 and 16.4kbps respectively [48].
11http://www.opus-codec.org/
12Constrained Energy Lapped Transform
13The quality offered by the use of these bandwidths is equivalent to that of NB telephones,
Chapter 1. Introduction
EVS combines LPC for speech and modified discrete cosine transform (MDCT) based coding for audio signals. It switches automatically between these two coding modes in real time depending upon the type of signal. Subjective listening tests have shown that EVS outperforms all existing conversational voice and audio codecs across all bit rates and bandwidths [50]. Detailed technical details of EVS can be found in [51,52,53,54].
Due to the key features that the EVS codec provides, mobile operators have started enabling their networks for EVS support. As of September 2018, 17 mobile operators have already introduced EVS services in their networks; 153 EVS-enabled mobile devices from 12 different vendors are available in the market [55]. EVS services are also marketed as “HD voice plus” or “ultra HD voice”. While deployment of EVS codec enabled devices and networks is speeding up, there is a long way to go before it becomes a ubiquitous technology [55].
1.4
Artificial bandwidth extension
Artificial bandwidth extension algorithms have been developed to improve NB
speech quality by estimating missing highband (HB) components at 3.4-8kHz from available NB components. ABE is based on the assumption that spectral content in NB and HB are correlated as the entire speech spectrum is generated by the same physical and acoustical configuration of the human speech production system. ABE can be performed with or without the use of an additional side information for reconstruction of HB components and thus categorised into blind and non-blind methods.
1.4.1
Non-blind methods
HB frequency components are highly correlated with NB components but contain relatively little information [39, Section 4.1.4.5]. The spectral content at higher frequencies thus can be represented with fewer bits in comparison to NB fre-quency components. Non-blind ABE methods thus recover missing high frefre-quency components at the receiving-end (or near-end) from auxiliary side information related to higher frequencies which is encoded into a data stream together with NB components. However, the inclusion of such side information typically incurs an additional burden of 1-5 kbps [56]. Non-blind approaches are codec specific and
1.4. Artificial bandwidth extension
require a matching decoder in order to recover missing frequency components.
Most speech coding techniques, therefore, usually perform non-blind ABE in order to achieve lower bit rates while maintaining speech quality. Notable examples are Qualcomm’s enhanced AMR (eAMR) codec [57], the HE-AAC codec [45,46], and the AMR-WB codec (in 23.85 kbps mode) [31].
1.4.2
Blind methods
In contrast, blind ABE methods estimate missing HB components using only the available NB components. Such ABE14 solutions thus exploit the correlation
between NB and HB components of speech and estimate missing HB components using a regression model learned from WB speech training data. ABE algorithms thus mainly focus on the better modelling of correlation via improved regression models. In contrast to non-blind alternatives, blind methods do not incur any additional bit-rate burden and are codec-neutral.
While non-blind methods (typically employed in speech coders) provide better WB speech quality (which is quite obvious because the HB information is recon-structed via some side-information), blind methods provide an alternative to WB speech coding where WB speech at the receiver is reconstructed using the input NB speech only. WB services can thus be provided independently of networks and codecs used in mobile devices.
1.4.3
Motivation and applications
This section describes the applications of ABE in different scenarios.
When network and/or mobile terminals do not support WB communi-cation:
As discussed in the previous section, in order to improve speech quality offered by traditional telephony infrastructure, speech signals should be transmitted at higher bandwidths. This requirement has led to the development of coding techniques
14The term ABE refers to blind ABE unless mentioned explicitly throughout the remainder of
Chapter 1. Introduction
to compress information at higher bandwidths (Section 1.3). Calls at higher-bandwidths are possible only if the entire communication path supports operations at the same bandwidths, e.g. the WB call at the receiving terminal (or near-end) is possible only if the mobile device at the transmitting terminal (or far-end) and the network both support WB communication. Lack of either leads to a reduction in bandwidth and thereby a reduction in speech quality.
In today’s scenario, telecommunications involve a combination or intercon-nection of different networks and mobile devices supporting NB, WB and SWB communications15. This is because the entire processing chain that exists between
speech codecs and the network terminals requires a complete redesign to support higher bandwidth communications [58]. While deployment of WB codecs and networks is in progress, it is slow as it incurs costs to the network operators as well as end users. Additionally, a phone call may involve a landline device which restricts in the bandwidth to NB by default. Therefore, even today, a significant portion of calls operate in NB mode whereas the migration to WB will take considerable time [59]. NB and WB networks and devices (or terminals) will thus coexist for some years to come, leading to mobile phone calls of different bandwidths at the receiving terminal. An illustration of hybrid NB and WB phone calls is shown in Fig 1.3. The scenarios illustrated in Fig. 1(b), Fig. 1(c) and Fig. 1(d) exploit the potential of ABE to improve speech quality from NB to WB, provided the receiving terminal supports ABE functionality [60].
When a WB-to-NB handover occurs during a phone call:
Due to the presence of heterogeneous communication networks [61], the process of bandwidth switching from WB to NB may occur during an ongoing phone call, especially when the user is moving (e.g., in train, bus or car). This may happen either due to handovers between two different networks (e.g. when the user enters a network cell supporting NB communication from a WB network) or due to decreases in network resources that causes dynamic fall back from WB to NB mode [62,63]. This can lead to abrupt changes in quality and thus an annoying user experience. According to [60], a WB-to-NB handover leads to perceived speech quality even below NB.
A possible solution to avoid this problem is to switch to WB communication
15Typically the NB, WB and SWB calls involve the AMR, AMR-WB and EVS codecs.
1.4. Artificial bandwidth extension (a) (b) (c) (d) (e) far-end terminal network near-end terminal
Figure 1.3: An illustration of phone calls at different bandwidths at receiving mobile terminal (adapted from [60]). A NB far-end terminal transmits a NB signal through a NB network and the near-end-user receives (a) NB speech through a NB terminal, (b) artificially bandwidth-extended speech through a NB terminal (with ABE), (c) artificially bandwidth-extended speech through a WB terminal (with ABE). A WB far-end terminal transmits speech in NB if either the network is NB or the receiver is a NB terminal; the user then receives (d) artificially bandwidth-extended speech if the terminal includes ABE. WB transmission is achieved only when (e) both the terminals and the network support WB.
![Figure 1.1: An evolution of mobile handsets with advancements in the cellular communication systems reproduced from [9].](https://thumb-eu.123doks.com/thumbv2/123doknet/14720328.751047/27.892.210.639.150.425/figure-evolution-handsets-advancements-cellular-communication-systems-reproduced.webp)
![Figure 1.2: Model of human speech production mechanism (adapted from [10]).](https://thumb-eu.123doks.com/thumbv2/123doknet/14720328.751047/29.892.123.732.150.500/figure-model-human-speech-production-mechanism-adapted.webp)
![Figure 1.3: An illustration of phone calls at different bandwidths at receiving mobile terminal (adapted from [60])](https://thumb-eu.123doks.com/thumbv2/123doknet/14720328.751047/44.892.224.737.152.836/figure-illustration-different-bandwidths-receiving-mobile-terminal-adapted.webp)