HAL Id: hal-02321699
https://hal.archives-ouvertes.fr/hal-02321699
Submitted on 21 Oct 2019
HAL is a multi-disciplinary open access
archive for the deposit and dissemination of
sci-entific research documents, whether they are
pub-lished or not. The documents may come from
teaching and research institutions in France or
abroad, or from public or private research centers.
L’archive ouverte pluridisciplinaire HAL, est
destinée au dépôt et à la diffusion de documents
scientifiques de niveau recherche, publiés ou non,
émanant des établissements d’enseignement et de
recherche français ou étrangers, des laboratoires
publics ou privés.
Light-induced High-spin State in ZnO Nanoparticles
Adrien Savoyant, M Rollo, M. Texier, R. Adam, S. Bernardini, O. Pilone, O.
Margeat, O Nur, M Willander, S. Bertaina
To cite this version:
Adrien Savoyant, M Rollo, M. Texier, R. Adam, S. Bernardini, et al.. Light-induced High-spin State
in ZnO Nanoparticles. Nanotechnology, Institute of Physics, 2019, �10.1088/1361-6528/ab57f1�.
�hal-02321699�
Light-induced High-spin State in ZnO Nanoparticles
A. Savoyant,1 M. Rollo,1 M. Texier,1 R. E. Adam,2 S. Bernardini,1
O. Pilone,1 O. Margeat,3 O. Nur,2 M. Willander,2 and S. Bertaina1
1
Aix Marseille Univ, Universit´e de Toulon, CNRS, IM2NP, Marseille, France
2
Department of Science and Technology (ITN), Link¨oping University, SE-601 74 Norrk¨oping, Sweden
3
Aix Marseille Univ, CNRS, CINAM, Marseille, France
The effects of white-light irradiation on ∼ 20 nm diameter ZnO nanoparticles are investigated by means of electron paramagnetic resonance, near liquid-nitrogen and liquid-helium temperatures. Under dark conditions, usual core- and surface-defects are detected, respectively at g = 1.960 and g = 2.003. Under white-light illumination, the core-defect signal intensity is strongly increased, which is to be correlated to the light-induced conductivity’s augmentation. Beside, a four-lines structure appears, with the same gravity center as that of the surface defects. Simulations and in-tensity power-dependence measurements show that this four-line-structure is very likely to arise from a localized high spin S = 2, induced by light irradiation, and subjected to a weak axial anisotropy. At 85 K, this high-spin state can last several hours after the light-irradiation removal, probably due to highly spin-forbidden recombination process. The possible excited resonant complexes at the origin of this signal are discussed. Other light-induced S = 1/2-like centers are detected as well, which depends on the nanoparticles growth conditions.
PACS numbers: 32.30.Dx, 32.80.Fb, 75.75.-c, 76.30.-v
I. INTRODUCTION
Zinc Oxide (ZnO) is an extensively studied metal oxide semiconductor, due to its remarkable physical properties1. It is a n-type wurtzite
semiconductor with a direct bandgap of about 3.37 eV at room temperature and relatively large exciton binding energy of 60 meV. Naturally present in abundance, non toxic and of low cost, ZnO material is widely used in electronic and optoelectronic due to its high electron mobility2,
photoelectric response3, excellent chemical and
thermal stability4,5, piezoelectric applications6,
gas sensors7–9, light emitting diode10,11, and so
on.
From the physical point of view, one of the most striking characteristic of ZnO is its strong interaction with light, resulting in photo-induced effets, such as photo-conductivity12,13,
photo-catalysis14–17 and photo-luminescence18,19. All
of these effects are mainly driven by excitonic and point-defects related properties, as well as coupling of both20–24. In nanosized ZnO systems,
these photo-induced effects can be affected by the important surface-to-volume ratio, and/or by the presence of specific point-defects acting for example as new recombination or charge donor/acceptor centers. The study of these size-induced defects is thus a matter of great interest for tailoring efficient nanostructured ZnO-based devices.
Electron paramagnetic resonance (EPR) is a tool of choice to study point defects. This technique has been used for more than fifty years for characterizing intrinsic and extrinsic
param-agnetic defects in bulk ZnO25–31. Regarding ZnO
nanostructures, EPR studies have shown that two major kinds of intrinsic paramagnetic defects are almost always present within, resonating at g = 1.960 and g = 2.003, and arising respectively from core- and shell-defects32–34. However, the
exact nature of these defects is still under debate. A mean of gaining insight into the EPR lines origin is to introduce an additional excitation during the experiment, such as an external electric field or an optical light beam. Indeed, the idea of applying a light irradiation during an EPR experiment goes back to the very early stage of its application on semiconductor materials, where light is likely to ionize point defects into intra-band-gap states35,36. Regarding ZnO materials,
most of these photo-EPR experiments have been performed on bulk single crystal37–39, showing in
particular the apparition of some angle-dependent lines, attributed to excited oxygen and zinc vacancies40. For ZnO nanostructures, the main
result of such an irradiation is to greatly increase the core-defect (g = 1.960) intensity and, to a lesser extent, that of the shell-defect (g = 2.003)41.
However, such photo-EPR studies have not been exhaustively performed onto ZnO nanoparticles (NPs), in particular regarding their size, growth method and morphology, all characteristics known to greatly influence the population of defects.
In this work, we report on photo-EPR ex-periment performed on two types of ZnO NPs, near liquid-helium and liquid-nitrogen tempera-tures. The main new feature observed here is a four-line structure whose gravity center is that of the shell-defect (SD), g = 2.003, reversibly in-duced by white light irradiation. Microwave (MW)
2
power-dependence study near liquid and helium temperature reveals sub-structures of this four-line group, as well as other photo-induced S = 1/2-like lines, not apparently linked together. This four-lines group appears to be highly saturated around 10 K and still partially saturated at 85 K. Simula-tions of the unsaturated spectrum strongly support a S = 2 effective-spin origin, subjected to a weak axial anisotropy. This effective high-spin state is likely to arise from particular excitonic complex, involving one or more point defects.
In this paper, after explaining the experimental de-tails of materials and method (Sec. II), we present the raw EPR results under dark (Sec. III A) and illuminated (Sec. III B) conditions, followed by spectra simulation based on a S = 2 spin state (Sec. III C). Finally, a qualitative discussion about the origin of this high-spin state is given in the last section (Sec. IV).
II. EXPERIMENTAL
The reported EPR measurements were per-formed on two kinds of hydrothermally grown ZnO NPs, NP1 and NP2, with slightly different preparation methods, but important morphologi-cal difference.
NP1 were prepared as published elsewhere42. In a
typical experiment, a solution of 0.4415 g of potas-sium hydroxide KOH (Aldrich Chemicals 99.99%) in 23 mL of anhydrous methanol (Alfa Aesar) was added dropwise to a solution of 0.8202 g of zinc acetate (Aldrich Chemicals 99.99%) in 42 mL of anhydrous methanol and 0.25 mL of distilled water at 60◦C under magnetic stirring.
After 2h30 min at this temperature, the mixture was centrifuged (7800 rpm, 30 min) and the supernatant discarded. The product was washed with methanol and centrifuged, then finally dried under vacuum to obtain the ZnO nanoparticles as powder.
For NP2 fabrication43, Zinc acetate dehydrate
(0.1 M) and sodium hydroxide (0.2 M) solutions were prepared separately and magnetically stirred overnight at room temperature. Then, the two solutions were mixed into one beaker and magneti-cally stirred at 750 rpm for 2 hours at temperature of 60◦C. The precipitated white milky solution
was separated by centrifugation at 4500 rpm for 2 minutes. Afterward, the precipitation product was washed several times with deionized water and once time with acetone. Finally, the ZnO NPs in the form of powder was obtained by drying the precipitation product into a laboratory oven at 75◦C for 6 hours.
Transmission electron spectroscopy (TEM) char-acterizations of both samples (see Fig. 1) show that NP1 are almost spherical in shape with typi-cal diameter of 15 nm, while NP2 have spindle-like
shape with 400 nm and 100 nm in long and short dimensions, respectively. This points to the great versatility for size and shape of ZnO NPs, and to its great sensitivity to growth parameters. Both NP1 and NP2 NPs are single crystalline. Most of the presented results are obtained on NP1 sample. Results on NP2 sample are briefly presented at the end of Sec. III C, and mainly serve to prove the reproducibility of the observed photo-induced EPR signal in other types of ZnO NPs.
NP1
NP2
20 nm 5 nm
500 nm 50 nm
Figure 1: (color online) Transmission electron spec-troscopy images of NP1 and NP2 samples, showing differences in size and morphology.
EPR measurements have been performed on a conventional Bruker EMX continuous wave spec-trometer operating at X-band (ν = 9.402 GHz) using a standard TE102 mode cavity with optical
access. The low (11 K) and intermediate (85 K) temperature conditions were obtained by cooling down the samples with liquid helium and nitrogen within a cryostat inserted in the EPR cavity. The microwave (MW) incident power was controlled by an attenuator, allowing power value from 0 to 200 mW (P0). Improvement of the signal-to-noise ratio
has been achieved by scanning EPR spectra from 4 to 81 times.
White-light irradiation was performed by focusing the photon beam from halogen lamp toward the sample, via the cavity hole. The white-light source has been calibrated so that an optical power of ap-proximatively 80 mW is reached on the sample. Additional experiment with violet laser mentioned in Sec. IV, was performed with a Radius 405 (nm) laser of 20 mW.
3
III. RESULTS
A. Light-off EPR spectra
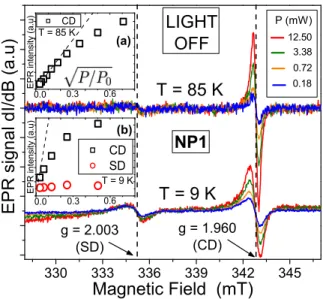
In figure 2, we present the results of EPR experiments recorded on the NP1 sample at temperatures T = 9 K and T = 85 K, under dark conditions (light off). Two lines are observed, at g = 1.960 and g = 2.003, which have been reported many times in EPR measurement of ZnO nanostructures32–34. They are commonly
identified as arising from core- and shell-defect, respectively. The g = 1.96 signal arises from most of the ZnO nanostructures44,45, regardless
of growth method and morphology, but also from bigger microsized crystal as ceramics and bulk single crystal25,37. On the contrary, the
g = 2.003 signal only appears in NPs with the smallest diameter (< 50 nm), when surface defects are assumed to play an important role. This is the foundation of the core-shell model (CSM) proposed by Erdem et al., which describe a very stable ZnO NP’s core, coated by a shell subjected to interactions with the surroundings32,33.
The NP2 sample spectrum (not shown) displays identical core-defect (CD) signal, while SD signal is not detected at none of the studied tempera-tures. This is consistent with the NPs bigger size in NP2, for which SD signal is not expected to occur. 330 333 336 339 342 345 T = 9 K T = 85 K (b) E P R i n t e n s i t y ( a . u ) CD 0.6 0.3 0.0 0.18 0.72 3.38 0.6 0.3 0.0 CD SD g = 1.960 (CD) T = 9 K E P R s i g n a l d I / d B ( a . u ) Magnetic Field (mT) T = 85 K g = 2.003 (SD) LIGHT OFF 12.50 P (mW ) E P R i n t e n s i t y ( a . u ) (a) NP1
Figure 2: (color online) Dark EPR spectra of ZnO nanoparticles recorded at T = 9 and 85 K on NP1 sample, with different MW powers, showing the shell-defect (SD) and core-shell-defect (CD) lines. Insets (a) and (b) show the saturation curve of CD at 85 K and those of CD and SD at 9 K, respectively.
From the power-dependence of NP1 EPR lines intensity (insets (a) and (b) of fig. 2), qualitative
information on the spin’s dynamics is obtained. If not saturated, EPR intensities vary as the square-root of incident the MW power, which results in straight dashed lines in the insets of figure 2. All departures from these lines indicate a (partially or totally) saturated spin resonance.
It can be seen that the SD signal saturates at weaker power than the CD one, so that we can draw the rough picture that SD has spin-lattice relaxation time significantly greater than that of the CD. This may be understood within the core-shell model of NPs, in which the CD spin must be more strongly coupled/linked to the lattice than the SD spin.
B. Light-on EPR spectra
When the white-light source is turned on and focalized on samples, two main drastic changes are observed in the EPR spectra.
First, the CD signal’s intensity is greatly enhanced with time constant of several minutes at RT, de-pending on the power light intensity. The intensity reaches a saturation value which also depends on the light-power intensity. This first point is correlated to the observed photoconductivity in ZnO NPs30. When white-light is turned off, the
enhanced CD signal lasts for several hours at 85 K, which is certainly related to the (problem-atic) persistent photoconductivity observed in the ZnO material12,13,21. The g = 1.960 signal
thus certainly arises from a donor center, located within the NPs core.
The second remarkable change in the EPR spectra is the apparition of a four-line structure (FLS), whose gravity center is that of the SD signal. This is the photo-induced EPR signal studied and discussed in this paper.
Figure 3 shows the result of white-light illumi-nation during an EPR experiment on NP1 sample: an intense four line structure (FLS) appears, centered at the SD g-factor (2.003), and whose line are denoted L1 to L4. Remarkably, these
new lines have equal spacing (∆ = 2.25 mT) and equal peak-to-peak line width (Lpp = 0.4 mT),
pointing to a single origin, possibly related to the SD. Such a relation is not obvious because the SD g-factor is so close to its free-electron value (2.0023), where every isotropic 1/2 spin resonate. We note that the observed lines shape are clearly not those of a simple EPR line, due to unresolved lines in between and/or to saturation phenomena. In order to get insight into the relaxation dy-namics of these EPR transitions, the temperature is slightly increased (from 9 to 11 K) and the MW power is varied from 0.007 to 1.584 mW. As shown in figure 4, three new features are observed. (1),
B Light-on EPR spectra 4 328 332 336 340 344 L 4 L 3 L 2 g = 1.960 g = 2.003 E P R s i g n a l d I / d B ( a . u ) Magnetic field (mT) LIGHT OFF LIGHT ON T = 9 K L 1 NP1
Figure 3: (color online) Dark (up, black) and illumi-nated (down, red) EPR spectra of ZnO NPs, recorded at 9 K on NP1 sample. The dark spectrum is magnified by factor 3. ∆ = 2.25 mT
at lowest MW powers, three additional lines are detected at g = 2.017, 2.003 and 1.992 (resp. L5,
L6, L7). (2) at highest MW power, satellite lines
(shoulders) near L1 to L4 are visible, marked by
black lines. (3) the FLS becomes less and less sym-metric as the MW power decreases.
330 332 334 336 338 340 L 7 L 5 1.584 0.405 0.097 0.024 0.007 (g=1.992) E P R s i g n a l d I / d B ( a . u ) Magnetic Field (mT) T = 11 K (g=2.017) LIGHT ON P (m W ) L 6 g=2.003 NP1
Figure 4: (color online) EPR spectra recorded on NP1 sample under white-light illumination at T = 11 K, for five values of MW power. Black marks indicate satellite lines discussed in the text.
The spectra dependence on MW power (Fig. 4) shows that the three additional-lines intensity (L5
to L7) are almost power-independent, while the
FLS intensity notably decreases with power. This signs a basic difference between the dynamics of these lines and the FLS, the formers having longer relaxation time than the latter. L5 and L7
displays no evidence for a relation with the FLS, whereas L6(g = 2.003) is likely to be the original
SD defect itself, which is also fully saturated at 11 K. Indeed, in other kind of samples in
which the FLS is observed under illumination (see NP2 Fig. 10 and Sec. IV), L5 is also present
with different g-valOmerue, while L6 and FLS
have the same position. It may be assumed that the photo-induced FLS is related to the SD, while being although of different nature, and that L5 and L7 arise from versatile excited
de-fects, depending on growth method and conditions. The satellite lines of the FLS appear only at highest powers, and each of them is located at a distance value ∼ ∆/4 from the nearest FLS line. Interestingly, L2and L3appear to be accompanied
by two of these satellite lines, while L1 and L4 by
only one. These satellites are likely to arise from multiphotons absorption, forbidden transitions, or low symmetry fields. The increase of their intensity is mainly responsible for the line-shape deformation at high power.
Regarding the FLS itself, its intensity varies notably with MW power variation, while preserv-ing a constant ∆ spacpreserv-ing and gravity center, and it becomes more and more asymmetric as the MW-power decreases. However, it can be seen on Fig. 5 that intensity of lines L1 and L4do not vary
anymore from P = 0.405 mW to P = 1.584 mW, contrarily to the center lines L2 and L3. This
indicates a slight difference in the dynamics of these transitions, which will be quantified in the following and discussed in Sec. IV. The FLS line widths are not affected by the MW power variation.
We now turn to the examination at higher temperature (85 K) of the FLS in order to observe fully unsaturated resonance, for it is the only case which can be treated by simulations.
EPR spectra recorded on NP1 sample under illumination at T = 85 K are shown in Fig. 5, for different MW powers. The widths of the L5 and
L6 lines are weaker than at T = 11 K, certainly
due to partial desaturation, which allows for an almost complete resolution of them. On the contrary, the L7 line is still not resolved. Line
widths of FLS are reduced from 0.4 mT to 0.3 mT. The satellite lines are relatively much weaker, still only appearing for the highest MW powers. The interesting feature of the spectra plotted in figure 5 is the observation of three completly different EPR-line dynamics. First, L1 to L4
lines do not reach a total saturation regime, since their intensity always increases with increasing MW power. Beside, the L5 line reaches a total
saturation regime for MW power of 0.79 mW, while L6 and L7 lines appears to be always fully
saturated, at any MW power. This is a srong indication that all these line groups arise from differents photo-excited paramagnetic centers.
B Light-on EPR spectra 5 330 332 334 336 338 340 L 7 L 5 T = 85 K 3.18 0.79 0.21 0.05 E P R s i g n a l d I / d B ( a . u ) Magnetic Field (mT) LIGHT ON g=2.003 P (m W ) L 6 NP1
Figure 5: (color online) EPR spectra under illumina-tion recorded on NP1 sample at 85 K (colored, bot-tom) for different MW powers, and at 9 K (black, top) for P = 0.21 mW. Magnetic-field modulation is 2 G. Satellite line are indicated by black marks.
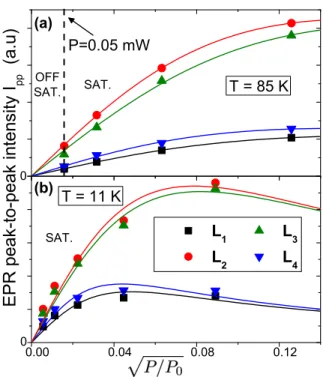
A key physical information to be extracted from these spectra is obtained from their intensity MW power dependence, which gives insight into the dynamics of each EPR line, as well as into the spin-resonance regime (saturated or unsatu-rated). Peak-to-peak height for lines L1 to L4
(proportional to absorbed intensities for constant peak-to-peak line width) have been plotted as functions of MW power in Fig. 6, at 11 and 85 K. It is to recall that an EPR line is said to be not saturated if by doubling √P , the intensity is doubled. From this simple criterium, we see that at T = 85 K, the FLS is not saturated only for incident MW power as weak as P = 0.05 mW. At T = 11 K, whatever the weakness of the incident MW power is, the FLS structure is always saturated: the required power for a total unsaturated regime of the FLS is so low that the lines cannot be detected anymore in our experimental conditions.
More quantitative information about EPR dy-namics is obtained by the fitting of the satura-tion curves with an appropriate funcsatura-tion includ-ing physical parameters. The simplest modelinclud-ing of the saturation phenomena is derived from the isotropic Bloch equations, including longitudinal and transverse relaxation times T1 and T2. It
re-sults in the following power dependence of the EPR intensity46:
I(P ) = K. √
P
1 + A.P (1)
The parameter A is proportional to the prod-uct of the relaxation times T1 (spin-lattice) and
T2 (spin-spin). It determines the maximum of the
0.00 0.04 0.08 0.12 SAT. 0 L 1 L 3 L 2 L 4 0 E P R p e a k-t o -p e a k i n t e n si t y I p p ( a . u ) (b) SAT. T = 85 K T = 11 K P=0.05 mW OFF SAT. (a)
Figure 6: (color online) Experimental saturation curves of the FLS (scatters) recorded on NP1 sample at T = 85 K (a) and T = 11 K (b), and fit from Eq. (1) (solid lines).
saturation curve. The parameter K contains the square of the transition probability, the Boltzmann factor, and the T2 time. The fitting of EPR
inten-sities vs √P is displayed in Fig. 6, which show an overall good agrement. At T = 85 K, parame-ter A is found to be almost identical for the four considered lines. However, at T = 11 K, satu-ration curves clearly show that L1 and L4 reach
maximum at MW power substantially weaker than L2 and L3. The fitting allows to determine that
A1,4/A2,3≃ 3. By assuming that T2 is almost the
same for all these lines, it is finally deduced that the spin-lattice relaxation time T1is notably longer
for extreme lines of the FLS (T11,4/T 2,3
1 ≃ 3). This
fact will be of importance in the following, when searching for the appropriate spin Hamiltonian to fit the FLS.
Finally, we note that after light-irradiation removal the FLS remains detectable for several hour at 85 K, which will be discussed in Sec. IV.
C. Simulations
In order to gain insight into the origin of the photo-induced FLS, spectra simulations have been performed, based on assumed spin Hamiltonian and spin state. It is found that two radically different spin systems can give account for the observed FLS. This latter can arise either (1), from superhyperfine coupling of one electronic 1/2
C Simulations 6
spin with 3 adjacent protons, or (2), from a S = 2 spin under weak axial anisotropy.
In the following, we present arguments which make the first scenario very unlikely to exist. Then, we show that the second one can give well account for the experimental spectra.
In fact, a complex made of one 1/2 spin (hole or electron) surrounded by 3 protons can exist in
ZnO47,48. These protons can be provided by the
ubiquitous unintentional hydrogen-doping, and the 1/2 spin can be carried by a point defect. However, in such a case, signals arising from simpler complexes (involving only 1 or 2 protons) must then occur with higher probabilities, which are indeed not detected. In addition, due to the identical ∆ spacing between lines, the superhyper-fine coupling constant would have to be exactly the same for all protons, this constant (A = 66 MHz) being moreover very intense for such a distant interaction (A = 1.4 MHz for donor spin coupling with adjacent hydrogen in ZnO49). It is also
to be noted that the FLS has been observed in other kind of hydrothermally grown samples with exactly the same ∆ spacing: this indicates a stable and reproducible property, poorly compatible with random distribution of unintentional hydrogen impurities.
Finally, the most important argument against this first scenario, and in favor of the second one, is provided by the saturation curves of the FLS (Fig. 6). These show that at T = 11 K the extreme lines L1 and L4have not the same dynamics than
that of the center lines, L2 and L3. This has been
quantitatively demonstrated by the fits of Fig. 6, leading to the ratio of spin-lattice relaxation times T11,4/T
2,3
1 ≃ 3. In the case of hyperfine couplings,
however, all of the four lines would arise from | − 1/2i ↔ | + 1/2i electronic-state transitions, and must then have the same spin-lattice coupling, thus saturating at the same MW power.
On the contrary, if the FLS arise from a S = 2 spin under weak axial anisotropy, this difference in dynamics is expected because, as shown in Fig. 7-b, the extreme lines L1 and L4 arise from
transitions | ± 2i ↔ | ± 1i, while the center lines L2
and L3 do from transitions | ± 1i ↔ |0i. Different
electronic spin states having different coupling with lattice’s phonons, the above-mentioned tran-sition must have different dynamics, consistently with our observations.
In the following, based on the above-mentioned arguments, we focus on the S = 2 scenario and present the simulated spectra based on the spin Hamiltonian written in Figure 7-b. This latter contains the Zeeman interaction with the static magnetic field B, and an axial anisotropy term characterized by the D parameter (D < gµBB).
330 333 336 339 342
∆ ∆
S=2 (b) (θ=90 ) (θ=0 )Magnetic Field (mT)
(powder) 2D D (a)∆
L 4 L3 L 2 L 1Figure 7: (color online) (a) Simulated EPR spectra for S = 2 spin with axial anisotropy D for powder, B k z (θ = 0◦) and B ⊥ z (θ = 90◦). (b) Corresponding
Hamiltonian and levels scheme.
For θ = 90◦orientation, the spacing between lines
simply equals D, in magnetic field units. The sim-ulated powder spectrum is strongly asymmetric, and is dominated by the most occurring orienta-tion, that is θ = 90◦. Then, the experimental ∆
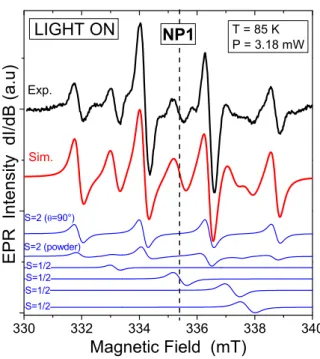
spacing is a direct measure of the D parameter. Regarding simulations, it must be kept in mind that only unsaturated resonance of one-photon transitions can be accounted for by the cur-rent EPR software as EASYSPIN50 used here.
Rigorously, the spectra to be simulated must be restricted to those recorded in unsaturated conditions, which is only the case at T = 85 K and P = 0.05 mW (see Fig. 6). This experimental spectrum displays the most asymmetric FLS, that well corresponds to the powder spectra of S = 2 with axial anisotropy (Fig. 7-a), and no satellite lines around the FLS.
In order to reproduce this unsaturated exper-imental spectrum, the powder spectra of S = 2 with axial anisotropy (Fig. 7-a) is used, involving only one energetic parameter (D). Also the three lines L5 to L7 evoked before (Sec. III B)
are added, plus another one (denoted L8) which
appears necessary to obtain an overall good agreement. The resulting simulation, presented in figure 8, appears very satisfactory. The axial anisotropy parameter is found to be |D| = 66 MHz (= 22 × 10−4 cm−1), which corresponds to a very
weak axial anisotropy. Its sign, which depends on the in-plane or out-of-plane character cannot be determined in our experimental conditions (too high temperature).
The number of 1/2 spins used in this simulation (4) may appear as too important for drawing
C Simulations 7 330 332 334 336 338 340 L 8 L 7 L 6 L 5 L 4 L 3 L 2 S=1/2 S=1/2 S=1/2 S=1/2 E P R I n t e n s i t y d I / d B ( a . u ) Magnetic Field (mT) Exp. Sim. S=2 LIGHT ON T = 85 K P = 0.05 m W NP1 L 1
Figure 8: (color online) Simulated (red) and experi-mental (black) EPR spectra recorded on NP1 at 85 K in unsaturated conditions (P = 0.05 mW) under illu-mination. Various contributions to the simulation are display (blue), all divided by a factor 3.
conclusion about the FLS. However, these addi-tional 1/2 spins are clearly not directly related to the FLS59, so that their introduction in the
simulation does not prevent to conclude about the actual presence of a S = 2 local electronic spin. The unsaturated spectrum being well repro-duced by simulation, the saturated case is now examined in order to understand the difference between both. Apart of the satellite lines appari-tion briefly discussed in Sec. III B (not taken into account in simulation), the main characteristic of this experimental saturated spectrum is the almost symmetric shape of the FLS, which is not compatible with a simple anisotropic S = 2 pow-der (see Fig. 7-a). The explanation can be that powder-spectrum simulation does not explicitly includes anisotropic line widths60, while it is likely
to actually arise in ZnO saturated EPR.
Surprisingly, it can be noticed that the sat-urated EPR spectrum tends to look alike the B ⊥ z simulation (Fig. 7-a, θ = 90◦). This
can be understood if the line width along the other direction (θ = 0◦) becomes more and more
important as the MW power is increased, so that its apparent height decrease. As a consequence, the powder spectrum is disturbed and tends to the oriented θ = 90◦ direction as the saturation
is reached. Figure 9 presents the comparison between the saturated experimental spectrum at 85 K and the simulation. This latter include the S = 2 powder spectrum, the four additional lines L5to L8, but also a contribution from the θ = 90◦
330 332 334 336 338 340 S=1/2 S=1/2 S=1/2 S=1/2 S=2 (powder) E P R I n t e n s i t y d I / d B ( a . u ) Magnetic Field (mT) Exp. Sim . T = 85 K P = 3.18 m W LIGHT ON S=2 (=90°) NP1
Figure 9: (color online) Simulated (red) and experi-mental (black) EPR spectra recorded on NP1 at 85 K in saturated conditions (P = 3.18 mW) under illu-mination. Various contributions to the simulation are display (blue), all divided by a factor 3.
orientated S = 2 simulation. We may consider this last contribution as an effective way of taking into account a strong anisotropy of the EPR line width, arising in saturated cases.
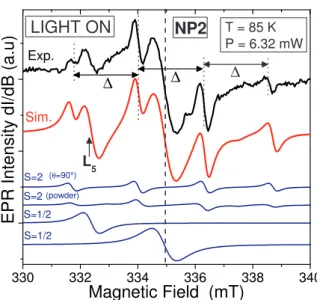
In the following, it is proven that the photo-induced FLS is reproducible in other kind of dried hydrothermally-grown sample, with different size and morphology (NP2 sample). In figure 10, the EPR spectrum recorded on NP2 under white-light illumination is shown, together with its corre-sponding simulated EPR spectrum.
First, the photo-induced FLS is also observed, with exactly the same ∆ spacing (2.25 mT) and almost the same gravity center (g = 2.004 vs g = 2.003 in NP1). This points to the great stability of the paramagnetic center responsible for this EPR signal. Interestingly, the L7 and L8
lines observed in NP1 are not detected in NP2, while L5 is now positioned at a different g-value.
This support the assumption that although all these lines are photo-induced by white light, they arise from independent paramagnetic centers and can exist independently from each other. The L6
line is still present at the gravity center of the FLS, but with greater relative intensity. Indeed, in this NP2 sample, the FLS is much weaker than in NP2 and high MW power is required in order to obtain acceptable signal-to-noise ratio. The pre-sented experimental spectrum of figure 10 is thus recorded in saturated conditions (P = 6.32 mW).
8 330 332 334 336 338 340 ∆ ∆ (powder) S=1/2 S=1/2 S=2
E
P
R
I
n
te
n
s
it
y
d
I/
d
B
(
a
.u
)
Magnetic Field (mT)
Exp. Sim. T = 85 K P = 6.32 mWLIGHT ON
S=2 (θ=90°)NP2
∆ L 5Figure 10: (color online) Experimental and simulated spectra recorded at T = 85 K and P = 6.32 mW on the S2 sample. All simulation’s contributions, with their respective weight, are divided by 3.
Regarding the simulation, and consistently with the above-presented results, such a saturated case needs the contribution of the θ = 90◦ orientated
S = 2 spin, for giving account of the symmetric shape of the FLS. The resulting simulation can be viewed as satisfactory.
It is then concluded that there actually exist a photo-excited S = 2 localized magnetic state in ZnO NPs, together but independently of other S = 1/2 photo-induced paramagnetic centers. In the following, the possible origins for this high-spin state are discussed.
IV. DISCUSSION
Regarding the existance of the S = 2 spin , it must be noticed that such an even high spin state is quite rarely observed in matter, where strong local anisotropy often prevent the related EPR transitions to occur (∆mS = ±1 required). The
present observation of S = 2 spin with very weak axial anisotropy (|D| = 66 MHz) thus excludes the possibility for a transition metal ion origin, such as the 5D ground multiplet of Fe2+ ion, which
would be expected to have larger axial anisotropy parameter D. For comparison, D = −710 MHz in ZnO:Mn2+ (S = 5/2)51, and D = +82 743 MHz
in ZnO:Co2+ (S = 3/2)52.
Focusing on an intrinsic-defect origin for the observed photo-induced FLS, we recall that the assumed S = 2 spin-state must be viewed as effec-tive, possibly made of orbital and spin magnetic momentum.
Without orbital contribution, the existence of a S = 2 spin requires the local coupling of at least four 1/2 spins (bear by electrons or holes). Such a situation can exist if two neutral vacancies defects in triplet state (S = 1) are ferromagnetically coupled. Indeed, it has been theoretically demon-strated that neutral zinc vacancy (two localized holes) has triplet ground state, while neutral oxy-gen vacancy (two localized electrons) has triplet excited state, lying at about 2-3 eV above its sin-glet ground state53. It is thus conceivable that, if
two of these vacancies lay closed together enough, a photon absorption may causes this complex to transit to an S = 2 spin state. However, such a spin-pair would be expected to have different cou-pling constant, according to the relative position of each spin within the ZnO matrix, leading to a distribution in the axial anisotropy parameter D. On the contrary, the observed S = 2 spin appears to arise from a unique local center, with stable and identical properties among different samples. A plausible explanation for such an intrinsic high-spin center created by light irradia-tion in ZnO can be related to excitons, which are known to be possibly bounded to defect23,54–56.
At least three different coupling schemes involving excitons can be thought about. (i) a triplet-state (S = 1) exciton can be ferromagnetically bounded to a triplet-state defect (neutral VZn
or V0 discussed above), resulting in the observed
quintet state. (ii) Two triplet excitons can be coupled together, forming a so-called high-spin state bi-exciton57,58, potentially localized at the
surface of NPs. (iii) In cubic crystal of local symmetry Td, single exciton can exist in a quintet
state (S ≡ J = 2 effective spin), if the hole in the J = 3/2 (Γ8) valence band and the electron in
the J = 1/2 (Γ6) conduction band are coupled by
ferromagnetic exchange interaction. In wurtzite crystal (local symmetry C6v), the J = 3/2 valence
band is moreover split into ±3/2 (Γ9, heavy hole)
and ±1/2 (Γ7, light hole) band56. Again, in case
of ferromagnetic exchange coupling between hole and electron , this situation can also give rise to an effective S ≡ J = 2 spin, but with weak axial anisotropy, as observed here. This last scenario is probably the most relevant, because it involved only one simple excitation.
In any cases, even that of a FLS extrinsic ori-gin, high local electric fields at the ZnO NPs surface certainly play a major role in the for-mation and localization of such excitonic high spin. Among the experimental facts which can con-firm or disconcon-firm the proposed scenarios, there may be the apparition of the satellite lines at high MW power, which are not taken into account by our simulations. These are likely to arise from multiphotons absorption, but their position
9
are difficult to explain, in particular the single satellite of the extreme lines L1 and L4, moreover
outside of the FLS. Forbidden transitions or low symmetry Hamiltonian components mays also have to be considered to explain the satellite lines. In parallel, the study of the FLS signal decay after light removal gives a key information for its understanding as well as for its application. So far, it has been observed that the FLS has a very long life time, losing about 10 % of its intensity value two hours after the light removal, at 85 K. The only mean of speed up this decay is to heat the sample up to room temperature. This unusual very long life-time may be interpreted as the result of the high-spin state forbidden recombination, in a sort of “magnetic phosphorescence”. This point is particularly interesting for potential application. We now point to the intriguing fact that such an interesting photo-induced EPR signal has not been reported before to our knowledge. In particular, in their work onto EPR of ZnO NPs, Erdem al. have illuminated their samples with red (671 nm), green (532 nm) and blue (445 nm) laser lights, without seeing any photo-induced FLS41. The reason is
certainly that these excitation energies are simply too low to give rise to the FLS. Indeed, we have performed the same photo-EPR experiment with violet laser light (405 nm), and observed the FLS just as with white light illumination. From these preliminary experiments, it can be assumed that this minimal energy lay between 2.79 eV (445 nm) and 3.06 eV (405 nm), which would be compatible with a highly bound exciton.
A complete spectral study (up to UV energies) of this photo-induced FLS would be an important source of information for determining its origin. For example, if the FLS (L1 to L4) and the
additional lines (L5 to L8) are really independent,
their minimal excitation energy must certainly be different. Then, illuminating the sample with the lowest of these energies excitation would permit to separate the lines.
Nevertheless, excitation energy is not the only crucial parameter for observing the photo-induced FLS. In fact, in some other samples of hydrother-mally grown ZnO NPs, the photo-induced FLS is not observed. Morphology, solvent, drying and storage conditions, must have to be considered in a systematic study in order to find the exact
con-ditions for favoring the FLS presence. However, we have observed it in several different samples, grown in two different labs, with exactly the same ∆ = 2.25 mT spacing between lines. We thus believe it to be a reproducible intrinsic property of ZnO NPs.
In any cases, the control and the manipulation of such a high-spin state carried by a single NP open the way to promising possibility in terms of information storage or processing. Since a particular maximal wavelength must be able to switch on the high-spin state, it is very likely that some other wavelength would be able to switch it off. Thus, a light-writable and -erasable magnetic memory would be realized, readable by EPR. In such a context, the observed long life-time of the photo-induced FLS would be an advantage to preserve information with minimal refreshing. The presented results could path the way for reversibly encoding magnetic information within a stable single crystalline NP.
V. CONCLUSION
In this paper, we have reported on a new EPR signal, the FLS, reversibly induced by white-light irradiation in ZnO NPs. Power-dependence, tem-perature studies and spectra simulations show that this signal is very likely to arise from a localized high-spin state S = 2 with weak axial anisotropy. At T = 85 K, this spin state can last several hours after the light-irradiation removal, certainly due to highly spin-forbidden recombination process. The intrinsic character of this light-induced EPR sig-nal is suggested, most probably related to bound-exciton physics. Other photo-induced EPR lines without structure and with different spin-lattice dynamics are detected, not apparently linked to the FLS.
VI. ACKNOWLEDGEMENT
The authors acknowledge Prof. Bruno Guigliarelli for useful discussion and Cl´ement S´ebastio for help in the optical installation.
1 ¨
Ozg¨ur U, Hofstetter D and Morko¸c H 2010 Proc.
IEEE, 98, 1255 2
Wang Z L 2008 ACS Nano 2 1987-1992
3
Kundu S and Nithiyanantham U 2014 Eng. Chem.
Res. 53 13667 4
Roth P and Williums D F 1981 J. Appl. Phys. 52
6685
5
Suchea M, Christoulakis S, Moschovis K, Katsarakis N and Kiriakidis G 2006 Thin Solid Films 515 551
6
Ambia M G, Islam M N and Obaidul Hakim M 1992
Journal of Materials Science 27 19 5169 7
10
Physical 267 242 8
Bernardini S, Benchekroun M H, Fiorido T, Aguir K, Bendahan M, Dkhil S B, Gaceur M, Ackermann J, Margeat O and Videlot-Ackermann C 2017 MDPI
Proceedings 1 (4) 423 9
Dey A 2018 Materials Science and Engineering: B 229206
10
Echresh A, Chey C O , Shoushtari M Z, Nur O and Willander M 2014 J. Appl. Phys. 116 193104
11
Alnoor H, Pozina G, Khranovskyy V, Liu X, Iandolo D, Willander M and Nur O 2016 J. Appl. Phys. 119 165702
12
Laiho R, Poloskin D S, Stepanov Y P, Vlasenko M P and Zakhvalinskii V S 2009 J. Appl. Phys. 106 013712
13
Bao J, Shalish I, Su Z, Gurwitz R, Capasso F, Wang X and Ren Z 2011 Nanoscale Res. Lett. 6 404
14
Harbour J R, Chow V and Bolton J R 1974 Can. J.
Chem. 52 3549 15
Lipovsky A, Tzitrinovich Z, Friedmann H, Applerot G, Gedanken A and Lubart R 2009 J. Phys. Chem.
C 113 15997 16
Kayaci F, Vempati S, Donmez I, Biyikli N and Uyar T 2014 Nanoscale 6 10224
17
Tang Y, Zhou H, Zhang K, Ding J, Fan T and Zhang D 2015 Chem. Eng. J. 262 260
18
Butkhuzi T V, Chelidze T G, Georgobiani A N, Jashiashvili D L, Khulordava T G and Tsekvava B E 1998 Phys. Rev. B 58 10692
19
Rodnyi P A and Khodyuk I V 2011 Opt. Spectrosc. 111776
20
Vanheusden K, Seager C H, Warren W L, Tallant D R and Voigt J A 1996 Appl. Phys. Lett. 68 403
21
Bera A and Basak D 2009 Appl. Phys. Lett. 94 163119
22
Titov V V, Lisachenko A A, Akopyan I Kh, Lab-zowskaya M E and Novikov B V 2018 J. Lumin. 195153
23
Meng X, Zhou Y, Zeng X, Chen X and Chu Y 2018
J. Lumin. 195 201 24
Lv J, Li C and Chai Z 2019 J. Lumin. 208 225
25
Kasai P H 1963 Phys. Rev. 130 3 989
26
Galland D and Herve A 1970 Phys. Lett. A 33 1
27
Galland D and Herve A 1974 Solid State Commun. 14953
28
P¨oppl A and V¨olkel G 1989 Phys. Stat. Sol. (a) 115 247
29
Carlos W E, Glaser E R and Look D C 2001 Physica
B 308-310 976 30
Vlasenko L S 2009 Physica B 404 4774
31
Vlasenko L S 2010 Appl. Magn. Reson. 39 103
32
Jakes P J and Erdem E 2011 Phys. Stat. Sol. RRL 52 56
33
Kaftelen H, Ocakoglu K, Thomann R, Tu S, Weber S and Erdem E 2012 Phys. Rev. B 86 014113
34
Ruf T, Repp S, Urban J, Thomann R and Erdem E 2016 J. Nanopart. Res. 18 109
35
Lambe J, Baker J and Kikuchi C 1959 Phys. Rev.
Lett. 3 6 270 36
Holton W C, Schneider J and Estle T L 1964 Phys.
Rev. 133 6A A1638 37
P¨oppl A and V¨olkel G 1990 Phys. Stat. Sol. (a) 121 195
38
P¨oppl A and V¨olkel G 1991 Phys. Stat. Sol. (a) 125 571
39
Nikitenko V A 1992 J. Appl. Spectrosc. 57 783
40
Wang X J, Vlasenko L S, Pearton S J, Chen W M and Buyanova I A 2009 J. Phys. D: Appl. Phys. 42 175411
41
Erdem E 2014 J. Alloy. Compd. 605 34
42
Diallo A K, Gaceur M, Berton N, Margeat O, Ack-ermann J and Videlot-AckAck-ermann C 2013
Superlat-tices Microstruct. 58 144 43
Adam R E, Pozina G, Willander M and Nur O 2018
Nanostructures and Photonics 32 11 44
Savoyant A, Alnoor H, Bertaina S, Nur O and Wil-lander M 2017 Nanotechnology 28 035705
45
Savoyant A, Alnoor H, Pilone O, Nur O and Wil-lander M 2017 Nanotechnology 28 285705
46
Weil J A and Bolton R, Electron Paramagnetic Res-onance, Wiley-Interscience p. 314.
47
Van de Walle C G 2000 Phys. Rev. Lett. 85 5 1012
48
Karazhanov S Zh, Marstein E S and Holt A 2009 J.
Appl. Phys. 105 033712 49
Hofmann D M, Hofstaetter A, Leiter F, Zhou H, He-necker F, Meyer B K, Orlinskii S B, Schmidt J and Baranov P G 2002 Phys. Rev. Lett. 88, 4, 045504
50
Stoll S and Schweiger A 2006 J. Magn. Reson. 178 45
51
Savoyant A, Stepanov S, Kuzian R, Deparis C, Morhain C and Grasza K 2009 Phys. Rev. B 80 115203
52
Sati P, Hayn R, Kuzian R, R´egnier S, Sch¨afer S, Stepanov A, Morhain C, Deparis C, La¨ugt M, Goiran M and Golacki Z 2006 Phys. Rev. Lett. 96 017203
53
Chanier T, Opahle I, Sargolzaei M, Hayn R and Lannoo M 2008 Phys. Rev. Lett. 100 026405
54
Thomas D G and Hopfield J J 1961 Phys. Rev. Lett. 7, 8, 316
55
Reynolds D C, Look D C, Jogai B, Litton C W, Collins T C, Harsch W and Cantwell G 1998 Phys.
Rev. B 57 19 12151 56
Meyer B K, Alves H, Hofmann D M, Kriegseis W, Forster D, Bertram F, Christen J, Hoffmann A, Strasburg M, Dworzak M, Haboeck U and Rodina A V 2004 Phys. Stat. Sol. (b) 241 2 231
57
Poem E, Kodriano Y, Tradonsky C, Lindner N H, Gerardot B D, Petroff P M and Gershoni D 2011
Nature Physics 6 12 58
Weiss L R, Bayliss S L, Kraffert F, Thorley K J, Anthony J E, Bittl R, Friend R H, Rao A, Greenham N C and Behrends J 2016 Nature Physics 13, 176
59
Dynamics are completly different and, moreover, in NP2, the same FLS appears without L7and L8, and with L5 at a different position
60
EASYSPIN only take into account effective line width anisotropy due to unresolved hyperfine struc-ture via H-strain.