HAL Id: hal-00622334
https://hal-upec-upem.archives-ouvertes.fr/hal-00622334
Submitted on 23 Feb 2014
HAL is a multi-disciplinary open access
archive for the deposit and dissemination of
sci-entific research documents, whether they are
pub-lished or not. The documents may come from
teaching and research institutions in France or
abroad, or from public or private research centers.
L’archive ouverte pluridisciplinaire HAL, est
destinée au dépôt et à la diffusion de documents
scientifiques de niveau recherche, publiés ou non,
émanant des établissements d’enseignement et de
recherche français ou étrangers, des laboratoires
publics ou privés.
Dilo
To cite this version:
Bérengère Vasseur, Daniel van de Vlag, Alfred Stein, Robert Jeansoulin, Arta Dilo. Spatio-temporal
Ontology for defining the quality of an application. 3rd International Symposium on Spatial Data
Quality (ISSDQ’04), Dept. for Geoinformation and Carthography, Vienna University of Technology
TUW, Apr 2004, Bruck an der Leihta, Austria. pp.67-82. �hal-00622334�
*Laboratoire des Sciences de l’Information et des Systèmes
LSIS, Université de Provence, 39, rue Joliot-Curie, 13453 Marseille cedex 13 [email protected],
**ITC, Department of Earth Observation Science, Hengelosestraat 99, P.O. Box 6, 7500 AA Enschede, The
Netherlands
[email protected], [email protected], [email protected]
ABSTRACT. Decision making in geographical information system is based on models of observed processes. Process models have their concepts and objects that could be different from those used during the data collection. This raises the question of fitness for use between the problem to be solved and the available data. Use of ontologies has resulted into a new approach to qualifying and quantifying fitness for use. So far, temporal aspects have been poorly integrated. The purpose of this paper is to provide a methodology for this purpose. We integrate: 1- quality elements described by ISO standards and 2- features ontology concerning a dynamic application. Integration is carried out by means of a matrix of quality. Satisfying each box of the matrix with a quality close to the required one, represents an approximation between the two ontologies. We apply this methodology to an application in coastal movement in the Netherlands, whereby beaches are subject to nourishment due to severe erosion. The quality of this application is described given the selected data.
KEYWORDS: spatio-temporal ontology, fitness for use, fuzzy objects, objects with indeterminate boundaries, temporal objects, data quality.
1. Introduction
Geographical data from various sources, and various scales are available, in digital form, and it looks easy to combine and use them to answer a given problem. But we can question the value of a decision based on data that deciders little know about (Hunter 2001). This raises the problem of fitness for use between the data ideally required to respond to a problem, and the existing one.
The use of an ontological approach to link ISO quality elements to the features of the application can help assessing fitness for use between a problem and the given data, but to a certain extent only.
First: ontological approach is very useful to describe the fitness for use of an application, by providing a common framework, easily understandable (Jeansoulin, 2002). It forces us to explicit the features of the application (objects, relations, attributes, etc.), and to specify the conformance quality level expected for each relevant feature. However, ontological approaches representing space and time are not frequently used yet, although this dimension is essential to analyze and understand dynamic geographical problems (Claramunt 1997), (Galton 2000), (Frank, subm).
Second: standards of quality such as ISO, provide a goodbase for better qualifying and quantifying the fitness for use. It enables data producers to express how well their product meets the criteria set forth in its product specification, and data users to establish in what extent a dataset meets their requirements (ISO 2003). However, standards come from discussions and negotiations supported explicitly and implicitly by certain institutions, and in that sense, give a partial representation of reality (Goodchild and Jeansoulin 1998). In that sense, ISO quality standards concern a-temporal applications, but do not take into account temporal applications, with the study of events and processes working on them.
Hence, to look at the full dimension of the problem, it is important to have a methodology that describes the quality of the data and models with objects, relations, but also processes.
Finally, we propose to extend the ontological approach to the time dimension, for better specifying the characteristics of the application, and attaching quality elements also to processes. We take into account ISO elements and sub elements of quality as a starting point, and extend them for describing the dynamic geographical problems. In addition, we also consider the issue of representing spatial objects with indeterminate boundaries, because applications with natural dynamic objects often mix both issues.
In our experiment, we consider that the user is an expert in the field of geomorphology, and has enough data to instantiate his problem (Vasseur 2003). The methodology is applied to monitoring coastal movement in northern Netherlands, whereby beaches are subject to nourishment due to severe erosion. The characteristics of this study lies in the "fuzzy" nature of the objects, and their dynamism. Those aspects are studied still little in the conceptual representation of the geographical applications by ontologies.
2. Research methodology
In our research, we want to describe a spatio-temporal application in terms of information quality, that is “fitness for use”.
2.1. Concept of ontology
We adopt the classical definition of an ontology as “an explicit specification of a conceptualization” (Gruber, 1993). But we prefer to include the conceptualization in the ontology, as well as its specification, and the quality requirements necessary to build this specification for this particular conceptualization. The concepts, their specified representation and the required quality, are intimately intermixed, and this is a major issue in the definition of the “fitness for use” of some given information for some given application.
This leads us to use the two terms of “features” and “quality elements” in the definition and edition of an ontology for an application. Concepts in the ontology should be close to objects (physical or logical) and relationships in the domain of interest (Noy and Mc Guinness, 2001).
2.2. Features
We call “feature” any element necessary to build the ontology of a geographic application, like specific (spatial) objects, attributes, relations, processes, and events.
-“object”: in geographical applications, objects exist if they have a spatial existence during some period of time, and if some thematic attribute can characterize them (Guptill et Morrison 1995). Moreover, aerial object (with a spatial extent) are bound by limits which are itself spatial objects, and which can be crisp (sharp) or indeterminate (fuzzy);
-“attributes”: spatial attributes describe the geometry of crisp or fuzzy objects; thematic attributes describe quantitative or qualitative properties of an object;
-“relation”: the objects and their attributes are bound by relations, for instance topological relations, logical etc (e.g., constraints of integrity, of cardinality, or fixed by the expert).
-“state”: an assessment of the situation of the spatial objects, at a certain date, with respect to some reference situation, allowing to state, for instance: ‘sufficient volume of sand’, ‘too wet’, etc. Hence, it is an instantaneous representation of the beach situation, according to the chosen ontology, “instantiated” by values computed from the observations, that are relevant for this instant;
-“process”: a sequence of states, made comparable through the use of a same ontology (or nearly the same), which denotes an evolution that can be compared to some reference evolution, allowing to state, for instance: ‘erosion process’, ‘coast-line conservation’, etc.
-“event”: a complete set of changes occurring at a place on a given time, driving to a new state (Claramunt et al., 1998), (Frank subm).
2.3. Quality elements and sub elements
Several quality elements are suggested by the organizations of standardization (ISO 2003) (FGDC 2000) (CEN/TC-287 1994/1995). More precisely, the following parameters: completeness, logical consistency, and accuracy (Fisher 2003), defined as follows, according to ISO (JOOS 2003).
- Completeness: presence and absence of features, their attributes and relationships Commission: excess data present in a dataset
Omission: data absent from a dataset
- Logical consistency: degree of adherence to the logical rules of a data structure, attribution and
relationships (data structure can be conceptual, logical or physical)
Conceptual: adherence to rules of the conceptual schema
Domain: adherence of values to the value domain
Format: degree to which data is stored in accordance with the physical structure of the dataset Topological: correctness of the explicitly encoded topological characteristics of a dataset. - Positional accuracy: accuracy of the position of features
Absolute or external: closeness of reported coordinate values to values accepted as or being true Relative or internal: closeness of the relative positions of features in a dataset to their respective
relative positions accepted as or being true
Gridded data position: closeness of gridded data position values to values accepted as or being true - Temporal accuracy: accuracy of the temporal attributes and temporal relationships
Accuracy of a time measurement: correctness of the temporal references of an item Temporal consistency: correctness of ordered series, in sequences and in frequency Temporal validity: validity of data with respect to time
- Thematic accuracy
Accuracy of quantitative attributes: the correctness of attributes of features and their relationships Classification correctness: comparison of the classes to a reference (e.g., ground truth)
Non-quantitative attribute correctness: correctness of non-quantitative attributes Quantitative attribute accuracy: accuracy of quantitative attributes
- Other elements: to define if necessary
2.4. Quality to feature relationship
Now that we have defined features and quality elements, we need to integrate them using an appropriate representation. Our first proposition is to use a “quality matrix”, a two dimensional matrix, such as used in spreadsheet making and maintenance (for instance the MS Excel spreadsheet). More sophisticated tools should enhance later this representation (such as ‘ontology builders’).
The matrix of quality represented on Table 1, indicates, by column, the features of the application, and by line, the quality elements that are of interest for the application. The relevant cells of the matrix, link, when applicable, a quality value to a feature. Some quality values may depend on other and such dependencies should be defined when existing.
Table 1: Quality matrix for defining a state, a process, or an event features « x »
Quality elements
« y »
Spatial Thematic Temporal Relation … Completeness Logical consistency Positional accuracy Temporal accuracy Thematic accuracy …
This methodology is illustrated through Ameland application, in Netherlands, and is presented thereafter in section 3 entitled Application Ameland.
3. Application Ameland
We illustrate our methodology through the Ameland application in Holland, which is studied by the International Institute for Geo-Information Science and Earth Observation (ITC), in co-operation with Rijkswaterstaat and RIKZ in Holland (Van de Vlag et al., 2003).
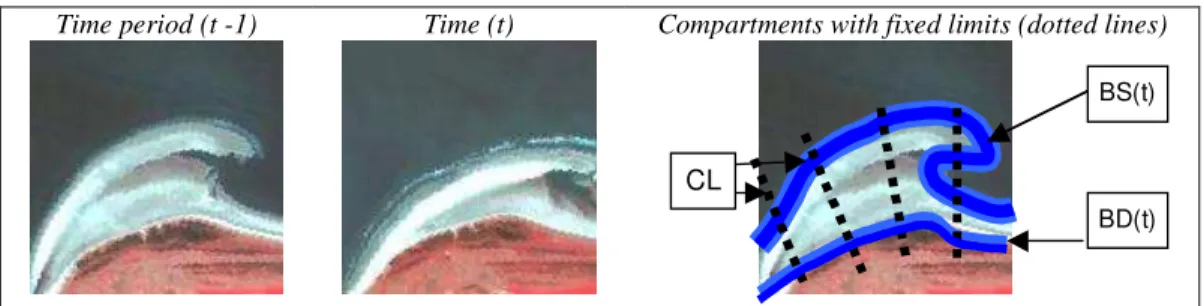
It concerns a coastal area in the north of Holland, where erosion and sedimentation of the beaches influence its morphology. This has an economic impact on the management of the beach and public safety (Roelse 2002). Therefore, the expert wishes to model the in the best possible way the ‘process’ of erosion, and the event of nourishment at a certain period. The interest of this application is to take into account the "fuzzy" nature of objects, and their “dynamism" in time. The Figure 1 illustrates the evolution of the beach between two different periods of time.
We present, first of all, the features of the model of erosion process, and the event of beach nourishment. Later on, we explain the quality problems and the resulting quality matrix.
Time period (t -1) Time (t) Compartments with fixed limits (dotted lines)
BS(t)
BD(t)
CL
Figure 1: Evolution of the beach between two dates, compartments and their limits Define the quality features when applicable
3.1. Features
3.1.1. Beach object (Appendix.1)
The problem concerns the localization of areas that need nourishment with sand. These areas are the object of interest for this study, and it is called beach object. The beach object is defined according to a certain number of constraints: it should be just above the sea level, a dry and non-vegetated place.
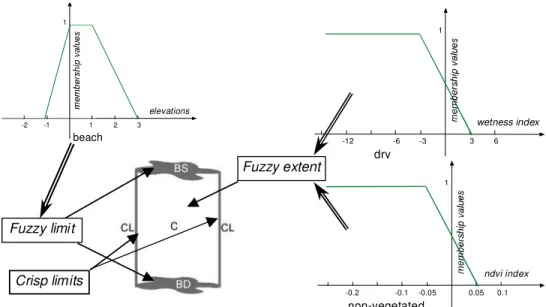
To define the beach object, different sources of information are used, which are Digital Elevation Model DEM and Landsat TM images (1989 to 2000). The determination of beach objects, according to the data (DEM), is carried out by applying a membership function µe to the elevation model, for
selecting places that have an elevation between 0 and 1.
In addition, the dry and non-vegetated places are identified, using Landsat TM. More precisely, to indicate if the beach is dry or wet, we use wetness index values (Christ and Cicone, 1984). These values are derived from a tasseled cap transformation, whereby positive wetness values indicate wet beach areas, and negative values indicate dry beach areas. In the case of beach areas there is not a clear distinction between wet and dry, and we incorporate a transition zone to define the vagueness of this parameter. Hence, membership values for wetness are 1 for dry areas, and 0 for wet areas, and ranges between 0 and 1 for the transition zones.
Furthermore, to identify non-vegetated object, we apply a membership function (MF) µv on NDVI
values: NDVI index has to be negative, close to 0.
-3 -6 3 6 dry wetness index 1 -12 -1 -2 1 2 3 beach elevations 1 -0.05 -0.1 0.05 0.1 non-vegetated ndvi index 1 -0.2 Fuzzy limit Fuzzy extent Crisp limits
Figure 2: Compartment, Limits and their various fuzzy membership functions.
In summary, the beach object must satisfy the constraints of elevation µe, dryness µw, and of
non-vegetation µv. The min operator on three membership functions forces the satisfaction of all the
constraints. Equation 1 shows the membership function for the beach object, calculated from membership functions µe, µw, and µv .
First, the determination of beach object provides the study area, and determines the fuzzy limits that change over time, between sea and beach (BS), and beach and dune (BD). Moreover, to identify places that require nourishment at a certain period of time, the beach object is partitioned into study units called compartments (C). The creation of compartments takes into account the ground reality of beach object, but also takes into account some constraints from the Dutch government (Rijkswaterstaat). This is related to the places of sand discharge, which are carried out according to some limits fixed by the government (CL), and also related to places where elevation measures are taken.Those crisp limits are fixed in time, perpendicular to the littoral, and large of 100-200 meters.Therefore, thecompartments of the beaches are delimited by dynamic fuzzy limits (BS (t), BD (t)), and static limits CL. These limits are illustrated in figure 2.
3.1.3. Thematic and quantitative attributes (Appendix.3)
The volume of sand per compartment C.vol(t) is the most important attribute of the application. It is determined by the following function.
C.vol(t) = e(x,y,t) µC (x,y,t) dxdy (2) = e(x,y,t) C(x, y) min{µe (x,y,t), µv(x,y,t), µw(x,y,t)} dxdy (3)
The calculation of this volume depends on elevation e, and also on the membership function µCof the
beach compartment, which is defined from fixed crisp departments limits C
, and membership
functions on elevation µe , vegetation index µv , and wetness index µw, as seen in 3.1.1.
3.1.4. Relation, State, Process, and Event
- Topological relation (Appendix.4)
The compartments form a partition of the total beach area. CL limits are shared between two adjacent compartments. BS(t) and BD(t) are contiguous between compartments.
- Temporal topological relation (Appendix.5)
CL limits remain fixed in time. On the other hand, the limits BS(t) and BD(t) change from one state
to another. The limit BD is more stable than BS.
- Temporal consistency relation (Appendix.6)
One requires having a sufficient number of valid values for e, µe, µw(t) and µv(t), and sufficiently well
distributed over the period, to approximate correctly the volume.
- Temporal quantitative relation (Appendix.7)
The evolution of sand volume per compartment between two periods ( C.vol (t) - C.vol (t-1) ).
- State (Appendix.8)
A “state” of the coast-line is established and made comparable to a “basic coast-line”, based on data taken from Digital Elevation Model DEM and Landsat TM images, each year between 1989 and 2000 (Van de Vlag et al, subm).
- Process of erosion (Appendix.9)
The sequence of states collected between 1989 and 2000, allows identifying some geomorphological processes such as erosion, transport and sedimentation of sandy materials. These are causing major changes to the coast of Ameland, in particular at the northwestern part of the island, which is a geomorphologically highly active area. The different states are used to approximate the continuous model of the process of erosion and beach nourishment. More precisely, a process of erosion exists between two periods (t) and (t-1), when the slope of volume evolution is negative (C.vol (t) - C.vol (t-1) < 0), and that current volume is below a reference value measured in 1990.
- Event of beach nourishment (Appendix.10)
Sand nourishments have to be carried out to counteract beach erosion. Two constraints determine it. The first constraint is that a compartment, or a group of adjacent compartments, are exposed to
structural erosion. The second constraint, for a compartment or a group of adjacent compartments, is that the volume of sand needed for nourishment, i.e., the volume of sand lost in erosion, should exceed 0.2 Mm3.
3.2. Quality matrix
3.2.1. Quality matrix for a state
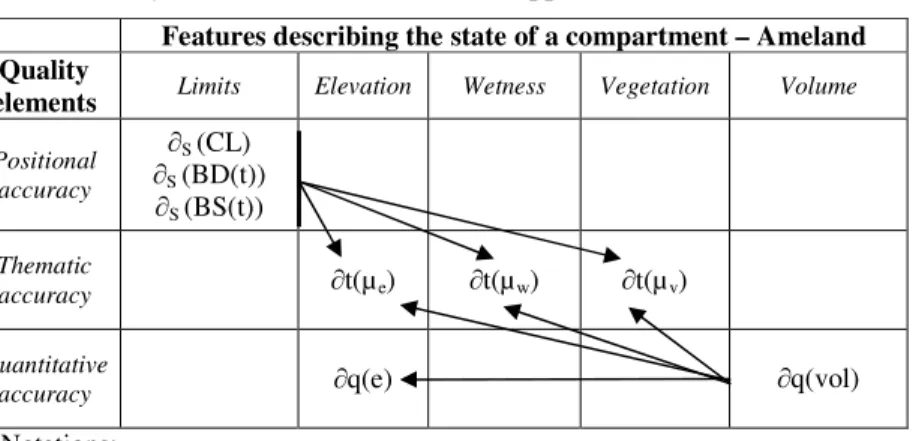
Table 2: Quality matrix for a state (Ameland application)
Features describing the state of a compartment – Ameland Quality
elements Limits Elevation Wetness Vegetation Volume
Positional accuracy S (CL) S (BD(t)) S (BS(t)) Thematic accuracy t(µe) t(µw) t(µv) Quantitative
accuracy q(e) q(vol)
Notations:
-quality values: y(x), where “x” indicates the feature, and “y” indicates the quality element.
-inferred values: q(vol) q(e), indicates dependency between values: q(vol) is inferred by q(e)
Discussion:
The above matrix of quality indicates, for a given state, and for a given compartment, the various quality values, and inferences. For instance the quantitative accuracy of the volume computed by equation (1) depends on:
- the quantitative accuracy of elevation q(e).
- the qualitative accuracy of elevation t(µe), of wetness t(µw), and of vegetation t(µv).
In addition, the thematic accuracy of classification of the beach object infers the positional accuracy of the spatial fuzzy limits S(BS(t), BD(t)).
3.2.2. Quality matrix for a process
Different states are used to define the process of erosion. Hence, the matrix of quality on table 3 takes into account different states which are indicated below.
Ž(vol)
Ž(w)
Ž(v)
Ž(e)
Ž(C)
Ž(e)
Ž(vol)
Ž(C)
Ž(w)
Ž(v)
Ž(vol)
Ž(e)
t1
t2
tn
Temporal consistencyOntology features for a process and model – Ameland application Quality elements Rel
State Rel C limits Rel wetness index Rel vege index Rel volume Completeness C Positional accuracy s(CL) s(BD(t)) s(BS(t)) Thematic accuracy t(µe) t(µw(t)) t(µv(t)) Quantitative accuracy q(e) q(vol (t))
The decomposition of the erosion model emphasizes several quality elements that have to be taken into account for defining quality of processes in the Ameland application. The Landsat images used to specify these various states were not taken at the same time in the year, neither in the month, nor in day-time. In this sense, the effects of tide and season are not the same, which influence wetness index and vegetation index. Therefore, it influences the analysis of the evolution of fuzzy limits per compartment, and also the evolution of the volume of sand. Hence, it is necessary to consider these problems of temporal quality for better modelling the erosion process.
The calculation of volume is an aggregate, since it is a time and space integration: - Time integration,
One requires to have a sufficient number of valid values for e, µe, µw(t) and µv(t), and sufficiently
well distributed over the period, to approximate correctly the volume. These conditions define the "temporal consistency" for each of the three variables { q(e), ( t(µw(t)), t(µv(t))}. (the diagonal arrow
in Fig.3). More precisely:
- for wetness, there are two important factors, the relative hour compared to the last tide, and the recent weather events. If necessary, an information from “ephemeredes” can help to "validate" each value, the condition being of having the maximum of observations in similar situation of tide;
- for vegetation, the relative date in the season is important: the constraint is to have the maximum of observations in the same season.
4. Conclusion
This paper describes an extension to the “ontological approach” presented in previous work. The extension addresses two important issues in the conceptualisation and representation of spatial objects: the issue of undeterminate boundaries and the issue of dynamic situations. The related quality questions are particularly important in these two issues.
There are several assumptions made in this paper:
(i) a sub-list of quality elements from the ISO definition of quality for geographical data, is appropriate for describing the quality requirements of a geographical application;
(ii) each feature representing an elementary item of the application ontology (objects, relation, process etc.) can be linked to one or several quality elements by some binary relation (quality matrix);
(iii) the influence of time can be represented by a series of such quality matrices, and dependencies between values can be represented in a spreadsheet tool.
Of course, these assumptions are somewhat restrictive, may be too much, and deserve to be further explored and replaced by a more complex approach. But this is a first step in the support for building quality aware ontologies for a geographical application.
The work has been experimented on a particular application, for coastal monitoring in the North of Holland, but we do believe that it can be repeated for several other applications. I should be possible to start thinking about establishing several “ontology templates” which may be useful when browsing criteria in a Spatial Data Directory, to help finding suitable data for an application.
The idea is to look for similar couples (feature , quality element) which may occur between two application, and to compare their behaviour (possible time sequence, possible dependencies). A candidate ontology can therefore be “mimicked” by the closest ontology template, what would greatly help a user in his process of conceptualing and editing his candidate ontology for his problem.
The publication of an ontology, provides the semantics of the terminology, and helps integrating database schema and consistency constraints that come from different sources (Frank 2003). The publication is proposed in the form of a series of “state- by-state quality matrices”. Its main advantage is that it formalizes the processes in a comprehensible form, taking into account the current standards of quality, and integrating the temporal dimension, objects with fuzzy limits, and even including some rules of inference.
Finally, our methodology aims to reach the best possible agreement between the needs expressed by a geographical application concerning vague objects by nature, and available numerical data.
Acknowledgments
The authors make a point of thanking the European Community, for its financing, through contract IST-1999-14189, project REV!GIS of the program IST ‘Future & Emerging Technologies”(June 2000, June 2004)
References
CEN/TC-287 (1994/1995). WG 2, Data description: Quality. Working paper N. 15, August 1994. PT05, Draft Quality Model for Geographic Information, Working paper D3, January 1995.
Crist E. P. and Cicone R. C. (1984), A physically-based transformation of thematic mapper data; The TM Tasseled Cap, IEEE Trans. Geosci. Remote Sens., GE-22 256–263.
Claramunt Christophe, P. C., Thériault Marius (1997). "Design Patterns for spatio-temporal Processes." Comber, mber, A. F., P.F.; Wadsworth, R.A. (2003). “A semantic statistical approach to negotiating
heterogeneous ontologies.”
FGDC (2000). Content Standard for Digital Geospatial Metadata Workbook, 122 p.
Fisher (2003). Data quality and Uncertainty: Ships passing in the night. ISSDQ'2003 Proceedings, Hong Kong. Frank, U. (subm). "A linguistically justified proposal for a spatio-temporal ontology”
Galton, A. (2000). Qualitative Spatial Change. New York, Oxford University Press.
Goodchild, M. et Jeansoulin R. (1998). Data Quality in Geographic Information. from Error to Uncertainty. (Jeansoulin & Goodchild,. eds) Paris, Editions Hermes, 192 p.
Gruber, T. R. (1993). "A Translation Approach to Portable Ontology Specifications." Knowledge Acquisition 5 (2). pp 199-220.
Guarino (1995) edited by N.Guarino and R.Poli, "Formal Ontology, conceptual analysis and knowledge representation." International Journal of Human and Computer Studies.
Guptill, C. et Morrison L (1995). Elements of spatial data quality. New York, Elsevier Science inc, 201p. Hunter, G. J. (2001). "Spatial Data Quality Revisited." Symposium, Rio de Janeiro, Brazil, 4-5 October 2001. ISO (2003). "ISO/TC 211 Geographic information/Geomatics - 19113, 1914, Geographic information quality;
evaluation procedures.
Jeansoulin, R. et Wilson, N. (2002). "Quality of Geographic Information: Ontological approach and Artificial Intelligence Tools in the REV!GIS project." 8th EC-GI&GIS Workshop, Dublin 3-5.
Joos, G. 2003. Standardization of data quality measures. In: Proceedings of the 2nd international symposium on
spatial data quality ‘2003’. Eds. Shi, W., Goodchild M.F. and Fisher, P.F. pp 205-209. Laurini R. et Thompson D. (1992). Fundamentals of spatial information systems, the APIC series number 37,
Academic Press, 680 p.
Rindfuss, S. (1998). People and pixels, linking remote sensing and social science, national research council, national academy press, 244 p.
Roelse (2002). Water en Zand in Balans. Evaluatie zandsuppleties na 1990; een morfologische beschouwing. Internal Report Rijksinsituut voor Kust en Zee, Middelburg, The Netherlands.
Van de Vlag D., Vasseur B., (subm). "An application of problem and product ontologies for coastal movements." Vasseur, B. Devillers, R. (2003). "Ontological Approach of the Fitness of Use of Geospatial Datasets." In
Proceedings of 6th AGILE Conference, Published by Presses Polytechniques et Universitaires Romandes: pp: 497-504.
µv(x,y,t) / NDVI negative close to 0
2. Spatial attributes Compartment limits Crisp limits : CL Fuzzy limits :
BS.(t) , BD.(t)
- CL: fixed, perpendicular to the littoral
- BD(t): t ∈ {1989…2000}, {BD.elev (t) around [0, 1m], and NDVI negative, close to 0} - BS(t): t ∈ {1989…2000}, {BD.elev (t) around [0, 1m], and wetness index negative, close to 0} 3. Thematic and
quantitative attributes C.vol(t) C.vol(t)= e(x,y,t) µ
C
(x,y,t) dxdy
4. Topological relation
Rt Adjacency of compartments, one limit beach dune, one or two limits beach sea 5. Temporal topological relation Rt(t) - CL fixed; - BS(t) et BD(t) dynamic 6. Temporal consistency relation
Rc(t) Sufficient number of valid values for e, µe, µw(t) and µv(t), and sufficiently well distributed over the
period, to approximate correctly the volume. 7.Temporal
quantitative relation
Rq(t) Evolution of C.vol (t)- C.vol (t-1)
8. State St Several data defining different states. These states are used to approximate the continuous model of
the erosion process .
9. Process of erosion P Approximation of the "states" to a continuous model of erosion. C.vol (t)- C.vol (t-1) < 0 and C.vol (t)< C.vol (1990)
10. Event of beach nourishment
Ebn Constraint n.1 : Process of erosion
Constraint n.2 : For a compartment or a group of adjacent compartments, the volume of sand needed for beach nourishment, should exceed 0.2 Mm3.