HAL Id: hal-01730723
https://hal.archives-ouvertes.fr/hal-01730723
Submitted on 13 Mar 2018
HAL is a multi-disciplinary open access archive for the deposit and dissemination of sci-entific research documents, whether they are pub-lished or not. The documents may come from teaching and research institutions in France or
L’archive ouverte pluridisciplinaire HAL, est destinée au dépôt et à la diffusion de documents scientifiques de niveau recherche, publiés ou non, émanant des établissements d’enseignement et de recherche français ou étrangers, des laboratoires
Experimental and ab initio study of the O_3 detection
at the CuO (111) surface
Vincent Oison, Hela Ouali, Caroline Lambert-Mauriat, Michel Freyss
To cite this version:
Vincent Oison, Hela Ouali, Caroline Lambert-Mauriat, Michel Freyss. Experimental and ab initio study of the O_3 detection at the CuO (111) surface. Surface Science, Elsevier, 2014, 622, pp.44 -50. �10.1016/j.susc.2013.12.003�. �hal-01730723�
Experimental and ab initio study of the O
3detection at
the CuO (111) surface
Vincent Oison, Hela Ouali, Caroline Lambert-Mauriat
Universit´e Aix-Marseille, Institut Mat´eriaux Micro´electronique et Nanosciences de Provence (IM2NP), UMR-CNRS 7334, Facult´e des Sciences de Saint J´erˆome, Case 151,
13397 Marseille Cedex 20, France
Michel Freyss
CEA, DEN, Centre de Cadarache, DEC/SESC/LLCC, Bˆatiment 352, 13108 Saint-Paul-lez-Durance, France
Abstract
Combining experiments and first-principles calculations, we present in this paper a detailed study of the O3 detection mechanism on the CuO (111)
surface. The exchange-correlation functional is treated within both the LDA and the GGA including the spin polarization. In order to better take into account the on-site electronic interactions between 3d electrons of Cu atoms a Hubbard term U has to be added in all calculations. We show that the O3
molecule is reduced to a O2 molecule with an enthalpy of reaction of −1.11
eV (−1.15 eV) within LDA+U (GGA+U). Along the reaction path, the O3
molecules are first physisorbed with a large adsorption energy of −1.83 eV (−1.03 eV) and a significant charge transfer from the surface to the molecule. The p-doping strengthening is compared to the electrical response of a CuO based sensor under O3 exposure.
Keywords: CuO surface, O3 detection, gas sensor, DFT+U calculations
1. Introduction
Due to their technological compatibility, low cost and wide range of ap-plications, Metal Oxide (MOx) semiconductors have been largely used as sensing layer of microelectronic devices. [1, 2] The purpose of these sen-sors is the detection of gases such as O3, NOx, CO, NH3, C2H5OH, ... and
the measurement of their concentration in the atmosphere. The sensitive layer of the sensor device consists in n-type semiconductors MOx such as WO3, SnO2, ZnO, TiO... [3–17] or p-type ones such as CuO, Cu2O, Cr2O3,
SrTi1−xFexO2... [18–24]. From an industrial point of view, the mostly used
sensors are mainly based on n-type semiconductors. Therefore, a lot of stud-ies have focused on the improvement of the performances of these oxide layers and consequently their detection mechanism is well documented.
In most cases, the sensing properties are monitored by a variation of the electrical conductivity resulting from adsorption and following oxido-reduction reaction of the gas at the sensor surface. [25–27] In the case of WO3 based sensor devices, the doping of the sensitive layer depends on the
oxidation degree of the surface [28] which is modified by the adsorption of gas molecules. [29] Thus the gas detection principle is related to the variation of the electrical resistance of the MOx. In the case of CuO nanowire based devices, it was recently shown that the detection of reducing gases such as CO or ethanol involves a notable increase in the electrical resistance. [22–24] It was supposed that the detection mechanism of oxidizing gases such as O3
The relationship between conductivity variation and microscopic adsorp-tion mechanism of the toxic gases has to be clarified. For that purpose ab initio calculations are well suited. Our aim is to interpret the electrical re-sponse of the target gases at the atomic scale. In this paper we focus on the adsorption and the dissociation of O3 molecule on the (111) surface of
CuO, which has been determined by X-ray diffraction as the most stable surface of the tenorite. [24] At room temperature, CuO is monoclinic (space group C2/c) and the unit cell contains 4 CuO unit formulae. The experi-mental lattice constants are a = 4.684 ˚A, b = 3.423 ˚A, c = 5.129 ˚A, and β = 99.54◦. [30] In addition, this MOx is substoichiometric in Cu at low temperature, increasing the p-doping of the material. [31]
Although the Density Functional Theory (DFT) relatively well describes the geometrical structure of Mott insulators such as NiO [32] or UO2 [33–
35], it fails to describe correctly their electronic structure. In the case of CuO, which is known as a Mott insulator, DFT calculations predict a metal-lic and non magnetic ground state, whereas the band gap experimentally ranges from 1.2 to 1.9 eV, [36–39] and an antiferromagnetic order on the Cu atoms is found (± 0.65 µB per unit formula CuO). The failure of the
standard DFT, within the framework of the local density (LDA) or general-ized gradient (GGA) approximations, comes from the poorly description of the on-site electronic correlations between 3d electrons of Cu atoms. [40] In order to overcome this difficulty, one can use different solutions: SIC (self
interaction correction) method, [41] DFT using hybrid functionals, [42, 43] DFT+U calculations, [32] or DFT+DMFT (dynamical mean field theory) calculations. [44] The DFT+U method is the only one which allows surface studies with reasonable computational times. Wu et al. [45] showed that the LDA+U restores correctly the bulk properties of CuO. For these reasons, we have opted for simulations within the framework of DFT+U using the SIESTA code. [46, 47]
In the case of n-type WO3 based sensors, we showed previously that the
O3 molecules are reduced into O2 on a O vacancy of the surface. [28, 29] In
the case of p-type CuO based sensors working under O2-rich conditions, the
reducing mechanism should not involve O-vacancies according to experiments which indicate that CuO is substoichiometric in Cu atoms. [31] We show here that O3 molecules strongly interact with the surface. This involves a charge
transfer from the surface to the molecule, leading to the formation p charge carriers at the top of the valence band. An experimental characterization of the sensing properties of CuO is proposed and discussed on the base of our ab initio results.
The paper is organized as follows: we first introduce the computational procedure (in particular the parameters of the supercell method) and the experimental techniques. In order to validate our computational parame-ters, bulk properties are first compared to experiments. After ensuring that the (111) surface is the one mainly observed by X-ray diffraction, the for-mation of neutral point defects at the surface is studied in section 4. We
highlight that the O adatom and Cu vacancy are the most relevant defects under O2-rich condition which is the initial condition prior to O3detection in
our experiments. This result allows us to discard O-vacancies as adsorption sites for O3 molecules. In section 5, we detail the adsorption-dissociation
mechanism of the O3 molecule on the clean (111) CuO surface. We finally
use our theoretical results to interpret the measured electrical response of CuO under O3 exposure.
2. Computational details
2.1. DFT calculations
Ab initio calculations are performed within the framework of the DFT using the SIESTA implementation [46, 47]. The core electrons are treated within the frozen core approximation in which norm-conserving Troullier-Martins [48] pseudopotentials, including nonlinear core corrections, are used for each atomic species. In all calculations, spin polarization is allowed. The exchange-correlation potential is treated both within the local density approximation (LDA) and within the generalized gradient approximation (GGA) using the parametrization by Perdew-Burke-Ernzerhof. [49] The wave function of the valence electrons (i.e. 2s22p4 for O and 4s23d9 for Cu) is
ex-panded onto a localized basis set consisting in finite–range pseudo–atomic orbitals. [50] We used a double–ζ basis in which each atomic valence state is described by two localized wave functions. Additionnal 3d orbital for O and 4p orbital for Cu are included to allow for polarization.
CuO is known as a Mott insulator in which valence and conduction bands mainly consist in 3d states of Cu atoms. Also it is well known standard LDA (or GGA) fails to describe the strong on-site correlations between 3d elec-trons. Thus, to better take into account these interactions, we perform all the calculations within the framework of the DFT+U following the scheme proposed by Dudarev et al. [32] It consists in adding a Hubbard term U and an exchange term J for the 3d electrons. In our calculations, we take the values proposed by Wu et al.: [45] U = 7.98 eV and J = 0.98 eV. Those values give a satisfactory description of the bulk properties of CuO as will be confirmed hereafter.
It is now well known that the DFT+U method induces the existence a local energy minima (or metastable states) in which the calculations can be trapped. This was shown for rare earths [51], rare earth oxides [52] and nitrides [53], and actinide oxides. [35, 54] We have checked that our calcula-tions for CuO were not affected by this issue by performing tests using the occupation matrix control scheme (OMC) [35] developed for f compounds and adapted here d compounds. By testing various configurations of the Cu 3d orbital occupancy for the bulk CuO crystal we find that all calculations converge to unique ground state, contrary for instance to what was found for bulk UO2. [35] We thus infer that the DFT+U calculations reported here for
CuO surfaces will not be affected by the issue of metastable state.
along the [111] direction and defined by the following vectors: u1 = 2(b − a) u2 = 2(c − a) u3 = a + b + c
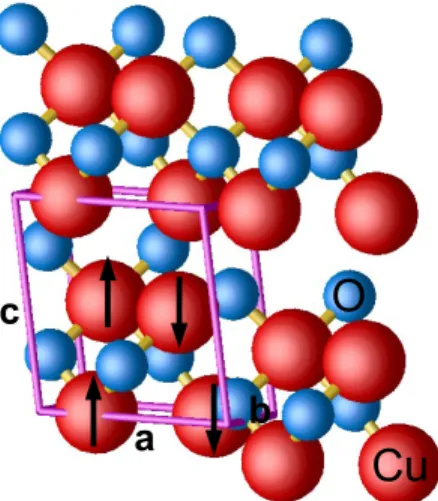
where a, b and c are the lattice vectors of the optimized monoclinic unit cell as represented in Figure 1. The clean (111) surface (i.e. without any adatom, vacancy or adsorbed molecule) is simulated by a CunOn slab
containing n = 48 CuO unit formulae. This slab consists of three atomic layers of 16 CuO each along the [111] direction. A vacuum width of 15 ˚A is added along u3 in order to lower the electronic interactions between two
adjacent slabs. In all cases, a 4×4×1 k-mesh grid is used: four k-points along each direction of the reciprocal space parallel to the surface and one k-point along the direction of the substrate. The geometrical relaxation procedure consists in relaxing atomic positions with a maximum force tolerance of 0.02 eV/˚A on each atom. In all calculations, the defects are created and molecules adsorbed on the top layer of the slab and their concentration at the surface is equivalent to 1/16. In addition, the atomic positions of the bottom layer are frozen in the equilibrium geometry of the clean surface.
2.2. Bulk properties
In order to validate the numerical parameters, the bulk properties of the monoclinic CuO are simulated and compared with previous calculations and experiments. In our calculations the length of the cell parameters are optimized, keeping the β angle constant. Our results are reported in Table 1. The cohesive energy Ecoh
CuO and formation enthalpy H f
Cu
O
a
b
c
Figure 1: Representation of the monoclinic structure of CuO. Copper and oxygen atoms are represented by red and blue spheres respectively. The antiferromagnetic order within the monoclinic unit cell (purple tubes) is represented by up and down arrows.
follows:
ECuOcoh = Ebulk(CuO) − E(Oat) − E(Cuat). (1)
and,
HCuOf = Ebulk(CuO) − 1
2E(O2) − E
bulk(Cu). (2)
In these equations Ebulk(CuO) is the total energy per unit formula of the
monoclinic CuO, Ebulk(Cu) is the total energy of the fcc phase of Cu, E(O2)
is the total energy of the triplet state (S = 1) of O2 and, E(Oat) and E(Cuat)
are the atomic energies of O and Cu. In the cases of bulk and atomic Cu, the calculations are performed using the DFT+U method.
paramaters whereas the LDA+U slightly underestimates them. Nevertheless, in comparison with previous LDA+U calculations by Wu et et al. [45], our results are in better agreement with experiments. The difference between the results comes from the choice of electron basis set and pseudo-potential. The calculated electronic structure gives an indirect gap between Γ and D (a∗/2,0,c∗/2) of 1.21 eV (1.30 eV) within the LDA+U (GGA+U). Both func-tionals give an antiferromagnetic ground state with a local magnetic moment of ±0.63µB per Cu atom. The calculated cohesive energy and formation
en-thalpy are 25 per cent larger within the LDA+U than the ones from the GGA+U. Let us note that the experimental value of the formation enthalpy is about the average value approximately.
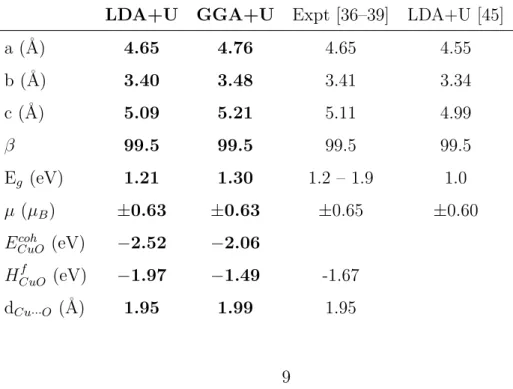
Table 1: Bulk properties of the C2/c monoclinic CuO: lattice parameters a,b,c and β = (a, c), band gap Eg, local magnetic moment on Cu atoms, cohesive energy ECuOcoh per
Cu–O bond, formation enthalpyHfCuO per CuO unit formula, and average dCu···O bond
length. Comparison between DFT+U results (LDA and GGA) and experiments.
LDA+U GGA+U Expt [36–39] LDA+U [45]
a (˚A) 4.65 4.76 4.65 4.55 b (˚A) 3.40 3.48 3.41 3.34 c (˚A) 5.09 5.21 5.11 4.99 β 99.5 99.5 99.5 99.5 Eg (eV) 1.21 1.30 1.2 – 1.9 1.0 µ (µB) ±0.63 ±0.63 ±0.65 ±0.60
ECuOcoh (eV) −2.52 −2.06
HCuOf (eV) −1.97 −1.49 -1.67
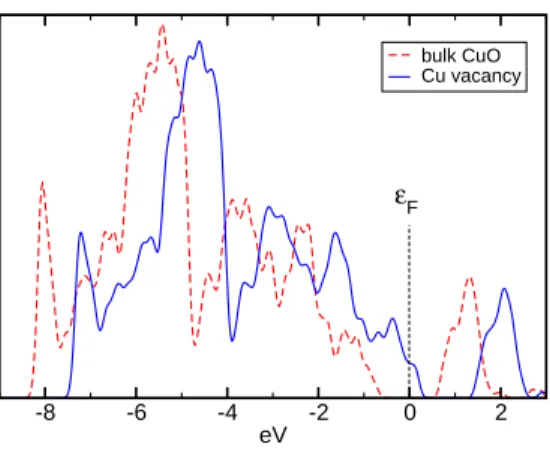
As shown experimentally, CuO is substoichiometric in Cu atoms at low temperature. [31] This plays a key role on the electronic properties of the material, in particular on the p-doping. In order to characterize the effect of the substoichiometry on the electronic structure, we have calculated the DOS (see Figure 2) by using supercells consisting in a unit cell doubled along the three lattice vectors. Thus the supercell without any defect contains 64 atoms (32 CuO unit formulae). Considering the Fermi level fixed to 0 eV, the Cu vacancy involves a 1 eV shift of the band structure towards higher energies. Thus, the formation of p charge carriers at the top of the valence band is clearly highlighted.
-8 -6 -4 -2 0 2
eV
bulk CuO Cu vacancy
εF
Figure 2: Calculated density of electronic states (DOS) of CuO. Comparison between the supercell containing 64 atoms without any defect (red dashed line) and the one with one neutral Cu vacancy (blue solid line). In all cases the Fermi level εF is chosen as the
3. Experiments
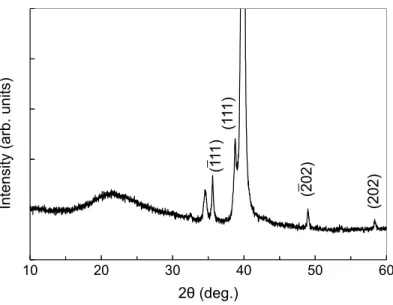
The copper oxide films are prepared by standard radio frequency (r.f.) magnetron sputtering system from a metallic copper target and argon gas with a flow of 0.03 l.min−1and a total pressure of 2.10−3mbar. The r.f. power is set at 30 W. The films are deposited during 6 minutes onto a 0.5×0.5 mm2 Si/SiO2 substrates containing interdigitated platinum electrodes. They are then annealed under ambient air at 450 C during two hours. After annealing, the structural characterization of the obtained films is carried out using an X-ray diffractometer (Xpert MPD), in 2θ range of 10◦-80◦, with a scan-rate of 0.02 s−1, using Cu-Kα radiation (λ = 1.5418 ˚A). We obtain the
pattern presented in Figure 3. The large peak around 40◦ is attributed to the platinum electrodes. All the other peaks correspond to the different planes of the monoclinic CuO, according to the 08-089-5898 reference pattern from ICSD, [55, 56] excepted the one at nearly 35◦. Its origin is not yet clear and it should be attributed to an interface ternary phase made of Cu, O and Si atoms. Let us note that the intensity of the (111) plane is larger than the (-111) one, contrary to the relative intensities of the reference database. This indicates that the {111} planes are favoured in our deposited film of tenorite CuO.
For the sensing measurements under ozone, the CuO based sensors are mounted on a heater chamber. The heater is controlled by a regulated DC power supply providing operating temperature of 250 C (Eurotherm 903P). Output resistance of sensors as a function of time is recorded using a source-meter (Keithley 6340), while the gases are continuously flown through the chamber at a total flow rate of 0.5 l.min−1(500 sccm), stabilized by a numeric
10 20 30 40 50 60 2! (deg.) In te ns ity ( ar b. u ni ts ) (1 11 ) (1 11 ) (2 02 ) (2 02 )
Figure 3: X-ray diffraction pattern of the sensing CuO layer. The indexed planes corre-spond to those of the monoclinic CuO according to the 08-089-5898 file from ICSD.
flow-meter (Brooks 5851S). The ozone is generated by a UV discharge lamp (UVP) calibrated using a concentration analyzer (Seres oz 2006).
4. Point defects at the CuO (111) surface
In this section a study of the relative stability of simple neutral point defects at the surface is reported. We consider here O2-rich conditions since
the detection experiments of O3 molecules are performed under such O2-rich
conditions. It is thus the interaction of O2 molecules with the CuO surface
which defines the nature of the defects at the surface before O3 adsorption.
We focus on the formation of O and Cu vacancies and adatoms. The first layer of the clean (111) slab is represented in Figure 4(a). This atomic layer
presents an antiferromagnetic order in which rows of high magnetized Cu atoms (+ 0.65 µB) alternate with rows of low magnetized Cu atoms (− 0.65
µB). In addition, we denote two geometrical conformations for the Cu atoms
at the surface: the first one (labeled CuIV in Fig. 4) corresponds to Cu bonded with four oxygen atoms located in the surface plane and the second one (labeled CuIII) to Cu bonded with three O atoms : two in the surface plane and one belonging to the lower atomic layer. As shown in figure 4(b), the Cu vacancy formation at the surface consists in removing a CuIII atom since we have found that removing a CuIV leads to an unstable
configura-tion. The most stable conformation for the Cu adatom is obtained when the adatom is bonded with two oxygen atoms along a CuIV row. The most stable
conformations of the oxygen vacancy and adatom are also represented. The defect formation equations are obtained from the clean (111) surface and O2 molecule in gas phase. First, a Cu vacancy (VCu) is obtained when
an oxygen atom in gas phase transforms itself into a surface oxygen Osurf,
1
2O2(g) → Osurf + VCu. (3) The formation of a Cu adatom (Cuad) is obtained from the conversion of a
surface CuO unit formula to a Cuad accompanied by O in gas phase according
to
CuOsurf → Cuad+
1
2O2(g). (4)
An oxygen vacancy (VO) is obtained at the surface from the desorption of
an Osurf atom,
Osurf → VO+
1
2O2(g). (5)
CuIII row CuIV row
Cu↑ row Cu↓row
CuIII vac. O ad.
O vac. Cu ad.
(a) (b)
[-101] [-110]
Figure 4: (a) top view of the (111) surface of CuO: Cu atoms of high (low) magnetization are represented by red (blue) spheres and O atoms by black spheres. For clarity the [¯110] and [¯101] perpendicular directions to the (111) surface are indicated by purple arrows (b) Location of the four studied O and Cu point defects (i.e. vacancy and adatom).
oxygen atom of the air as follows 1
2O2(g)→ Oad. (6) The corresponding formation enthalpies Hf can be determined from DFT
calculations using slabs with n = 48 CuO per supercell including or not a point defect, leading to the following approximations:
HVf Cu ≈ E(Cun−1On) − n − 1 n E(CunOn) − µO HCuf ad ≈ E(Cun+1On) − n + 1 n E(CunOn) + µO HVf O ≈ E(CunOn−1) − E(CunOn) + µO HOf ad ≈ E(CunOn+1) − E(CunOn) − µO (7)
The oxygen chemical potential at the surface µO depending on the partial
pressure of O2, we consider two boundary conditions: (i) in O2 saturated
atmosphere (O2-rich condition), µO reaches an upper limit corresponding to
the chemical potential of O atom in O2; (ii) in O2-poor atmosphere, µO
reaches a lower limit corresponding to the chemical potential of O atom in CuO bulk. This leads to the relation:
1 2E(O2) + 1 3H CuO f ≤ µO ≤ 1 2E(O2), (8) where E(O2) is the total energy of the triplet state (S = 1) of O2 and HfCuO
the formation enthalpy of CuO. Due to the well known overbinding of O2
molecule obtained by DFT, [57] the formation energies of point defects and oxygen adsorption energy could be affected by an error. This error can be corrected with the difference between the calculated and experimental bind-ing of the O2 molecule. In our calculations, this leads to correct the value
of µO by +0.65 eV within GGA. This error can be also corrected, as
sug-gested by Wang et al. [58], by fitting a correction to the formation enthalpy of metal oxides. In this case, the correction to the value of µO amounts to
0.7 eV within GGA+U, but no correction value was reported for LDA+U.
In Table 2, we report the formation energies of surface point defects as cal-culated without correction for the O2 molecule within LDA+U and GGA+U
and with the correction of 0.7 eV for the GGA+U values of µO as proposed
by Wang et al. [58], which is also consistent with the error on the GGA dissociation energy of O2.
For both functionals, the most stable defects in term of enthalpy for-mation correspond to the O adatom and the Cu vacancy under O2 -rich
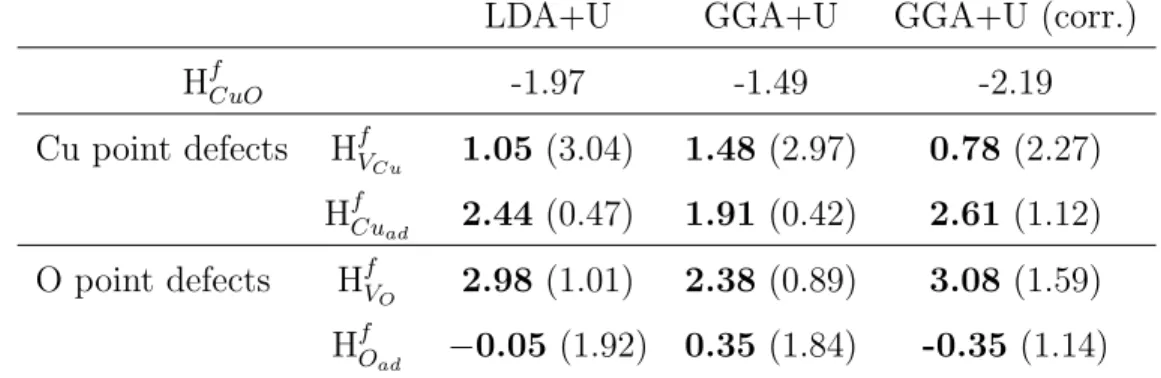
Table 2: Thermodynamics of the neutral point defects (O and Cu vacancies and adatoms) at the (111) surface of CuO. All values are given in eV under O2-rich and (into brackets)
under O2-poor conditions. Comparison between LDA+U and GGA+U. The third column
correspond to the corrected GGA+U values as suggested by Wang et al. [58]
LDA+U GGA+U GGA+U (corr.)
HfCuO -1.97 -1.49 -2.19 Cu point defects HfV Cu 1.05 (3.04) 1.48 (2.97) 0.78 (2.27) HfCu ad 2.44 (0.47) 1.91 (0.42) 2.61 (1.12) O point defects HfV O 2.98 (1.01) 2.38 (0.89) 3.08 (1.59) HfO ad −0.05 (1.92) 0.35 (1.84) -0.35 (1.14)
condition. The value obtained for the O adatom (−0.05 eV within the LDA and 0.35 eV within the GGA) indicates that the surface easily reacts with ambient O2 of the surrounding atmosphere leading to the partial oxidation
of the sensitive layer. When taking into account the correction of µO, the
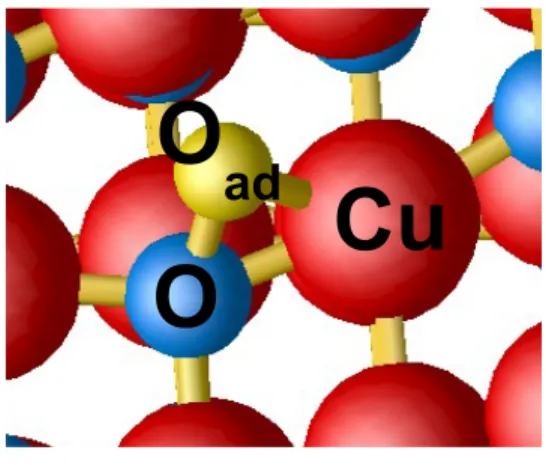
relative stability of the O adatom and Cu vacancy is even increased. The most stable conformation for the oxygen adatom is shown on Figure 5. The calculated Cu–Oad distance is 1.94 ˚A instead of 1.98 ˚A in the bulk and the
O–Oad distance is 1.59 ˚A within the GGA. In that conformation, the neutral
O adatom does not affect directly the calculated density of states around the band gap, and, consequently the p-doping of CuO.
Thus, all these results show that the CuO (111) surface under O2 rich
O
ad
Cu
O
Figure 5: conformation of the oxygen adatom (yellow sphere) on the (111) surface. The copper and oxygen atoms are represented by red and blue spheres, respectively.
5. Detection of O3 molecules
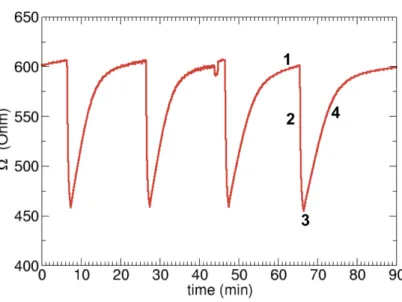
Electrical measurements of the Figure 6 give the response of the CuO-based sensor to O3 exposure. The basis line obtained in dry air amounts
to the low value of 600 Ohms. The sensor is cyclically exposed to 500 ppb O3 flux. In all cases, the response to O3 is instantaneous and reproductible.
After one minute, the resistance decreases down to the value of 450 Ohms. After stopping the O3 flux, the resistance returns to its initial value with a
recovery time of 15 minutes approximately.
Let us decompose the response of the Figure 6 in four steps:
1. We suppose that the step (1) correponds to the response of a clean surface interacting with O2 of the air. This leads to an equilibrium
concentration of O adatoms at the surface involving the substoichiom-etry in Cu atoms as shown previously. The O adatoms could recombine with O surface atoms and Cu vacancies at a surface step for example.
Figure 6: Electric response of CuO sensitive layer under 500 ppb O3 exposure in dry air
(1 bar) at 250 C.
Then, the diffusion of the Cu vacancies in volume induces a p-doping of the sensitive layer. Therefore, the resistance basis line is low. 2. O3 is injected in step (2) and the resistance decreases. The molecule is
physisorbed and its interaction with the sensing surface is characterized by the lowering of the measured resistance.
3. After a couple of minutes, the resistance reaches a minimum (not shown in Fig. 6) of 400 Ohms approximately. We suppose that an equilibrium occurs between physisorption of O3 molecules, dissociation at the
sur-face and desorption of O2 molecules.
4. In a final step, the O3 flux is stopped and the resistance returns to its
Ultimately, the dissociation of O3 molecules involves the reduction of the
surface following the chemical reaction:
O3(g) → O2(g)+ Oad, (9)
where the O3and O2 molecules are taken in gas phase and Oadis the resulting
adatom at the surface. The final reaction enthalpy obtained from calculations using supercell with n = 48 CuO unit formalae, is given by:
∆H = E(CunOn+1) + E(O2(g)) − E(CunOn) − E(O3(g)), (10)
where E(CunOn+1) is the total energy of the supercell with an O adatom
and E(CunOn) the one of the clean surface. The value of ∆H is almost
in-dependent of the choice of the functional (−1.11 eV the LDA+U and −1.15 eV within the GGA+U) and indicates the reaction is clearly exothermic. In order to understand the reaction mechanism, we have simulated the steps 2 and 3 of the detection mechanism. Thus, the step 2 corresponds to the physisorbed O3 molecule and the step 3 to the dissociated O2+O molecule
on a adsorption site of the surface.
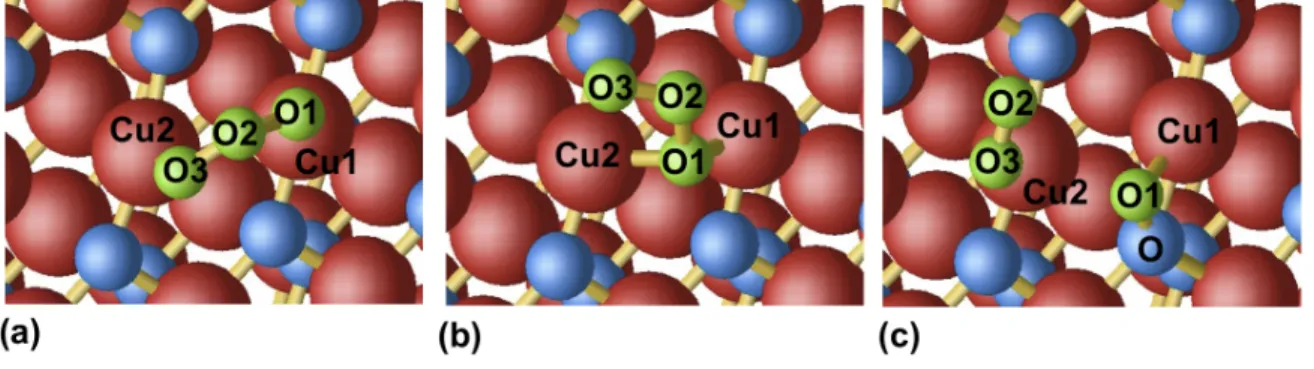
The Figure 7(a) shows the most stable configuration for the physisorbed of O3. In that conformation the molecule remains undissociated and the two
peripheral O atoms of the molecules are bonded with two adjacent copper atoms: the Cu–O bond lengths are found to be 2.04 ˚A (1.91 ˚A) within the GGA+U (LDA+U). They should be compared to the bond lengths in the bulk: 1.99 and 1.94 ˚A respectively. The formation of these Cu–O contacts induces a weakening of the intramolecular O–O bond lengths: irrespective of
the functionals, the O–O distances amount to 1.36 ˚A instead of 1.29 ˚A (1.27 ˚
A) within the GGA+U (LDA+U).
Figure 7: Representation of the conformations corresponding to: (a) the physisorbed O3
molecule; (b) the semi dissociated O3 molecule; (c) the dissociated molecule O + O2 at
the (111) CuO surface.
The adsorption energy Ead(O3) is obtained by substracting from the total
energy of the CuO slab interacting with O3, the total energy of the isolated
fragments. This gives,
Ead(O3) = E(CunOn, O3ad) − E(CunOn) − E(O3(g)) (11)
where n = 48 CuO per supercell. The calculated value of Ead(O3) is quite
large: −1.03 eV (−1.82 eV) within the GGA+U (LDA+U). The discrepancy of 0.79 eV between the two functionals is due to the underestimation (over-estimation) of the adsorption energy when using the GGA (LDA). Also, this can be related to the large difference between the two functionals on the Cu– O bond lengths. Nevertheless in all cases, the interaction is characterized by a significant charge transfer (CT) from the surface to the molecule. In term
of Mulliken charges, CT amounts to 0.55 e− (0.37 e−) respectively. One can conclude that in comparison with the LDA+U, the interaction is found to be less covalent and more ionic when using the GGA+U.
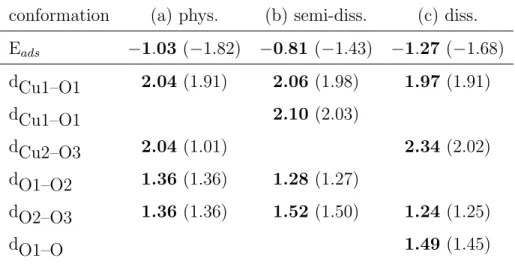
Table 3: Adsorption energy and bond lengthes of the different conformations of O3 on
the CuO (111) surface: (a) physisorbed; (b) semi-dissociated; (c) dissociated. Energies are given eV and bond lengthes in ˚A. The atom labels corresponds to those of figure 7. GGA+U values are given in bold and LDA+U ones into brackets.
conformation (a) phys. (b) semi-diss. (c) diss. Eads −1.03 (−1.82) −0.81 (−1.43) −1.27 (−1.68) dCu1–O1 2.04 (1.91) 2.06 (1.98) 1.97 (1.91) dCu1–O1 2.10 (2.03) dCu2–O3 2.04 (1.01) 2.34 (2.02) dO1–O2 1.36 (1.36) 1.28 (1.27) dO2–O3 1.36 (1.36) 1.52 (1.50) 1.24 (1.25) dO1–O 1.49 (1.45)
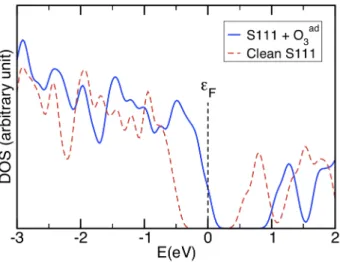
This CT involves a p-doping enhancement of the CuO film as shown by our DFT+U calculations. The Fermi level – originally located at the middle of band gap – is shifted by 0.51 eV (0.43 eV) within the GGA+U (LDA+U) towards the top of the valence band (VB). This shift is illustrated on the calculated DOS of the Figure 8. The top of the VB is partially emptied leading to the formation of p charge carriers. These results can be correlated to the electrical response of the sensing CuO layer of the Figure 6, in which a significant decrease in the resistance is observed when the gas sensor is exposed to O3 flux.
Figure 8: Calculated density of states of the CuO (111) slab interacting with an O3
molecule. GGA calculation using supercells with n = 48 CuO.
After O3 exposure, the return of the electrical response to its basis line
occurs in two steps: firstly, the O3 molecules are dissociated at the surface,
and secondly an O2 molecule is thermicaly desorbed. The dissociated
con-formation of O3 is shown in Figure 7(c), it corresponds to an O adatom and
an adsorbed O2 molecule on top of a same surface Cu atom. The binding
energy of the interacting fragments with the surface is −1.27 eV (−1.68 eV) within the GGA+U (LDA+U). The difference between the two functionals is due to large discrepancy on the desorption energy of O2: −0.12 eV within
the GGA+U instead of −0.58 eV within the LDA+U. In comparison with the DOS of the slab interacting with the non-dissociated O3, the p-doping
decreases leading to a shift of the Fermi level towards the conduction band. After a final desorption of an O2 molecule, the electron structure of the
re-maining system (i.e. CuO slab with O adatom) almost recovers the initial configuration of the clean slab (see section 4), leading to the vanishing of the p-doping.
Our simulations highlight an intermediate metastable conformation repre-sented in figure 7(b). In that conformation, the molecule is semi dissociated: the O1 oxygen is bonded with two Cu atoms of the surface (see table 3). In comparison with the physisorbed conformation O3, the O1–O2 distance
increases by 0.16 ˚A to 1.52 ˚A within the GGA+U, whereas the O2–O3 dis-tance decreases by 0.08 ˚A to 1.28 ˚A (let us note that the O–O distance in the O2 molecule is 1.24 ˚A). A very similar trend is obtained within the LDA+U.
The binding energy of the semi dissociated molecule on the surface which amounts to −0.81 eV (−1.43 eV) within the GGA+U (LDA+U), is 0.22 eV (0.33 eV) larger than the adsorption energy obtained for the physisorbed conformation. This gives an order of magnitude of energetic barrier corre-sponding to the transition state leading to the dissociation of the molecule at the (111) surface.
6. Conclusion
We have shown that the combination of experimental and theoretical DFT+U study is relevant in order to simulate the dectection mechanism of O3 molecules at the CuO (111) surface under O-rich conditions. X-ray
sensing devices. The surface energy calculations show that a slab consisting of three CuO layers along the [111] vector is large enough to obtain accurate description of the sensing layer and represents a good compromise in terms of computational time. In this study, we underline that the O-adatoms are formed easily at the surface under O2-rich conditions. Thus the CuO sensitive
film should be sub stoichiometric in Cu atoms as supposed experimentally. The recombination of these defects at the surface and the diffusion mecha-nisms in volume are still open questions, they should involve a significant Cu vacancy concentration in the film and, consequently, lead to the p-doping of this material.
The main purpose of this paper is the use of DFT+U calculations in order to highlight – at the atomic scale – the detection mechanism of O3 molecules
at the CuO (111) surface. Our theoretical results are used in order to discuss the electrical response measurements. We propose a three-steps dissociation mechanism in which the O3 molecule is first physisorbed at the surface with
a large adsorption energy. It results in a significant charge transfer towards the molecule leading to the formation of p charge carriers at the top of the valence band. This can be correlated to the resistance decrease of the sensitive layer under O3 exposure as observed experimentally. In a second
step the molecule is dissociated on top of a surface Cu atom involving an intermediate state corresponding to a semi-dissociated conformation O3. In
all cases, the involved energy differences are less than 0.5 eV. Due to the weak interaction with the surface, the released O2 molecule is quickly desorbed.
Finally, the dissociation of O3 molecules at the (111) surface is a exothermic
acknowledgments
The authors are very grateful Khalifa Aguir for numerous helpful discus-sions. The calculations were supported by the ”Centre Informatique National de l’Enseignement Sup´erieur” (CINES-France).
References
[1] G. Chaudhari, A. Bende, A. Bodade, S. Patel, V. Sopkal, Sens. Actua-tors B 115 (2006) 297–302.
[2] L. Rossinyol, J. Arbiol, F. Peir´o, A. Cornet, J. Morante, B. Tian, D. Zhao, Sens. Actuators B 109 (2005) 57–63.
[3] K. Steiner, G. Sulz, E. Neske, E. Wagner, Sens. Actuators, B 26-27 (1995) 64–67.
[4] H.-J. Michel, H. Leiste, J. Halbritter, Sens. Actuators, B 24-25 (1995) 568–572.
[5] H. Nanto, T. Morita, H. Habara, K. Kondo, Y. Douguchi, T. Minami, Sens. Actuators, B 35-36 (1996) 384–387.
[6] L. Petetin, F. Berger, A. Chambaudet, R. Planade, Sens. Actuators, B 78 (2001) 166–173.
[7] A. Niskanen, A. Varpula, M. Utriainen, G. Natarajan, D. Cameron, S. novikov, V.-M. Airaksinen, J. Sinkkonen, S. Franssila, Sens. Actua-tors, B 148 (2010) 227–232.
[8] G. Korotcenkov, I. Blinov, M. Ivanov, J. Stetter, Sens. Actuators B 120 (2007) 679686.
[9] S. Chakraborty, I. Mandal, I. Ray, S. Majumdar, A. Sen, H. Maiti, Sens. Actuators, B 127 (2007) 554–558.
[10] N. Yamazoe, Sens. Actuators B 108 (2005) 214.
[11] M. H¨ubner, C. Sinion, A. Haensch, N. Barsan, U. Weimar, Sens. and Actuators B 151 (2010) 103–106.
[12] R. Botter, T. Aste, D. Beruto, Sens. Actuators, B 22 (1994) 27–35.
[13] H. Xu, X. Liu, D. Cui, M.Li, M. Jiang, Sens. Actuators, B 114 (2006) 301–307.
[14] Z. Yang, Y. Huang, G. Chen, Z. Guo, S. Cheng, S. Huang, Sens. Actu-ators, B 140 (2009) 549–556.
[15] M. Carotta, A. Cervi, V. di Natale, S. Gherardi, A. Giberti, V. Guidi, D. Puzzovio, B. Vendemiati, G. Martinelli, M. Sacerdori, D. Calestani, A. Zappettini, M. Zha, L. Zanotti, Sens. Actuators, B 137 (2009) 164– 169.
[16] L. Wang, Y. Kang, X. Liu, S. Zhang, W. Huang, S. Wang, Sens. Actu-ators, B 162 (2012) 273–243.
[18] A. Labidi, A. Bejaoui, H. Ouali, F. Chaffar-Akkari, A. Hajjaji, M. Gaidi, M. Kanzari, B. Bessa¨ıs, M. Maaref, Appl. Surf. Sci. 257 (2011) 9941– 9945.
[19] A. Bejaoui, J. Guerin, K. Aguir, Sens. Actuators, B 181 (2013) 340–347.
[20] S. Pokhrel, C. Simion, V. Quemener, N. Barsan, U. Weimar, Sens. Ac-tuators, B 133 (2008) 78–83.
[21] V. Mastelaro, S. Zilio, L. da Silva, P. Pelissari, M. Bernardi, J. Guerin, K. Aguir, Sens. Actuators, B 181 (2013) 919–924.
[22] L. Liao, Z. Zhang, B. Yan, Z. Zhengand, Q. L. Bao, T. Wu, C. Li, Z. X. Shen, J. X. Zhang, H. Gong, J. C. Li, T. Yu, Nanotechnology 20 (2009) 085203.
[23] S. Steinhauer, E.Brunet, T. Maier, G. C. Mutinati, A. K¨ock, O. Freuden-berg, DOI 10.5162/IMCS2012/8.4.2, MCS 2012 The 14th International Meeting on Chemical Sensors, 2012, p. 713.
[24] H. T. Hsueh, S. J. Chang, F. Y. Hung, W. Y. Weng, C. L. Hsu, T. J. Hsueh, S. S. Lin, B. T. Dai, J. Electrochem. Soc. 158 (2011) J106–J109.
[25] S. Moulzolf, S. Ding, R. Lad, Sens. Actuators B 77 (2001) 375382.
[26] E. Barrett, G. Georgoades, P. Sermon, Sens. Actuators B 1 (1990) 116– 120.
[28] C. Lambert-Mauriat, V. Oison, L. Saadi, K. Aguir, Surface Science 606 (2012) 40–45.
[29] V. Oison, L. Saadi, C. Lambert-Mauriat, R. Hayn, Sens. Actuators, B 160 (2011) 505–510.
[30] S. Asbrink, J.-L. Norrby, Acta Crystallogr. B 26 (1970) 8.
[31] J. Jeong, G. Choi, J. Phys. Chem. Solids 57 (1996) 81–84.
[32] S. Dudarev, G. A. Botton, S. Savrasov, C. Humphreys, A. Sutton, Phys. Rev. B 57 (1998) 1505–1509.
[33] J.-P. Crocombette, F. Jollet, L. Thien Nga, T. Petit, Phys. Rev. B 64 (2001) 104107.
[34] M. Freyss, T. Petit, J.-P. Crocombette, J. Nucl. Matter. 347 (2005) 44.
[35] B. Dorado, B. Amadon, M. Freyss, M. Bertolus, Phys. Rev. B 79 (2009) 235125.
[36] S. C. Ray, Sol. Energy Mater. Sol. Cell 68 (2001) 307.
[37] K. L. Hardee, A. J. Bard, J. Electrochem. Soc. 124 (1977) 215.
[38] F. P. Koffyberg, F. A. Benko, J. Appl. Phys. 53 (1982) 1173.
[39] F. Marabelli, G. B. Parravicini, F. Salghetti-Drioli, Phys. Rev. B 52 (1995) 1433.
[40] V. Anisimov, A. L. F. Aryasetiawan, J. Phys.: Condens. Matter 9 (1997) 767–808.
[41] L. Petit, A. Svane, Z. Szotek, W. M. Temmerman, G. M. Stockes, Petit, Phys. Rev. B 81 (2010) 045108.
[42] C. Adamo, V. Barone, J. Chem. Phys. 110 (1999) 61.
[43] J. Heyd, G. Scuseria, M. Ernzerhof, J. Chem. Phys. 118 (2003) 8207.
[44] A. Georges, G. Kotliar, W. Krauth, M. J. Rozenberg, Rev. Mod. Phys. 68 (1996) 13.
[45] D. Wu, Q. Zhang, M. Tao, Phys. Rev. B 73 (2006) 235206.
[46] P. Ordej´on, E. Artacho, J. Soler, Phys. Rev. B 53 (1996) R10441.
[47] J. Soler, E. Artacho, J. Gale, A. Garcia, J. Junquera, P. Ordej´on, D. S´anchez-Portal, J. Phys.: Condens. Matter 14 (2002) 2745.
[48] N. Troullier, J. Martins, Phys. Rev. B 43 (1991) 1993–2006.
[49] J. Perdew, K. Burke, M. Ernzerhof, Phys. Rev. Lett. 77 (1996) 3865– 3868.
[50] O. Sankey, D. Niklewski, Phys. Rev. B 40 (1989) 3979.
[51] B. Amadon, F. Jollet, M. Torrent, Phys. Rev. B. 77 (2008) 155104.
[52] F. Tran, J. Schweifer, P. Blaha, K. Schwarz, P. Nov´ak, Phys. Rev. B 77 (2008) 085123.
[53] P. Larson, W. R. L. Lambrecht, A. Chantis, M. van Schilfgaarde, Phys. Rev. B 75 (2007) 045114.
[54] G. Jomard, B. Amadon, F. Bottin, M. Torrent, Phys. Rev. B 78 (2008) 075125.
[55] G. Bergerhoff, I. Brown, Crystallographic Databases, Chester, Interna-tional Union od Crystallography, 1987.
[56] A. Belsky, M. Hellenbrandt, V. Karen, P. Luksch, Acta Cryst.B 58 (2002) 364–369.
[57] S. Kurth, J. P. Perdew, P. Blaha, Int. J. Quantum Chem. 75, 889 (1999).
[58] L. Wang, T. Maxisch, G. Ceder, Phys. Rev. B 73 (2006) 195107.
[59] B. Dorado, D. Anderson, C. R. Stanek, M. Bertolus, B. P. Uberuaga, G. Martin, M. Freyss, P. Garcia, Phys. Rev. B 86 (2012) 035110.