RESEARCH OUTPUTS / RÉSULTATS DE RECHERCHE
Author(s) - Auteur(s) :
Publication date - Date de publication :
Permanent link - Permalien :
Rights / License - Licence de droit d’auteur :
Bibliothèque Universitaire Moretus Plantin
Institutional Repository - Research Portal
Dépôt Institutionnel - Portail de la Recherche
researchportal.unamur.be
University of Namur
Local plasmonic studies on individual core-shell gold-silver and pure gold
nano-bipyramids
Arenal, Raul; Henrard, Luc; Roiban, Lucian; Ersen, Ovidiu; Burgin, Julien;
Treguer-Delapierre, Mona
Published in:
Journal of Physical Chemistry C DOI:
10.1021/jp5066105 Publication date: 2014
Document Version Peer reviewed version Link to publication
Citation for pulished version (HARVARD):
Arenal, R, Henrard, L, Roiban, L, Ersen, O, Burgin, J & Treguer-Delapierre, M 2014, 'Local plasmonic studies on individual core-shell gold-silver and pure gold nano-bipyramids', Journal of Physical Chemistry C, vol. 118, no. 44, pp. 25643-25650. https://doi.org/10.1021/jp5066105
General rights
Copyright and moral rights for the publications made accessible in the public portal are retained by the authors and/or other copyright owners and it is a condition of accessing publications that users recognise and abide by the legal requirements associated with these rights. • Users may download and print one copy of any publication from the public portal for the purpose of private study or research. • You may not further distribute the material or use it for any profit-making activity or commercial gain
• You may freely distribute the URL identifying the publication in the public portal ?
Take down policy
If you believe that this document breaches copyright please contact us providing details, and we will remove access to the work immediately and investigate your claim.
Fundacion ARAID, 50018 Zaragoza, Spain
§Department of Physics, University of Namur, 61, rue de Bruxelles 5000 Namur, Belgium ∥IPCMS, CNRS-University of Strasbourg, 67087 Strasbourg, France
⊥MATEIS, INSA-Lyon, Université de Lyon, 7 Avenue Jean Capelle, 69621 Villeurbanne Cedex, France #ICMCB, University of Bordeaux, UPR 9048 CNRS, 33608 Pessac/Bordeaux, France
*
S Supporting InformationABSTRACT: Bimetallic systems present new opportunities to tailor the optical properties of nanoparticles. Morphology, structural, and optical properties of gold and of gold−silver nanoparticles have been studied by three-dimensional (3D) scanning transmission electron microscopy (STEM), STEM imaging, and monochromated subnanometer electron beams. The 3D morphology of these nanoparticles consists of bipyramidal prisms with well-defined facets. Furthermore, in the case of the core−shell nanoparticles, from these tomographical studies, we have determined the silver (shell) distribution and their atomic arrangement. Multipolar localized surface plasmon resonances (LSPR) have been studied, at subnanometer level and at high-energy resolution, as a function of their shape, their size (aspect ratio), and the surrounding environment. These results have been interpreted in the framework of the discrete dipole approximation (DDA) simulations. The effect of the silver
outer-shell has been elucidated. We observed a significant damping of plasmon excitations due to the difference of dielectric function of these two metals. In addition, we have shown that the combination of the tomographical and plasmonic (experiments and simulations) studies with such high spatial resolution constitutes a very powerful and fundamental tool for understanding and optimizing the photonics properties of nanomaterials.
1-. INTRODUCTION
In recent years, significant attention has been devoted to the study of noble metallic nanoparticles (NP) due to the possibility of controlling their optical properties. In particular, the tuning of their localized surface plasmon resonances (LSPRs) has foreseen applications in photonics, electronics, and biosensors.1−4 These localized resonances correspond to the coherent oscillations of the conduction/valence electrons, mainly at the surface of the metallic nanoparticles, and they could be excited by an external electromagneticfield (light or electron beams).1,2 It is well-known that particle size, shape, and composition, as well as the local dielectric environment of NP have strong impact on these SPRs.1−4 These parameters can nowadays be controlled in an efficient way during the synthesis of these nanoparticles, and their applications are becoming a reality in the different fields mentioned above but also for catalysis, biomedicine, or optoelectronics.1−7
Bimetallic nanoparticles offer new possibilities to tune the plasmonic responses by modifying their spectral band or enhancing the local electromagneticfields.1Gold and silver are
the most common noble metal employed in plasmonics, and recent attention has been focused on Au−Ag systems.8−14In nanorods or nanodumbbells, SPR energy shifts have been observed as a function of the size of the objects. Furthermore, extra resonances and new modes have been reported to depend on the silver content, as some of them are directly associated with silver SPR,15,40,41others to the shape of the object12,42and even to the arrangement/assembly of these nanostruc-tures.40,43,44These results demonstrate the interest in bimetallic materials. However, detailed local analyses are needed to disentangle the effect of the core−shell structure and of other structural parameters on the optical properties of these materials. In this sense, electron tomography (ET) is probably the most powerful technique to obtain, very accurately, all these crucial parameters (structural, morphological, and composi-tional aspects) in three dimensions.16−18
Received: July 2, 2014
Revised: October 7, 2014
Under this context, electron energy loss spectroscopy (EELS) developed in a transmission electron microscope (TEM) is one of the most appropriated techniques for the study of the SPR response at high spatial resolution.19−27In the present work, we have studied core−shell gold−silver nano-particles via low-loss EELS experiments using a probe-corrected and monochromated TEM. Pure gold NPs with similar sizes and shapes have been considered for comparison. The experimental findings have been interpreted with the help of discrete dipole approximation (DDA) simulations. Further-more, the geometry of the nanoparticles has been studied by STEM-tomography, and their precise composition and atomic structure have been analyzed by energy-dispersive X-ray spectroscopy (EDS) and high-angle annular dark field in scanning TEM (HAADF-STEM) measurements. As part of the interpretation of the different SPR modes, we have demonstrated that, due to the very similar optical constant of bulk Ag and Au below 2 eV, the core−shell or pure NP behave very similarly for all the optical properties below 2 eV (i.e., in the visible range). The present works significantly enrich the understanding of the optical properties of bimetallic nanostruc-tures and provide insight into their potential applications in photonics and related fields, as subwavelength guiding, electromagneticfield enhancement, and biosensing.
2-. MATERIALS AND METHODS
Materials. Growth of Gold Bipyramids. The nanostructures were grown using the seed-mediated method in aqueous cationic surfactant solutions in the presence of AgNO3, CTAB.
Citrate-stabilized Au nanoparticles were used as seeds. Their preparation followed the previously reported procedure.17 Briefly, aqueous solutions of HAuCl4 (0.25 mM, 0.125 mL)
and sodium citrate (0.25 mM, 0.25 mL) werefirst added into deionized water and then a freshly prepared, ice-cold solution of NaBH4(0.6 mL, 12 mM) was added under vigorous stirring.
The resulting seed solution was kept at least 4 h before use. For a typical preparation of Au bipyramids in CTAB solutions, a growth solution wasfirst prepared by the addition of HAuCl4 (11 mM, 0.45 mL), AgNO3(26 mM, 0.038 mL), HCl (0.2 mL,
1 M), and ascorbic acid (0.1 M, 0.076 mL) into an aqueous solution of CTAB (0.1 M, 10 mL) at 27 °C. The citrate-stabilized seed solution was then added. The reaction solution was mixed by gentle inversion for 10 s and then left undisturbed overnight in an oven at 65°C. Similar preparations with the use of different volumes (20−600 mL) of seed solutions were carried out in order to prepare the gold bipyramid of different lengths.
Silver Coating of the Gold Bipyramids. The original method that we used to deposit silver onto the elongated Au nanostructures favors the deposition of silver on the large sidewalls facets rather than at the tip. One found that by carefully controlling the pH of the solution, a thin layer of silver could be more homogeneously deposited on the overall structure (lateral highly stepped facets as well as the equatorial plane and the tips).17Experimental conditions used were 0.1 mM of gold bipyramids, 0.05 M of CTAB, ascorbic acid (AA) in a ratio of [AA]/[Ag+] = 20, and the quantity of silver nitrate was calculated to be in a ratio [Ag+]/[Au] = 0.2−1.5. To initiate the silver reduction, the pH was adjusted at 8.5 by slowly adding an aqueous solution of 0.01 M NaOH. The pH is a critical parameter in this study for homogeneous coating.
TEM: Imaging, EDS, Tomographic, and EELS Analyses. A purification of the Au and Au−Ag bipyramids solution was systematically performed prior to TEM studies. After this purification process, the samples were prepared placing a drop of the nanoparticle aqueous suspension directly on a copper carbon holey grid that was left drying in air before putting it inside the microscope. NPs were deposited on amorphous carbon films on a Cu grid with repeated plasma cleaning to eliminate organic contamination prior to the STEM-tomog-raphy and EELS analyses. In the case of the TEM samples employed for tomographical studies, we added Au spherical-nanoparticles of less than 5 nm as markers for the tilt series alignment. It is worth noting that such samples were not studied in low-loss EELS, to prevent any contribution to the plasmon response of the Au and Au−Ag nanoparticles of interest.
All the TEM studies (tomography, EDS, imaging, and EELS) have been developed using a FEI Titan Low-Base microscope,
Figure 1.(a) Low magnification (LM)-HAADF image of one of the Au bipyramids. (b) EDS spectra recorded at different positions marked in Figure 1a. (c) Low magnification HAADF image of an Au−Ag core−shell bipyramidal nanoparticle. (d) EDS spectra recorded in two different regions marked on the LM-HAADF image. (e) 3D model of the nanoparticle obtained by a classical data segmentation procedure from a reconstructed HAADF-STEM tilt series, Au in purple and Ag in gray, respectively. (f) A slice through the XY plane of the chemical sensitive volume showing the Au (red) and Ag (green) distribution at the basis of the pyramid.
The Journal of Physical Chemistry C Article
dx.doi.org/10.1021/jp5066105| J. Phys. Chem. C 2014, 118, 25643−25650
working at 80 kV (EELS, some EDS and imaging works) or 300 kV. This microscope is equipped with a Cs probe corrector, a monochromator, and an ultrabright X-FEG electron source. The tilt-tomographical series were acquired using Xplore3D-FEI. The tilt angle range was of±72°, with an image recorded every 2° in Saxton mode.30
After acquisition, the tilt series data were treated for imaging processing, alignment and recon-struction, using IMOD31 and the volume reconstruction was performed employing the algebraic reconstruction technique (ART)32(15 iterations) implemented in TomoJ,33a plugin in ImageJ. The volume segmentation and visualization were performed using ImageJ and 3DSlicer software. It is worth noting that no evidence of irradiation damage in the samples was detected during the tilt series acquisition. For the low-loss studies, the energy resolution was below 200 meV (even 150 meV for some of the cases), and the spectra were collected in STEM mode using spectrum-image mode.34,3540−60 Spectra (of 30−40 ms/each) were acquired for each probe position following a two-dimensional (2D) region across the nano-object. The convergence and collection angle were 25 and 35 mrad, respectively, and the energy resolution∼200 meV. The low-loss region of EEL spectra is strongly affected by the broad tails of the zero-loss peak (ZLP). The fact that we used a monochromator and the energy resolution that we obtain helps for the analysis of the low-energy features but a careful treatment has to be done. In order to be able to extract quantitative information, all the EEL spectra have been normalized by the intensity of thefirst mode (marked as A), which is the most intense one (see Figure S4 of the Supporting Information). The tail of the zero-loss peak has been removed using a power law subtraction method.36
EELS Simulations. EELS simulations have been performed in the discrete dipole approximation (DDA) method as
implemented in the DDEELS code.28,37 The optical constant of bulk metals have been taken from tabulated data38,39and the number of dipoles varies from 15000 to 30000 depending of the NP.
3. RESULTS AND DISCUSSION
Figure 1a displays a HAADF image of a pure gold nanoparticle as checked by EDS (Figure 1b). EDS spectra have been collected at different areas of this NP and shows Au X-rays as well as Cu fluorescence coming from the TEM grid. Au−Ag core−shell nanoparticles have also been investigated (Figure 1, panels c and d). Thesefigures correspond to a HAADF image and to several EDS spectra recorded at different positions on one of the Au−Ag NP. All these nanostructures (Au pure or Au−Ag systems) have the same arrowhead shape, and their size is in the range of 150−350 nm for the long axis and 50−90 nm for the short axis.
In order to obtain structural information on different NPs, we have developed three-dimensional (3D)-STEM-HAADF measurements in both Au−Ag core−shell and Au nano-particles. Figure 1e shows the 3D computed model of the Au− Ag core−shell nanoparticle displayed in Figure 1c. All the studied NP are bipyramidal prisms, with pentagonal joined bases and relatively rounded apexes. Furthermore, the core− shell nanoparticles are composed by a Au core, which is covered by a relatively uniform layer of Ag of a few nanometers thick. A movie of the 3D models of the Au−Ag NP (Figure 1c) is displayed in the Supporting Information, showing the relative uniformity of the Ag layer.
Once the morphology and composition of the NP have been fully characterized, we turned to the study of their optical properties via EELS measurements in the low loss region (below 50 eV). The SPR were excited by an 80 keV
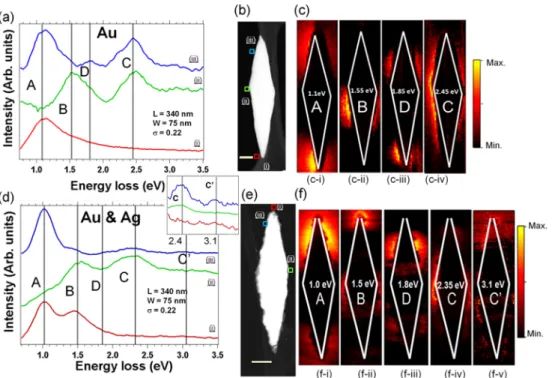
Figure 2.(a and d) EEL spectra (each of them corresponds to the sum of 16 spectra) extracted from the SPIMs recorded on the Au and Au−Ag core−shell nanoprisms depicted in the HAADF images (the scale bar is 50 nm) (Figure 2, panels b and e, respectively). The dimensions of the nanoparticles are specified in those images: L, length; W, width; and σ, aspect ratio (W/L). Inset of Figure 2d corresponds to a zoom of the 2.0−3.5 eV region. (c and f) Different intensity maps showing the spatial distribution of the SPR modes of these Au and Au−Ag core−shell nanobipyramids. These different modes are marked as A−D.
monochromated electron beam, using the STEM-EELS spectrum-image (SPIM) acquisition mode. It is also worth mentioning that following each SPIM acquisition, we recorded HAADF images to ensure that no visible beam damage (due to the inelastic scattering events) or carbon contamination has occurred. Among the different bipyramid nanoparticles present in the sample, we have focused our attention on NP with very similar sizes but with different compositions (pure Au and Au− Ag core−shell). We have considered, for each composition, typical sizes and aspect ratio.
The Figure 2 depicts the EELS analyses of the SPR modes (0.75−3.5 eV) carried out for pure gold and Au−Ag core−shell bipyramids having the same size [Length (or long axis) = 340 nm and width (or short axis) = 75 nm]. Typical EEL spectra (sum of 16 spectra) are plotted in Figure 2 (panels a and d). They have been extracted from different areas of the 2 SPIMs (Figure 2, panels c and f) as marked on the HAADF images (Figure 2, panels b and e): curve (i) is from the long axes apex, curve (ii) from the short axes apex, and curve (iii) from the edge of the NP. The maps correspond to the intensity extracted for the SPIMs after zero-loss peak (ZLP) subtraction (see Methods). More experimental data on Au and Au−Ag NP of different size and aspect ratio are given in the Supporting Information.
We observe three main plasmon modes, denoted as A, B, and C, which are common to all the nanobipyramids, independently of their size or composition. It is worth mentioning that, as observed from Figure 2 (panels a and d), the relative intensity of these modes strongly depends on the probe position. Furthermore, we also note that the intensities of the modes are not symmetrically distributed even if the NPs are symmetric (see Figure 2, panels c and f). This asymmetry is not due to the orientation of the NP but from the carbon membrane on which the NP is partly lying (see HAADF images, Figure 2, panels b and e). Indeed (from the TEM analyses, including the tomography studies), we concluded that the NP long axis is oriented rather perpendicular to the electron beam. Local modification of the environment (the presence of the carbon membrane in this case) can damp heavily the local surface plasmon resonances (LSPR).27
The A mode is localized at the sharp (long-axis) apex of the nanoparticles, the C mode at the other (short-axis) apex of the nanoparticle, where the B mode is observed for a probe trajectory close to all apexes. The position of the A mode
depends on the size and aspect ratio of the nanobipyramid (see more experimental data in the Supporting Information), but there is no clear shift of this mode in energy for Au−Ag core− shell compared to homogeneous Au NP (Figure 2d and panel d of Figure S1 of the Supporting Information). The position, shape, and intensity of the C mode depend mainly of the composition. A well-defined peak at 2.4 eV was observed for Au nanoparticules but is almost not observable for Au−Ag core− shell NPs. Furthermore, in this latter case (Au−Ag system), this C mode splits into 2 modes at 2.4 and 3.1 eV. There is a fourth resonance (D at∼1.8 eV) which is only visible for the biggest nanoparticles, independent of their composition (pure gold or gold−silver) and located at the edge (or the face) of the nanobipyramid.
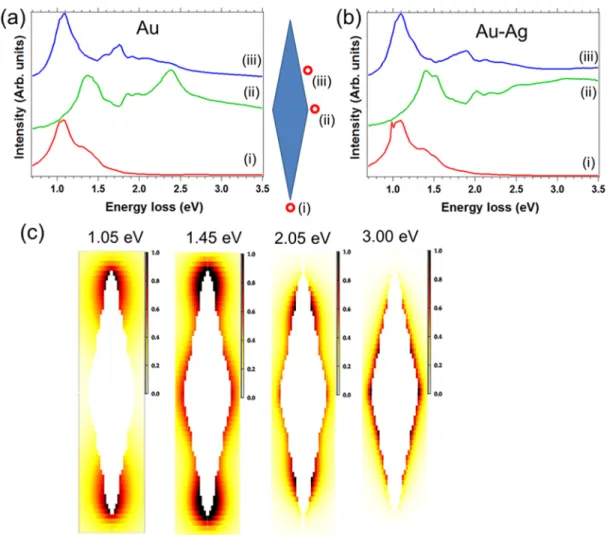
In order to interpret these results, we have performed DDA simulations of EELS, as implemented in the DDEELS code.28 Wefirst consider the EELS response of ellipsoidal nanoparticles (Figure 3a). Even if ellipsoid is only a rough estimation of the actual NP shape, it gives us an easy classification of the observed modes and can be compared with other studies.28,29 Size, aspect ratio and impact parameter (that correspond to the different area of the SPIMs) effects are summarized in Figure 3. EEL spectra for two impact parameters (nearby the long-axis apex and the short-axis apex of the ellipsoid) are simulated. The main (and low-energy) mode for the long-axis apex impact parameter (solid black line) is the longitudinal (long-axis) optically active dipolar (D1). The next mode [at 1.7, 2.2, and 2.7 eV on curves (i), (ii), and (iii)] is a quadrupolar mode Q (optically not active for small NP) as proven by its activity for both impact parameters and by the map of the induced EM field (not shown). As expected, the modes D1 and Q are clearly size- and aspect-ratio-dependent. The transverse dipolar mode D2 (at 3.6 eV) is excited by the short-axis apex impact parameter. Its shape and energy is independent of the size and aspect ratio of the ellipsoid for the considered geometries. This invariance is related to the small size of the associated semiaxis (24 to 48 nm) for which quasi-static approximation remains valid. Finally, an octupolar mode O is found only for large 5:1 ellipsoid at 2.4 eV.
EELS simulations for Au ellipsoid, Ag ellipsoid, and Au−Ag core−shell ellipsoid give some insight into the composition effect on the plasmon modes as demonstrated on Figure 3b for NP with a semiaxis of (90:30) nm for the outer ellipsoid and (75:25) nm for the inner ellipsoid. First, we observe that the
Figure 3.(a) EELS simulations for a homogeneous biaxial ellipsoid of Ag, showing the size and aspect ratio effects on LSP resonances. Aspect ratio and values of the semiaxis (in nanometers) are displayed above the curves. Two impact parameters are considered, close to the long-axis (black solid curve) and close to the short-axis (dashed red curve). (b) EELS simulations for an Ag, and Au and an Au−Ag core−shell ellipsoidal NP [marked as (i), (ii), and (iii)]. The sizes of the semiaxis are (90:30) nm for the outer ellipsoid and (75:25) nm for the inner ellipsoid).
The Journal of Physical Chemistry C Article
dx.doi.org/10.1021/jp5066105| J. Phys. Chem. C 2014, 118, 25643−25650
energy and shape of the D1 mode are almost independent of the composition of these nanostructures. This is related to the very similar optical constant of bulk Ag and Au below 2 eV. This means NP made of Au and Ag will behave very similarly for all the optical properties below 2 eV (i.e., in the visible range), whatever the relative composition is. D2 shows up at 3.6 eV for Ag NP and at 2.4 eV for Au NP (superimposed with the Q mode). Core−shell NP display a very broad D2 plasmon mode with maxima at energies of the mode of homogeneous NP (that we can call D2 and D2′).
To go further in the analysis of experimental results, we performed EELS simulations for a more realistic NP shape (i.e., a nanobipyramid with sharp tips in order to mimic the experimentally explored NP). We present results for both homogeneous Au NP (Figure 4a) and Au−Ag core−shells NP (Figure 4b) for L = 350 nm and W = 78 nm, very similar to the experimental morphology of Figure 2. Maps of intensity of the losses are present in Figure 4c for the Au−Ag core−shell NP. The D1 mode shows up at 1.1 eV for both NPs. The mode at 1.45 eV is a quadrupolar (Q) mode with loss intensities maxima at all the four apex of the NP. The D2 mode is observed at 2.4 eV for Au bipyramid, while a broad plasmon excitation is observed in our simulations for Au−Ag core−shell NP (D2 and D2′). An edge (or face) mode is obtained at 1.8 eV (Au) or 2.05 eV (Au−Ag). This mode corresponds to the O mode for ellipsoid. It is worth noting that, as seen for ellipsoid, this high
order (or“face”) mode are more clearly seen for larger NP. We have also simulated the EELS response for other NP (pure and core−shell) of different aspect-ratio/size (see Figures S2 and S3 of the Supporting Information).
Table 1 summarizes all the EELS experimental results on pure and core−shell bipyramids for the L = 340 nm, W = 75 nm and the L = 210 nm, W = 70 nm (see the Supporting Information) and link them with the DDEELS simulations. There are two parameters governing the response of these nanoparticles: the morphology (size and aspect ratio) and the composition (homogeneous/pure or core−shell NP).
The mode A is obviously the longitudinal D1 mode, not affected by the composition and shifted by size and aspect ratio modification. We note here that the mode A of the small Au− Ag core−shell NP at 1.1 eV is red shifted compared with the homogeneous NP. This contradicts both the conclusions reached above for larger NP and the simulations (see the Supporting Information). A local contamination could explain this discrepancy. The mode C is the transverse mode (D2), associated with the gold core that is not influenced by the Ag shell or by the size of the NP. The mode C′ is the transverse mode associated with the Ag shell (D2′). The mode B is a quadrupolar mode Q, not influenced by the composition but by the size and aspect ratio. Finally, the mode D is a“face” or high-order mode that only appears for larger NPs. Note that for some of the spectra, it was impossible to define the energy of
Figure 4.EELS simulations for (a) Au and (b) Au−Ag bipyramids for three different impact parameters [see sketch between Figure 4, panels a and b, marked as (i), (ii), and (iii)]. The size of the NP is L = 350 nm and W = 78 nm. (c) Intensity maps of the intensity of the losses at 4 different energies for the Au−Ag core−shell NP.
the C′ mode because of the very wide and extended energy range of the mode (see curve (iii) in Figure 4b between 2.0 and 3.5 eV). These findings corroborate other recent works developed on different kinds (size and shape) of Au−Ag core−shell nanostructures, where slight (<0.1 eV) energy shifts of the modes have been observed due to the presence of Ag shells.40−43
While the morphology (size-and-aspect ratio) influence on the SPR resonance is well-documented, it is worth insisting on the effect of the composition that this study reveals. First, below 2 eV (modes A and B), an Ag shell has no influence on the plasmon excitation scheme (for both position and intensities). This is related to the nearly identical optical constant of bulk Ag and Au in the IR. Above 2 eV, the composition of the NP is revealed. The more spectacular effect is a dramatic damping of plasmon excitations, even for very narrow Ag coverage of Au NP. This can be explained by the difference in the imaginary part of the dielectric function for both metals in this frequency range that give rise to this heavy damping. Figure 5 further illustrates this damping effect. We cannot directly compare the two experiments carried out in different NP (of the same size and shape) but different composition (pure Au, Figure 5a, and Au−Ag core−shell, Figure 5b, respectively). It is worth mentioning that these intensity maps are normalized by the intensity map corresponding to the A mode which is, for all the cases, the most intense mode (see Methods). We can observe that, taking the intensity map of the A mode (Imode‑A) as
Table 1. Table Compiling All the Different SPR Modes Observed for the 2 Different Systems (Pure Au and Core-Shell Au−Ag) and for the NP Presenting 2 Different Aspect Ratio Valuesa
aThis mode (*) corresponds to a quadrupolar mode (Q) which, in the
case of the pure Au nanoparticles, is superimposed with a dipolar mode (D2). In italic, the theoretical energy values for the different SPR modes. These modes (#) are not clearly identified.
Figure 5.(a and b) Normalized intensity maps (see Methods) for the two different systems displayed in Figure 2, corresponding to pure Au (Figure 5a) and Au−Ag core−shell NP (Figure 5b), respectively.
The Journal of Physical Chemistry C Article
dx.doi.org/10.1021/jp5066105| J. Phys. Chem. C 2014, 118, 25643−25650
subnanometer scale, of the precise structure/morphology, composition, and optical properties of these complex nanostructures. Furthermore, we have used discrete dipolar approximation (DDA) calculations for the interpretation of the different LSPR modes excited by EELS. The effect of the composition and the size (aspect-ratio) of these nanostructures on the evolution of electromagnetic modes has been analyzed. We have observed that, due to the very similar optical constant of bulk Ag and Au below 2 eV, the core−shell or pure NP behave very similarly for all the optical properties below 2 eV (i.e., in the visible range). In addition, we have observed that there is a dramatic damping of plasmon excitations for very narrow shell of Ag covering the Au NP. This effect can be explained by the difference in the imaginary part of the dielectric function for both metals. Thesefindings, which can be obtained only by the TEM techniques used here, have a very important impact on the application of these nanomaterials as nanophotonic/plasmonic systems.
■
ASSOCIATED CONTENT*
S Supporting InformationA video corresponding to the 3D models of the nanostructured Au−Ag nanoparticle of Figure 1c as well as additional EELS measurements and DDA simulations. This material is available free of charge via the Internet at http://pubs.acs.org.
■
AUTHOR INFORMATIONCorresponding Author *E-mail: [email protected]. Notes
The authors declare no competingfinancial interest.
■
ACKNOWLEDGMENTSThe TEM measurements were performed in the Laboratorio de Microscopias Avanzadas (LMA) at the Instituto de Nano-ciencia de Aragon (INA) - Universidad de Zaragoza (Spain). R.A. acknowledges funding from Grants 165-119 and 165-120 from U. de Zaragoza, from ARAID foundation, and from the Spanish Ministerio de Economia y Competitividad (FIS2013-46159-C3-3-P). The research leading to these results has received funding from the European Union Seventh Frame-work Program under Grant Agreement 312483-ESTEEM2 (Integrated Infrastructure Initiative−I3). This research used resources of the“Plateforme Technologique de Calcul Intensif (PTCI)” (http://www.ptci.unamur.be) located at the Univer-sity of Namur, Belgium, which is supported by the F.R.S.-FNRS under the convention no. 2.4520.11. The PTCI is a member of the“Consortium des Équipements de Calcul Intensif (CÉCI)” (http://www.ceci-hpc.be). R.A. and L.H. also acknowledge the
Subwavelength Optics. Nature 2003, 424, 824−830.
(6) Lal, S.; Link, S.; Halas, N. J. Nano-Optics from Sensing to Waveguiding. Nat. Photonics 2007, 1, 641−648.
(7) El-Sayed, I. H.; Huang, X.; El-Sayed, M. A. Surface Plasmon Resonance Scattering and Absorption of Anti-EGFR Antibody Conjugated Gold Nanoparticles in Cancer Diagnostics: Applications in Oral Cancer. Nano Lett. 2005, 5, 829−834.
(8) Yang, Z.; Chang, H.-T. Anisotropic Syntheses of Boat-Shaped Core-Shell Au-Ag Nanocrystals and Nanowires. Nanotechnology 2006, 17, 2304−2310.
(9) Xiang, Y. J.; Wu, X. C.; Liu, D. F.; Li, Z. Y.; Chu, W. G.; Feng, L. L.; Zhang, K.; Zhou, W. Y.; Xie, S. S. Gold Nanorod-Seeded Growth of Silver Nanostructures: From Homogeneous Coating to Anisotropic Coating. Langmuir 2008, 24, 3465−3470.
(10) Cardinal, M. F.; Rodriguez-Gonzalez, B.; Alvarez-Puebla, R. A.; Perez-Juste, J.; Liz-Marzan, L. M. Modulation of Localized Surface Plasmons and SERS Response in Gold Dumbbells through Silver Coating. J. Phys. Chem. C 2010, 114, 10417−10423.
(11) Okuno, Y.; Nishioka, K.; Kiya, A.; Nakashima, N.; Ishibashi, A.; Niidome, Y. Uniform and Controllable Preparation of Au-Ag Core-shell Nanorods using Anisotropic Silver Shell Formation on Gold Nanorods. Nanoscale 2010, 2, 1489−1493.
(12) Rodriguez-Gonzalez, B.; Attouchi, F.; Cardinal, F.; Myroshnychenko, V.; Stephan, O.; Garcia de Abajo, F. J.; Liz-Marzan, L. M.; Kociak, M. Surface Plasmon Mapping of Dumbbell-Shaped Gold Nanorods: The Effect of Silver Coating. Langmuir 2012, 28, 9063−9070.
(13) Jiang, R.; Chen, H.; Shao, L.; Li, Q.; Wang, J. Unraveling the Evolution and Nature of the Plasmons in (Au Core)−(Ag Shell) Nanorods. Advanced Optical Materials 2012, 24, 200−207.
(14) Samal, A. K.; Polavarapu, L.; Rodal-Cedeira, S.; Liz-Marzán, L. M.; Pérez-Juste, J.; Pastoriza-Santos, I. Size Tunable Au@Ag Core− Shell Nanoparticles: Synthesis and Surface-Enhanced Raman Scatter-ing Properties. Langmuir 2013, 29, 15076−15082.
(15) Cortie, M. B.; Liu, F.; Arnold, M. D.; Niidome, Y. Multimode Resonances in Silver Nanocuboids. Langmuir 2012, 28, 9103−9112.
(16) Midgley, P. A.; Dunin-Borkowski, R. E. Electron Tomography and Holography in Materials Science. Nat. Mater. 2009, 8, 271−280. (17) Burgin, J.; Florea, I.; Majimel, J.; Dobri, A.; Ersen, O.; Tréguer-Delapierre, M. 3D Morphology of Au and Au@Ag Nanobipyramids. Nanoscale 2012, 4, 1299−1303.
(18) Florea, I.; Ersen, O.; Arenal, R.; Ihiawakrim, D.; Messaoudi, C.; Chizari, K.; Janowska, I.; Pham-Huu, C. 3D Analysis of the Morphology and Spatial Distribution of Nitrogen in Nitrogen-doped Carbon Nanotubes by Energy-Filtered Transmission Electron Microscopy Tomography. J. Am. Chem. Soc. 2012, 134, 9672−9680.
(19) Batson, P. E. Surface Plasmon Coupling in Clusters of Small Spheres. Langmuir 1982, 49, 936−940.
(20) Achèche, M.; Colliex, C.; Kohl, H.; Nourtier, A.; Trebbia, P. Theoretical and Experimental Study of Plasmon Excitations in Small Metallic Spheres. Ultramicroscopy 1986, 20, 99−105.
(21) Nelayah, J.; Kociak, M.; Stephan, O.; Garcia de Abajo, F. J.; Tence, M.; Henrard, L.; Taverna, D.; Pastoriza-Santos, I.; Liz-Marzan, L. M.; Colliex, C. Mapping Surface Plasmons on a Single Metallic Nanoparticles. Nat. Phys. 2007, 3, 348−353.
(22) Bosman, M.; Keast, V. J.; Watanabe, M.; Maaroof, A.; Cortie, M. B. Mapping Surface Plasmons at the Nanometre Scale with an Electron Beam. Nanotechnology 2007, 18, 165505.
(23) Schaer, B.; Hohenester, U.; Trugler, A.; Hofer, F. High-Resolution Surface Plasmon Imaging of Gold Nanoparticles by Energy-Filtered Transmission Electron Microscopy. Phys. Rev. B 2009, 79, 041401.
(24) Roussow, D.; Couillard, M.; Vickery, J.; Kumacheva, E.; Botton, G. A. Multipolar Plasmonic Resonances in Silver Nanowire Antennas Imaged with a Subnanometer Electron Probe. Nano Lett. 2011, 11, 1499−1504.
(25) Bosman, M.; Ye, E.; Tan, S. F.; Nijhuis, C. A.; Yang, J. K. W.; Marty, R.; Mlayah, A.; Arbouet, A.; Girard, C.; Han, M. Y. Surface Plasmon Damping Quantified with an Electron Nanoprobe. Sci. Rep. 2013, 3, 1312.
(26) Arenal, R.; Blase, X.; Loiseau, A. nitride and Boron-carbonitride Nanotubes: Synthesis, Characterization and Theory. Adv. Phys. 2010, 59, 101−179.
(27) Mazzucco, S.; Geuquet, N.; Ye, J.; Stephan, O.; Van Roy, W.; Van Dorpe, P.; Henrard, L.; Kociak, M. Ultralocal Modification of Surface Plasmons Properties in Silver Nanocubes. Nano Lett. 2012, 12, 1288−1294.
(28) Geuquet, N.; Henrard, L. EELS and Optical Response of a Noble Metal Nanoparticle in the Frame of a Discrete Dipole Approximation. Ultramicroscopy 2010, 110, 1075−1080.
(29) Myroshnychenko, V.; Rodriguez-Fernandez, J.; Pastoriza-Santos, I.; Funston, A. M.; Novo, C.; Mulvaney, P.; Liz-Marzan, L. M.; Garcia de Abajo, F. J. Modelling the Optical Response of Gold Nanoparticles. Chem. Soc. Rev. 2008, 37, 1792−1805.
(30) Saxton, W.; Baumeister, W.; Hahn, M. Three-Dimensional Reconstruction of Imperfect Two-Dimensional Crystals. Ultramicro-scopy 1984, 13, 57−70.
(31) Kremer, J. R.; Mastronarde, D. N.; Mc Intosh, J. R. Computer Visualization of Three-Dimensional Image Data Using IMOD. J. Struct. Biol. 1996, 116, 71−76.
(32) Gordon, R.; Bender, R.; Herman, G. T. Algebraic Reconstruction Techniques (ART) for Three-Dimensional Electron Microscopy and X-ray Photography. Journal of Theoretical Biology A 1970, 29, 471−481.
(33) Messaoudi, C.; Boudier, T.; Sorzano, C. O. S.; Marco, S. TomoJ: Tomography Software for Three-Dimensional Reconstruction in Transmission Electron Microscopy. CBMC Bioinformatics 2007, 8, 288.
(34) Jeanguillaume, C.; Colliex, C. Spectrum-Image: the Next Step in EELS Digital Acquisition and Processing. Ultramicroscopy 1989, 28, 252−257.
(35) Arenal, R.; De la Peña, F.; Stephan, O.; Walls, M.; Tence, M.; Loiseau, A.; Colliex, C. Extending the Analysis of EELS Spectrum-Imaging Data, from Elemental to Bond Mapping in Complex Nanostructures. Ultramicroscopy 2008, 109, 32−38.
(36) Egerton, R. F. Electron Energy-Loss Spectroscopy in the Electron Microscope; Plenum: New York, 1996.
(37) Goodman, J. J.; Draine, B. T.; Flatau, P. J. Application of Fast-Fourier-Transform Techniques to the Discrete-Dipole Approximation. Opt. Lett. 1991, 16, 1198−1200.
(38) Palik, E. D. Handbook of Optical Constant of Solids; Academic Press: London, 1985.
(39) Johnson, P. B.; Christy, R. W. Optical Constants of the Noble Metals. Phys. Rev. B 1972, 6, 4370−4379.
(40) Pincella, F.; Yeji Song, Y.; Ochiai, T.; Isozaki, K.; Sakamoto, K.; Miki, K. Square-Centimeter-Scale 2D-Arrays of Au@Ag Core−Shell Nanoparticles Towards Practical SERS Substrates with Enhancement Factor of 107. Chem. Phys. Lett. 2014, 605−606, 115−120.
(41) Dong, X.; Zhou, J.; Liu, X.; Lin, D.; Zha, L. Preparation of Monodisperse Bimetallic Nanorods with Gold Nanorod Core and Silver Shell and their Plasmonic Property and SERS Efficiency. J. Raman Spectrosc. 2014, 45, 431−437.
(42) Tsao, Y. C.; Rej, S.; Chiu, C.-Y.; Huang, M. H. Aqueous Phase Synthesis of Au−Ag Core−Shell Nanocrystals with Tunable Shapes
and Their Optical and Catalytic Properties. J. Am. Chem. Soc. 2014, 136, 396−404.
(43) Goris, B.; Guzzinati, G.; Fernández-López, C.; Pérez-Juste, J.; Liz-Marzán, L. M.; Trügler, A.; Hohenester, U.; Verbeeck, J.; Bals, S.; Van Tendeloo, G. Plasmon Mapping in Au@Ag Nanocube Assemblies. J. Phys. Chem. C 2014, 118, 15356−15362.
(44) Yang, Y.; Liu, J.; Fu, Z.-W.; Qin, D. Galvanic Replacement-Free Deposition of Au on Ag for Core−Shell Nanocubes with Enhanced Chemical Stability and SERS Activity. J. Am. Chem. Soc. 2014, 136, 8153−8156.
The Journal of Physical Chemistry C Article
dx.doi.org/10.1021/jp5066105| J. Phys. Chem. C 2014, 118, 25643−25650