HAL Id: tel-03212693
https://tel.archives-ouvertes.fr/tel-03212693
Submitted on 29 Apr 2021HAL is a multi-disciplinary open access
archive for the deposit and dissemination of sci-entific research documents, whether they are pub-lished or not. The documents may come from
L’archive ouverte pluridisciplinaire HAL, est destinée au dépôt et à la diffusion de documents scientifiques de niveau recherche, publiés ou non, émanant des établissements d’enseignement et de
Modeling of aerodynamics and thermal effects in
multiperforations using LES
Dorian Lahbib
To cite this version:
Dorian Lahbib. Modeling of aerodynamics and thermal effects in multiperforations using LES. Fluid mechanics [physics.class-ph]. Université Montpellier, 2015. English. �NNT : 2015MONTS287�. �tel-03212693�
.
THESE
En vue de l’obtention du
DOCTORAT DE L’UNIVERSITE DE
MONTPELLIER
D´elivr´e par Universit´e de Montpellier Sp´ecialit´e : Math´ematiques et mod´elisation
Pr´
esent´
ee et soutenue par Dorian Lahbib
le 17 d´ecembre 2015
Mod´
elisation a´
erodynamique et thermique
des multiperforations en LES
JURY
Dr. Pascal Bruel Universit´e de Pau Rapporteur Dr. Marc-Paul Errera ONERA, Chˆatillon Rapporteur Pr. Bruno Koobus Universit´e de Montpellier Examinateur Dr. Eric Serre Laboratoire M2P2, Aix-Marseille Examinateur Dr. Simon Mendez Universit´e de Montpellier Invite
Dr. Vincent Moureau CORIA, Rouen Invite
Pr. Franck Nicoud Universit´e de Montpellier Directeur de th`ese Dr. Antoine Dauptain CERFACS, Toulouse Codirecteur de th`ese Dr. St´ephane Richard Turbomeca, Pau Invit´e
Ecole doctorale: Information, Structures et Systemes (I2S) Unit´e de recherche: CERFACS
R´esum´e
La multi-perforations est un syst`eme de refroidissement fr´equemment utilis´e pour r´eduire les contraintes thermiques des parois de la chambre de combustion. Le principe consiste `
a injecter de l’air froid `a travers des milliers de perforations de taille inf´erieure au mil-lim`etre. Comme les simulations num´eriques avec r´esolution de l’´ecoulement en proche
paroi sont trop coˆuteuses en temps de calcul de part la pr´esence de petites ´echelles venant
des jets, des mod`eles ont ´et´e propos´es. Un mod`ele homog`ene adiabatique repr´esentant l’a´erodynamique de l’´ecoulement autour de la plaque, bas´e sur la Simulation aux Grandes Echelles d’une plaque perfor´ee infinie a ´et´e propos´e. Il a ensuite ´et´e ´etendu pour mod´eliser
le comportement a´erothermique de l’´ecoulement autour de la plaque, `a partir de
cal-culs r´esolus des ´equations de Navier Stokes moyenn´ees. Les objectifs de cette th`ese sont d’une part d’´evaluer la r´epartition des flux de chaleur autour de la plaque pr´edite par le mod`ele homog`ene et de proposer un mod`ele pour prendre en compte l’effet de la multi-perforations sur l’´ecoulement. Des simulations des Grandes Echelles ont ´et´e coupl´ees avec un code r´esolvant l’´equation de la chaleur afin de connaitre la structure de l’´ecoulement et la
r´epartition des flux de chaleur autour de la plaque. Deux configurations, `a un point de
fonc-tionnement repr´esentatif des conditions dans les chambres ont ´et´e ´etudi´ees: deux canaux communiquent via 12 rang´ees de trous coniques orient´es dans le sens de l’´ecoulement ou pr´esentant un angle de d´eviation. Les donn´ees g´en´er´ees par les Simulation des Grandes Echelles ont ´et´e compar´ees au mod`ele homog`ene et une m´ethodologie est propos´ee pour corriger la mauvaise estimation du flux de chaleur induite par l’impl´ementation num´erique. Cette m´ethodologie peut ˆetre ´etendue pour d’autres approches comme le mod`ele de trou ´epaissi qui repr´esente des trous ´epaissis en fonction de la r´esolution du maillage par rap-port au diam`etre des trous.
Abstract
Effusion cooling is frequently used to lower the thermal constraints of combustion chambers in aeronautical gas turbines. It consists of injecting a cold air flow through submillimetric holes drilled in the liners. The resolution of the flow in the near-wall regions in 3-D combustion chamber calculations is out of reach in terms of computational cost due to the presence of small scales. Models were proposed to reduce the computational cost in previous works. An adiabatic homogeneous model, to represent the aerodynamics around the plate, based on the resolved Large Eddy Simulation of an infinite perforated plate was proposed. It was later extended to model the aerothermal behavior of the flow, based on resolved RANS calculations. The objectives of this work are to evaluate the homogeneous aerothermal predictions regarding the flux repartition and to propose a model to account for effusion cooling in industrial computations of the flow around the perforated plate. Large Eddy Simulations coupled with a thermal solver have been performed in order to get insight of the flow organization and the heat flux repartition around the plate. Two configurations at a representative aero engine operating point are studied: two channels separated by 12 converging rows with either perforations oriented in the main flow direction or with an angle of deviation. The data from the Large Eddy Simulations have been compared with the homogeneous model and a methodology is proposed to tackle the heat flux miscalculation due to the numerical implementation. This methodology is not limited to the homogeneous approach, it extends to other approaches such as the thickened perforation model presented in this work which represents enlarged holes based on the size of the cell relative to the hole diameter.
Remerciements
Il serait r´educteur de consid´erer le travail de th`ese comme le travail d’une seule personne tant le soutien et la pr´esence de nombreuses personnes ont compt´e pour beaucoup dans sa r´ealisation. Cette th`ese ne fait pas exception `a la r`egle et cette page est d´edi´ee aux personnes qui ont rendu ce travail possible, d’une part, et bien souvent agr´eable. J’en profite ´egalement pour rappeler que cette th`ese CIFRE a pu voir le jour grˆace `a une collaboration entre Turbomeca (groupe SAFRAN) et le CERFACS (Centre Europ´een de Recherche Avanc´ee en Calcul Scientifique).
Je tiens `a remercier, dans un premier temps, Franck Nicoud, mon di-recteur de th`ese, pour m’avoir guid´e au cours de ces trois ans et demi pass´es au CERFACS. Je tiens ´egalement `a remercier particuli`erement An-toine Dauptain pour son encadrement et son ouverture sur le monde de l’entreprise et Florent Duchaine pour ses conseils et discussions sur la ther-mique, le couplage multi-codes et bien d’autres choses encore. Je souhaite remercier Thomas Lederlin et St´ephane Richard, mes encadrants industriels pour leur disponibilit´e et leurs suggestions. Je remercie ´egalement Thierry Poinsot, chef de l’´equipe CFD, de m’avoir accueilli dans son groupe.
Je souhaite remercier les membres du jury Pascal Bruel, Marc-Paul Er-rera, Eric Serre, Bruno Koobus, Vincent Moureau et Simon Mendez pour avoir accept´e de faire partie du jury et ´evaluer ce travail. Leur intˆeret et leurs nombreuses questions ont ouvert de nombreuses pistes de r´eflexions pour Romain, le th´esard qui reprend le flambeau, que je salue et remercie pour son aide en fin de th`ese.
J’adresse ensuite mes remerciements aux personnes qui font du CER-FACS un endroit privil´egi´e. Je pense tout d’abord aux personnes du service informatique CSG: Fabrice, G´erard, Isabelle pour leur efficacit´e redoutable et aux personnes de l’administration: Marie, Michelle et Chantal qui rendent la vie de tous les jours un peu plus l´eg`ere.
J’en viens enfin aux remerciements un peu plus personnels. Citons tout d’abord les camarades d’infortune qui ont v´ecu et partag´e les grandes vic-toires et petites d´efaites (parfois l’inverse) quotidiennes qui jalonnent le chemin de th`ese: Thomas, Charlie, Adrien, Rapha¨el, Lucas, Jeff, Antho, Mika et Corentin. Leur aide dans diff´erents domaines d’expertise allant de la science au num´erique, en passant par la coinche, a ´et´e pr´ecieuse. Un grand merci aussi `a Thomas pour tous ses conseils sur les diff´erentes petites et grandes choses qui font la vie mais ´egalement pour les nombreux d´epannages en moto! Merci `a mes parents sans qui je ne serai pas l`a, pour des raisons ´elementaires mais surtout diverses. Enfin, merci `a Sarah pour l’´equilibre et la pers´ev´erance insuffl´es au cours de la derni`ere ann´ee et pour m’avoir, sans jamais faillir, support´e!
Contents
Global introduction 1
1 Bibliography about the multi-perforated plates 4
1.1 Geometrical and dynamics characteristics . . . 5
1.1.1 Geometric parameters . . . 5
1.1.2 Flow characteristics . . . 7
1.1.3 Adiabatic and effective efficiencies . . . 9
1.2 Study of the dynamics . . . 11
1.2.1 Global structure of the flow . . . 12
1.2.2 Characteristic vortex structures . . . 16
1.2.3 Trajectory of the jet . . . 18
1.2.4 Description of the film cooling . . . 19
1.3 Thermal transfers around a multi perforated plate . . . 21
1.3.1 Heat balance . . . 21
1.3.2 Heat transfer coefficient . . . 23
1.4 Modeling of a multiperforated plate . . . 27
1.4.1 Homogeneous description of the dynamics . . . 27
1.4.2 A homogeneous modelisation of the heat fluxes . . . . 29
1.4.3 Heterogeneous modelisation . . . 32
1.4.4 Resolved and meshed perforations . . . 33
1.4.5 Wall law approaches . . . 33
1.5 Related studies . . . 34
1.6 Thesis strategy . . . 36
1.7 Large Eddy Simulations . . . 37
2 Numerical data base 41 2.1 Flow configuration . . . 42
2.2 Numerics . . . 44
2.2.1 Coupled Calculations solvers . . . 44
2.2.2 Coupling parameters . . . 46
2.3.1 General flow description . . . 51
2.3.2 Impact of the thermal boundary condition . . . 56
2.3.3 Temperature profiles . . . 61
2.4 Comparison with the law of the wall approach . . . 65
2.5 Comparison of the heat transfer with empirical relations . . . 65
2.5.1 Extension of the empirical relations to non cylindrical perforations . . . 66
2.5.2 Comparison in the context of a perfect case. . . 67
2.6 Heat flux distribution . . . 69
2.7 Estimation of the error due to first cell measurement in a re-solved case. . . 71
2.8 General discussion . . . 74
3 Proposition of a homogeneous aerothermal model 76 3.1 Presentation of the model . . . 77
3.1.1 Principle . . . 77
3.1.2 Estimation of the adiabatic temperature . . . 79
3.1.3 Estimation of the main flow characteristics . . . 79
3.2 Validation of the adiabatic temperature estimation . . . 80
3.2.1 Homogeneous case . . . 81
3.3 Results obtained on the Maveric-H setup . . . 84
3.3.1 Coupling parameters . . . 85
3.3.2 Calculation of the plate temperature via coupled sim-ulations . . . 86
3.4 General discussion . . . 88
4 Proposition of a thickened perforation model for the hetero-geneous approach 89 4.0.1 Discussion about the mesh resolution and the models . 90 4.1 Thickened perforation model . . . 92
4.1.1 Principle . . . 92 4.1.2 Implementation . . . 93 4.2 Reference case . . . 94 4.2.1 Boundary conditions . . . 95 4.3 Results . . . 96 4.3.1 Momentum profiles . . . 97 4.3.2 Temperature profiles . . . 100
4.4 Evaluation of the mixture temperature . . . 101
5 Study of the deviation 104
5.1 Flow configuration . . . 105
5.2 Numerics . . . 108
5.3 Results . . . 111
5.3.1 General flow description . . . 111
5.3.2 Impact of the thermal boundary condition . . . 116
5.3.3 Temperature profiles . . . 118
5.4 General discussion about the impact of the deviation . . . 121
5.4.1 Discharge coefficient . . . 121
5.4.2 Adiabatic effectiveness . . . 122
5.4.3 Plate temperature . . . 123
5.4.4 Heat flux distribution around the plate . . . 124
5.4.5 Heat flux coefficient. . . 125
5.5 Comparison with the homogeneous and thickened hole model . 127 5.5.1 Set up . . . 127
5.5.2 Boundary conditions . . . 127
5.5.3 Results. . . 128
5.6 Evaluation of the mixture temperature . . . 133
5.7 Extension to a dynamic height for the mixure temperature estimation . . . 137
6 Application to an industrial configuration 141 6.1 Flow configuration . . . 142 6.1.1 Setup . . . 142 6.1.2 Boundary conditions . . . 143 6.2 Results . . . 143 6.2.1 Radial fields . . . 144 6.2.2 Longitudinal fields . . . 146
6.2.3 Plots over lines in the centerline plane . . . 150
6.2.4 Plate temperature investigation . . . 157
6.3 Global discussion . . . 158
Conclusion 160 Appendices 163 Map of quasi adiabatic criterion . . . 164
Autosimilarity criterion. . . 167
Comparison with a RANS calculation . . . 170
Introduction
The market of helicopter engines is highly concurrential, with a strong sensi-tivity to the global economy. For example, the low price of fuel per barrel in 2015 makes the offshore fuel production less profitable, reducing the renewal of helicopter fleets worldwide, Fig 1. In this context, Turbomeca, the world leader in helicopter turbine engines in 2015, has to design the most reliable and performant engines to stress its difference from their competitors.
Figure 1: Image of a helicopter at take-off.
To improve gas turbine efficiency, the pressure in the combustion chamber is increased, resulting into a higher thermal load of the combustion chamber walls and the turbine blades. Cooling systems such as multi-perforated plates are in this context good candidates to lower the thermal constraints on the combustor liners. Such technological devices consist in introducing, through
thousands of submillimetric holes as shown in Fig2, a cold air flow into the boundary layer of the chamber wall. Along the different rows, a thick film is created at the wall which protects the liners from the burnt gases.
Figure 2: View of a Turbomeca annular combustion chamber with temper-ature sensitive paint (false colors). The perforations and the dilution holes are visible. Courtesy of Turbomeca.
Though commonly used in industrial applications, optimizing the injected mass of coolant to maintain the surface temperature below a critical value is still the subject of active research. The heat flux exchanged between the casing and the combustion chamber and within the plate apertures must be taken into account to properly estimate the plate temperature. These fluxes are of different nature: the flame and the walls generate radiative fluxes, the temperature difference between the liner and the flow generates conductive fluxes, and the coolant from the plate produces convective fluxes.
Numerical simulations are now commonly used in the design of new com-bustion chambers due to the computational power increase. The represen-tation of the liners in numerical simulations is not possible due to the size of the perforations compared to other length scales. The resolution of thou-sands of jets implies cumbersome computational times, not compatible with the return time expected in industry. The homogeneous approach, which considers the multi perforated plate as a porous plate injecting all over its
surface, has been proposed by Mendez and Nicoud [2008b] at CERFACS to model the aerodynamic behavior of the flow around the plate. It was later extended to model the conductive fluxes around the plate by Cottin [2013] at ONERA. If the radiative fluxes are neglected, the plate temperature can be calculated with numerical simulations coupling a flow solver, where the multi-perforated plates are represented with the homogeous approach and a thermal solver. In parallel,Florenciano[2013] at UPPA (Universit´e de Pau et des Pays de l’Adour) shown how the Large Eddy Simulation approach could help to understand the conjugate heat transfer problem of a multiperforated plate.
In the wake of these authors, the main objective of the present work is to provide a multiperforated plate model suited to aerothermal simula-tions using LES with a coupled thermal solver. The major constraint is the robustness of this model with respect to the grid size, the perforations rep-resentation, and the perforation deviation.
This manuscript starts with a bibliographical survey (Chapter 1) where it is shown that a database is missing for the quantitative validation of aerother-mal models of multiperforated plates in specific helicopter engine conditions. A numerical database is built (Chapter 2) to address this lack of information, with a simulation approach similar to the Phd work of Florenciano [2013]. Then, the aerothermal model of Cottin [2013] is improved (Chapter 3) to address the shortcomings identified by its author, namely the estimation of an adiabatic temperature in a general case. The homogeneous mulitperfo-rated plate model of Mendez and Nicoud [2008b]-Cerfacs is underlying the model of Cottin. Its application range is extended (Chapter 4) through a heterogeneous formulation robust to mesh resolutions. As both Mendez and Cottin warned about the lack of data on non-longitudinal flows, i.e. per-forations with deviation, the database of Chapter 2, the thermal model of Chapter 3 and the heterogeneous model of Chapter 4 are extended with per-foration showing 45 degrees of deviation (Chapter 5). Finally, the impact of thermal model and heterogenous models are showed on a realistic helicopter combustor (Chapter 6) with some restrictions due to confidentiality issues.
This research has been supported by Turbomeca-Safran Group through a CIFRE contract between Turbomeca and Cerfacs. The following computa-tions have been performed on the supercomputers CURIE and OCCIGEN, thanks to PRACE and GENCI allocations respectively.
Chapter 1
Bibliography about the
multi-perforated plates
R´esum´e: Ce chapitre introduit les param`etres g´eom´etriques qui caract´erisent une plaque multiperfor´ee puis les param`etres de l’´ecoulement utilis´es pour d´efinir le r´egime de fonctionnement. Ces deux types de param`etres jouent sur l’efficacit´e thermique de la plaque. La temp´erature de la plaque d´epend de plusieurs modes de transfert d’´energie autour de celle ci. La prise en compte de ces transferts d’´energie n´ecessite la r´esolution de diff´erents types de physiques qui requi`erent des m´ethodes num´eriques couteuses, hors de port´ee des moyens actuels. Les mod´elisations existantes pour r´eduire le coˆut de calcul sont discut´ees et analys´ees.
Abstract: This chapter introduces the geometric parameters to character-ize a multi-perforated plate and the aerodynamics parameters for the operat-ing point. The cooloperat-ing efficiency depends on these two types of parameters. The plate temperature depends on different types of energy transfer. These energy fluxes can be estimated with costly numerical methods out of reach for industrial configurations. The models proposed to reduce the computional cost are discussed and analyzed.
1.1
Geometrical and dynamics characteristics
In this chapter, the geometrical parameters defining a multi-perforated plate and the dimensionless quantities characterising the dynamics are presented.
1.1.1
Geometric parameters
A multi perforated plate is a plate with several perforations which separates the hot flow, the main flow, from the cold flow, the secondary flow or coolant. In helicopter engines, the injected air comes from the compressor via the plenum and a film is created by coalescence of the other jets. Figure 1.1
presents the cooling principle of a multi perforated plate.
Hot air
Cold air
Effusive jets
Film cooling
Figure 1.1: Principle of a multi perforated plate
The geometric parameters needed to define a multi perforated plate are the diameter of the perforation D, the number of perforations, the number of rows and their disposition - in line or staggered-. Metzger et al. [1973] showed that staggered configurations provide the best cooling effectiveness. The jets cover a wider surface and the plate is globally more cooled. The distance between two consecutives holes along the direction of the flow (∆x) and in the spanwise direction (∆z) influence the heat transfer. Two angles are defined : α, the penetration angle and β, the deviation angle. They are defined with a local base (~x, ~y, ~z). This direct orthonormal system is defined from the normal vector ~y to the surface on the hot side and from the main direction of the flow ~x.
~z = ~x ∧ ~y (1.1) A perforation is defined as normal to the plate when α = 0 (for any β). The geometric parameters are the same for the two sides, though differences may exist due to the precision and the technique of the drilling.
The thickness of the plate e and the length of the perforation L are linked to the penetration angle with the following relation :
L = e
cos(α) (1.2)
The ratio L/D determines if the perforation is long enough for the flow to reach an equilibrium before exiting the hole. If so, the state of the flow at the outlet of the perforation is independent of the flow at the inlet, on the suction side. This ratio has an impact on the acoustic damping and the dynamics, notably the pressure loss and thermal effects within the hole. The geometric parameters are displayed in Fig 1.2.
∆x ∆z α β x x y z e D D Injection side Suction side Flow direction Jet direction
Figure 1.2: Geometric plate parameters. Box : perforations with a deviation angle β. The main flow is along the ~x direction.
The porosity represents the ratio of the surface of the perforations to the surface of the plate :
σ = Sperf orations Splate
(1.3)
It is calculated with a periodic shape around the center of a perforation whose size is linked to the hole-to-hole distances ∆x and ∆z and contains only one perforation. The total surface of the plate corresponds to the area of the periodic pattern and the perforation surface corresponds to the elliptic area of the hole on the wall. Since the problem is axisymetric, the angle of deviation β has no influence. The local porosity is defined as :
σ = π
4(∆x/D)(∆z/D)sin(α) (1.4) The porosity is sometimes defined with the bulk surface in the perforation:
σbulk =
π
From now on, the porosity will refer to the definition of the local porosity σ. The hole surface on the liner at the injection side (respectively suction side) will refer to s1 (respectively s2).
The geometric parameters are not independant: the porosity depends on the number of holes, the diameter, the distances ∆x, ∆z and the angle α and the ratio L/D. These parameters are chosen to ensure reliability, efficient cooling in regards to mechanical constraints (the number of rows and the distances between the holes for instance). Defining the best set of parameters is still an open and difficult question.
Typical values of the different parameters used in helicopter engines are given in Table 1.1.
Parameters Order of magnitude D 0.3 to 1 mm ∆x/D 4 to 8 ∆z/D 4 to 8 e/D 1 to 3 α 15o to 90o β 0 to 90o σ 1% to 19%
Table 1.1: Geometrical parameters in a helicopter engine
1.1.2
Flow characteristics
The flow can also be characterized using dimensionless values linked to jets in crossflow, in particular the blowing ratio M and the momentum ratio J, Eq 1.6,1.7. They are based on the velocity and density of the main hot flow and the jet, Fig 1.3.
M = ρjVj ρhotVhot (1.6) J = ρjV 2 j ρhotVhot2 (1.7)
where the subscripts j and hot denote the jet and the heated side respectively. V represents the bulk velocity and ρ the density.
The blowing and momentum ratios influence the dynamics and the ther-mal fluxes around the plate Scrittore et al. [2007]. The blowing ratio is related to the thermal transport capacity, the convective transport is related to the convective flux ρV Cp while the momentum flux ratio is related to the
Vj ρ1 U U1 2 ρ ρ j 2 U hot Uhot
U
hotρ
hotU
coldρ
coldU
jetρ
jetFigure 1.3: Definition of the different speeds and mass densities used to describe the flow.
dynamics of the interaction of the mainstream and on the coolant. Rouvreau
[2001] measured a robust film for quite high blowing ratio M, around 5.5, on a configuration of 21 rows. Ammari et al. [1990] found that the blowing and momentum ratios cannot be directly correlated to the cooling of the plate.
Many studies focus on turbine blades cooling with blowing ratios M vary-ing from 0.1 to 2 and a density ratio ( ρjet/ρhot ) around 2Bogard and Thole
[2006]. For the turbine blades, the cooling aims at protecting very specific zones that sustains important thermal constraints. Hence, it is common to find in the literature an optimal blowing ratio of 0.3 which corresponds to tur-bine blade cooling problems. Reviews of cooling effiency studies for turtur-bine blades can be found inKrewinkel [2013], Bogard and Thole [2006].
For combustion chambers, the blowing and momentum ratio globally range from 8 to 20 and from 45 to 78 respectively. For combustor liners with numerous rows, the cooling aims at creating a persistent film down-stream of the hole and not necessarily at the hole location, contrarily to the turbine blades, since the first holes are protected by dilution holes, film cool-ing as well as recirculation zones Scrittore et al. [2005].
The Mach number in turbines blades is also greater than in the stud-ies dedicated to combustor liners but this parameter is of mild importance
signif-icant effect on the cooling effectiveness Eriksen and Goldstein[1974],
Cham-pion [1997]. Kadotami and Goldstein [1979] investigated the influence of
turbulent intensity. For blowing ratio higher than 1, the higher velocity gradient in the boundary layer reduces the jet penetration in the hot flow, leading to better cooling effectiveness. The opposite effect is observed for small blowing ratio due to enhanced mixing close to the wall.
The coefficient of discharge CD is defined as:
∆P = 1 2ρ ~V
2C2
D (1.8)
with ∆P = Pcold− Phot the pressure difference across the perforation and ~V
the velocity vector. In compressible flows, ρ ~V2 is not constant in the hole
and the discharge coefficient CD is generally defined based on the injection
side conditions, which are easier to obtain experimentally. The coefficient of discharge is modified by geometric parameters such as the length of the perforation, the angles or the rugosity.
The shape of the hole is influenced by the drilling technique which modifies the hole geometry. Most [2007] calculated discharge coefficients CD, going
from 0.6 to 0.8 for cylindrical and converging holes respectively. A change of the perforation shape always increases the discharge coefficient. An evased hole produced wider spanwise jets at the outlet and more attached films. The aerodynamics and geometrical parameters modify the mixing mecha-nisms and the cooling of the plate. To characterize the cooling effectiveness of the multi perforated plates, the adiabatic and effective efficiencies are used.
1.1.3
Adiabatic and effective efficiencies
The adiabatic effectiveness
The adiabatic temperature of the wall is the temperature of the wall with a zero heat flux (Φcv = 0) and appears appropriate for the multi perforated
plate according to the work of Harrison and Bogard [2008], Har [2008]. In the region without cooling, the adiabatic temperature corresponds to the temperature of the main flow near the wall whereas downstream of the per-forations, the adiabatic temperature is a mixture temperature.
The heat flux is written :
qwall = h(Twall− Tadiab) (1.9)
The adiabatic temperature is a function of the geometry, the primary and secondary flow fields. It is related to the film coverage and the mixing mech-anisms from the turbulent structures. An adimensionnal parameter called
the adiabatic effectiveness is defined to quantify the cooling effect of the jet, Eq 1.10. ηadiab= Thot− Tadiab Thot− Tcold (1.10) The adiabatic effectiveness is 0 where the adiabatic wall temperature is equal to the main flow temperature - no cooling - . It is equal to unity when the adiabatic wall temperature is equal to the secondary flow temperature -ideal cooling -. This quantity is used in many studies to evaluate the cool-ing effectiveness because experimentally, the adiabatic temperature can be obtained by insulating the plate. Tadiabcan also be estimated thanks to a
con-centration measurement assuming that the Lewis number, Eq 1.11, is equal to unity. The Lewis number compares the mass and the thermal diffusivity and a value of 1 is a hypothesis often used in combustion problems.
Le = λ ρCpDi
= 1 (1.11)
where Di is the mass diffusivity.
The effective approach
In the effective approach, the reference temperature used is the temperature of the hot gases :
qwall,hot= hhot(Twall− Thot) (1.12)
This relation has been used by Crawford et al. [1980a,b], Rouvreau [2001],
Messaadi [2003]. As for the adiabatic approach, the effective effectiveness
reads :
η = Thot− Twall Tcold− Thot
(1.13) The heat transfer coefficient scales linearly of the inverse of the effective effectiveness.
The adiabatic effectiveness measures the film coverage effectiveness while the effective effectiveness mesures both film coverage effectiveness and the cooling within the apertures and on the suction side.
Relation between the two approaches
In the literature of turbine blade cooling, the cooling effectiveness is often discussed in terms of heat flux reduction (HFR) introduced by Mick and
Mayle [1988]. The heat flux reduction compares the heat flux measured at the wall with the heat flux at the wall without film cooling qwall,0 and reads:
qwall/qw,0 = (hadiab/h0)(1 − ηadiab/η) (1.14)
where h0 is the heat transfer coefficient in the configuration without film
cooling i.e composed of a plain conducting plane without hole. Three cal-culations are thus necessary to obtain the HFR: an adiabatic computation and two coupled calculations (with and without film cooling). Wang and Zhao [2011] discusses critical points in this methodology such as the use of a constant effective effectiveness, the use of a heated surface to provide a simplified approach to simulate the film cooling condition, and the similarity of the recovery temperature with the adiabatic temperature. The heat flux reduction formulation is frequently used in the context of turbine blade cool-ing due to the numerous experiments and the empirical correlations on which they are based upon. It is worth mentioning that the turbine blade only pos-sess several rows of perforations working at lower blowing and momentum ratios than the combustor liners. As a result, the jet-to-jet interaction is not as important. Film-cooling correlations are more suitable on configura-tions with small jet-to-jet interacconfigura-tionsColban et al.[2011],Hatch and Papell
[1959]. For combustors, the correlation proposed by Goldstein [1971] for a single perforation extended to several rows by Mayle and Camarata [1975] was compared to the experimental results of Rouvreau [2001]. Good ac-cordance on the adiabatic effectiveness is observed at the first rows for low blowing and momentum ratio (M<2 and J<1.3) however differences up to 25% are observed at the end of the perforated plate. For higher blowing ratio (M=4 and J=5.9), the correlation overestimates (≈ 20%) the adiabatic effectiveness at the first rows while it underestimates (≈ 5%) the adiabatic effectiveness. Emidio[1998] concludes that these correlations appear unfitted to combustors.
1.2
Study of the dynamics
Drilling perforations on a flat plane introduces complex turbulent structures studied since 1960. First, turbine blades configurations were principally stud-ied with one or two rows of perforations LeBrocq et al.[1973],Metzger et al.
[1973], Crawford et al. [1980b], Yavuzkurt et al. [1980]. Aerothermal
condi-tions with ambiant air temperature, small velocities and pressure difference across the plate are not representative of a combustion chamber. Many ex-perimental and numerical configurations also deal with normal perforation while angled perforation with a mean penetration angle α equal to 30o are
frequently found in combustors Andreopoulos and Rodi [1984].
Because of the small perforation diameter, experimental configurations are built with a scaling factor up to twelve, with the reduced velocities with respect to the Reynolds analogy.
1.2.1
Global structure of the flow
Suction side
Few works describe the flow from the secondary flow through the perforation to the main flow (Peet[2006],Mendez and Nicoud[2008a],Zhong and Brown
[2009], Cottin [2013], Callejo et al. [2015]). In some cases, the flow is still
on the suction side and/or only one perforation is present. Normal velocity measurements on the suction side presented in the work of Peet [2006] are displayed figure 1.4. The curves show that two diameters upstream of the perforation, the flow is still undisturbed by the strong gradient pressure. Closer to the perforation, the normal velocity increases and the maximum is found at the downstream corner of the perforation. The influence of the pressure gradient on the secondary flow in the normal direction is also visible : 2 D below the perforation, the vertical velocity increases, its amplitude is small but the flow is disturbed on a longitudinal length of the size of the perforation.
MacManus and Eaton[2000] described the suction with a laminar
bound-ary layer reproduced in Fig1.5. A deformation of the flow occurs, called mean distorsion flow due to the pressure gradient: the normal velocity increases near the perforation as well as the longitudinal velocity. On each side of the perforation, the flow is sucked in the perforation creating inflectional veloc-ity profiles. At the perforation, the presence of both normal and transverse velocities generates two strong longitudinal vorticity zones or more depend-ing on the flow regime. The vortices are then convected downstream, away from the wall, and cause turbulence transition several diameters downstream. They locally increase the shear stress downstream of the hole as shown in the work of Mendez and Nicoud [2008a].
In the perforation
For L/D=10 or larger, the perforations are long enough to present small de-pendance of the upstream flow coming from the suction side. This hypothesis is not valid for combustors involving L/D ratio between 2 an 5.
Figure 1.4: Dimensionless mean normal velocity profiles on the suction side on the symmetry plane (z=0) fromPeet[2006]. Distance from the wall (from top to bottom) : ∆y = 0, 0.25 D, 0.5 D, D, 2D. The dashed line locates the center of the perforation.
Figure 1.5: Flow structure of a laminar boundary layer suction around a perforation from MacManus and Eaton [2000]
Figure 1.6: Averaged field in the perforation fromPeet[2006]. Left : velocity field and stream lines. Middle : Normal velocity field and stream lines. Right : Normal slice at the entrace displaying normal velocity
• For experimental configurations, optical access in the perforation for measurements is not available and the use of probes is complex. • The plate parameters are set up based on external constraints such
as the mechanical stress and the angles of the perforation. The flow in the perforation is then not a conception parameter but rather a consequence of the design.
• The drilling technique does not create perfect cylindric holes. Their shape can vary also because of the small lengths of the perforations. Though it is possible to reproduce the liner in experimental configura-tions by using the same drilling techniques, most numerical simulaconfigura-tions consider perfect perforation shape.
Since the perforation is not long enough for the flow to be fully developed, the jet is highly dependent of the flow in the perforation. The transfers occuring in this region must be taken into account when total heat balance is considered. The internal cooling is of first order due to the important surface within the holes. The strong heterogeneities along the perforation generate important heat transfer as shown by Nguyen and Dorignac [2008].
The flow in the perforation presents a separation at the edge of the en-trance due to a strong pressure gradient. The fluid enters the perforation with an important normal velocity, resulting in high angled trajectories :
Peet [2006] observed up to 135o from the plate on the separation zone. The
flow can be split in two parts according to Leylek and Zerkle [1994] : a jet region on the upper part at the wall at the entrance and a slow region area
Figure 1.7: Averaged velocity field in the perforation fromLeylek and Zerkle
[1994]. Left : symetry plan. Right : normal slice to the perforation displaying tangential velocity.
below it as illustrated in Fig 1.6. A pair of counter rotating vortices can also be seen in the low speed region. Note that the geometry plays a significant role: normal oriented perforations do not present such strong heterogeneities at the entrance Walters and Leylek [2000]. Their numerical results are re-ported in Fig 1.7 where a horseshoe structure similar to the one developing at the injection side is visible.
Between the jetting region and the low speed area at the entrance, vortices are created and convected through the perforation adding turbulent fluctu-ations for the outgoing jet. This intermediate zone and the separation zone both possess velocity fluctuations up to 40 % according to Peet [2006]. The turbulent structure and the flow organization within the holes are described in the work of Mendez and Nicoud [2008a].
Injection side
Mayle and Camarata[1975] studied the influence of the distance between two
holes ∆x on the cooling for blowing ratios between 0.5 and 2. Three lengths were tested : ∆x = 8D, 10D and 14D, this showed that a better coverage is obtained for the lower lengths as expected however small distance between two consecutives perforation affects the mechanical robustness of the liner. A length of about 4 to 8 diameters is generally used.
The injection angle α influences the jet penetration through the main flow. For higlhy angled perforations, the jet remains close to the wall, when it de-creases the jet mixes more with the hot gases. Andrews et al.[1988a] studied the cooling effectiveness for three angles (α = 30o, 90 and 120o). A
penetra-tion angle of 30o showed the best cooling effectiveness and is often used in
helicopter engines.
Vertical jets, with no tangential components, create important mixing and a heterogeneous film thickness along the wall is observed upstream. A strong α angle also increases the length perforation and thus the heat surface ex-change in the wall.
Emidio[1998] studied angled perforations with 120o oriented holes and gave
the same conclusion as Andrews et al. [1988a] : a good cooling effectiveness is obtained on the first rows but greatly decreases downstream due to the important mixing. An important thermal gradient was also noted on the very first row which may lower the life duration service of the liner.
The deviation angle β transfers lateral momentum to the jet. In the perfo-ration, the flow is not affected by this angle direction except at the entrance, in the separation zone with the cold flow and at the outlet McGovern and
Leylek [2000].
Eriksen and Goldstein[1974] observed how the boundary layer thickness can
impact the cooling effectiveness. In a thick boundary layer a low speed film is present at the outlet of the perforation, leading to a deeper penetration. The global cooling effectiveness is however only slightly worse because the film offers a homogeneous protection after a certain number of rows. This is only valid for blowing ratio smaller than 0.5.
1.2.2
Characteristic vortex structures
Jet in crossflow has been widely studied for industrial purpose like metal cooling or polluant emission. The interaction of the jet with the cross flow lead to complex phenomena: jet trajectory, modification of the boundary layer, apparition of turbulent structures. Margason[1993] proposed a review of all the work done in jet in crossflow.
In most of the studies, normal perforations and low blowing rates are con-sidered. Several characteristic structures have been identified in the work of
Andreopoulos and Rodi [1984] and are illustrated in Fig1.8:
• the Counter rotating Vortex Pair (CVP) is the main structure of the jet in crossflow and plays an important role in the mixing. It is present in the far field where it is aligned with the jet and develops around it.
• vortices in the shear layer appear due to a Kelvin-Helmotz instability between the jet and the main flow. They develop on the upstream and downstream faces of the jet
• the horseshoe vortices are created by the adverse pressure gradient encountered by the main flow in the wall region.
• in the wake region downstream of the jet, vertical wake vortices start at the wall and end in the jet.
• time averaged wake vortices called downstream spiral separation node (DSSN) has also been detected just downstream of the jet both ex-perimentally by Peterson and Plesniak[2004] and numerically by Hale
et al. [2000] or Peet [2006]. Counter rota*ng vor*ces Main Flow Horseshoe vor*ces Shear layer vor*ces Wake vor*ces
Figure 1.8: Representation of the vortices around jet in crossflow from Fric
and Roshko [1994]
Using doppler laser anemometry in the three directions,Gustafsson[2001] described the flow on the injection side of a multi perforated plate with a scaling factor of 10 to 1. The presence of the counter rotating vortices and two other vortices located downstream of the perforation (DSSN) are ob-served. Alike the normal configuration, the counter rotating vortices form the major structure of the jet but come from the lateral border of the jet instead of the wake region and go below the jet.
Scrittore et al.[2007] found similar results in a slightly different configuration
Simulations (LES) of 35o angled perforations with the presence of horseshoe
vortices. With angled perforation, the adverse gradient pressure is not as important as in the normal case (α = 90o) which may explain why it is was
not observed in other studies Gustafsson [2001], Tyagi and Acharya [2003].
Peet [2006]’s observations about the CVP agree with the ones of Gustafs-son. The origin of the CVP is discussed by serveral authors in the literature
(Kamotani and Greber[1972],Kelso et al.[1996],Cortelezzi and Karagozian
[2001],Majander and Siikonen[27],Mendez and Nicoud[2008a],Coletti et al.
[2013],Kalghatgi and Acharya [2014],Gevorkyan et al. [2014]).
Several authors highlighted the negative effects of CVP on the cooling effec-tiveness :
• By increasing the mixing with the main flow, the temperature of the jet increases.
• The CVP goes beneath the jet and creates strong normal velocities. The jet trajectory is deeply modified and gets farther from the wall. The boundary layer downstream of the wall is disturbed and negative normal velocity brings hot gas closer to the wall.
• A strong CVP keeps the jet condensed, reducing lateral dispersion and cooling which may cause hot spots.
Peterson and Plesniak [2004] made a review of different studies dealing
with normal and angled perforations. The influence of the aspiration side is also studied by changing the direction of the flow (co flow or counter flow). The flow in the angled perforation is greatly dependent on co flow-counter flow and this also modifies the structure on the suction side in short per-foration configurations. This highlights the strong sensitivity of the cooling effectiveness to the jet characteristics inherited from the injection side. Finally, the turbulent structures are related to the blowing rate. For large values of M, the origin of the turbulence is found in the jet. At lower blowing ratio, the shear layer between the jet and the main flow is the place where most of the turbulence is generated.
1.2.3
Trajectory of the jet
The jet trajectory greatly impacts the cooling effectiveness. A highly angled perforation with a medium blowing ratio will lead to a jet close to the wall providing a thermal protection whereas a weak penetration angle will result in a jet mixing with the main flow.
Jet trajectories are defined by the spatial position of the maximal jet ve-locities. Margason [1968], proposed a general relation, Eq 1.15 based on
empirical coefficients as well as the diameter of the hole D, the momentum ratio J and the penetration angle α. In this relation, y stands for the distance from the wall and x the distance from the center of the perforation. Other authors kept this formulation but proposed different coefficients.
x d = F ( 1 J) n (y D) m+ y D G cotan(α) (1.15) with F, n, m and G are coefficients described in Tab 1.2.
Author F n m G
Ivanov 1 1.3 3 1
Margason 1/(4sin2α) 1 3 1
Shandorov 1 1 2.55 1 + 1/I Vizel et Mostinski 5/(4sinα) 1 2 1
Table 1.2: Parameters used in the jet trajectory correlation for different authors
1.2.4
Description of the film cooling
The film cooling can be decomposed in three distinct parts as illustrated in Fig 1.9.
COUCHE LIM ITE INCIDENTE
ZO NE D’ATTAQUE
ZO NE ZO NE
ETABLIE DE RECOUVREM ENT
Hauteur defilm
Figure 1.9: Representation of the different parts of the film on a flat multi perforated plate from Mendez and Nicoud [2008a]
• The primary zone is composed of the first rows of the plate, typically 5-7. In this area, the flow is very dependent of the characteristics of the incoming of upstream of the perforations. A thin film that thickens along the plate is created. Typically after the fifth-seventh row, the film
structure is installed. This zone is dependent on the blowing ratio and the main flow direction relative to the orientation of the perforations. Higher mass flux ratios lead to higher set up distances as shown by
Scrittore et al. [2007].
• Further downstream, the film is established i.e the flow is considered homogeneous from one row to another. Steep variations can however be found in the wake of the perforations: these ”hot spots” are created by the jets vortices bringing a part of the main flow to the wall. These steep variations can reduce the service life of the plate.
• the recovery zone can be found after the perforations where a film continues to protect the wall. Mayle and Camarata[1975] showed that high blowing ratios led to longer films with a larger homogeneous zones near the walls.
The film cooling is often defined by its thickness. This height of the film is either defined by the distance from the wall where the coolant concentration is equal to zero or where the mean velocity profile not disturbed. Experi-mentally, steam is often used to visualize the film cooling evolution as shown in Fig1.10.
Figure 1.10: Visualisation of the film cooling using steam. Rouvreau [2001]
Several studies relate the fact that the film thickness possess a unique scal-ing with the product of the blowscal-ing ratio M and the diameter D.Miron et al.
[2005] proposed a correlation based on experimental observations, Eq 1.16. y
M D = Cm( x M D)
Ck (1.16)
is small compared to unity.
Bi = h Lref λp
(1.17)
with h the heat transfer coefficient between the plate and the fluid, Lref a
characteristic length (Lref = e here) and λp the thermal conductivity of the
plate. According to the work of Kasagi et al. [1981], Harrison and Bogard
[2008], the Biot number in helicopter engines is about 10−3
. Only a difference of several degrees across the plate is generally observed. The importance of the tangential conduction has been discussed by Lefebvre [1999].
Radiative fluxes are important due to the high temperature of the burnt gases, near 2000K. They are often modeled using Eq 1.18 with ǫω the
emis-sivity of the wall, Eω the irradiation of the wall and σ the Planck constant.
Qray = ǫωEω− ǫωσTwall4 (1.18)
The convective fluxes are complex to evaluate because the jets modify the structure of the boundary layer on both sides of the plates and the recirculation zones in the hole.
The general form of the convective flux is given by:
q = h(Twall− Tref) (1.19)
with h the heat transfer coefficient, Twall the wall temperature and Tref a
characteristic temperature. In the boundary layer, Tref is defined as the
temperature far from the wall and the heat transfer coefficient is not con-stant in the tangential direction, according to the work of Taine and Petit
[1995].
The difficulties to estimate the convective fluxes depend on the region con-sidered :
• the secondary flow: in the plenum, the cold flow exchanges heat with the plate. The reference temperature is the flow temperature but the heat transfer coefficient is not known.
• the perforation: the flow is not fully developed, preventing the use of correlations based on this assumption. The reference temperature is still the secondary flow temperature but the heating of the fluid by the plate through the perforation has to be estimated to evaluate the heat transfer coefficient.
• the main flow: the reference temperature corresponds to a mixture temperature which depends on the distance from the wall for a given
The reference length depends on the part of the flow: the diameter in the perforation and the hydraulic diameter in the main and secondary flows. Another length is defined byDorignac et al. [2005] corresponding to the pe-riodic surface around each hole which is then divided by the lateral distance between two consecutives holes ∆z. This definition is based on the fact that thermal transfers depend on ∆z.
An alternative to express the dimensionless heat transfer coefficient is the Stanton number, Eq 1.22, which compares the diffusive fluxes and the con-vective fluxes.
St = h
ρCpU (1.22)
Contrarily to the Nusselt, the Stanton number is well adapted for complex geometries because it is not based on a reference length.
In the main flow
Upstream of the perforated plate, hot gases near the wall have a much higher temperature than the plate and heat it. The coolant introduced from the perforations either stays near the wall or penetrates in the main flow with a possible reattachment downstream depending on the geometry and the blowing ratio. Still, the film is hotter than the plate. Lowering the plate temperature actually requires an amount of rows even more important. In the main flow, the goal is rather reducing the burnt gases temperature near the wall than cooling the plate.
Ammari et al.[1990] worked on the correlation of the blowing ratio and the
cooling effectiveness for normal perforations and it appears that the density ratio RD = ρρhotjet has no influence on the heat transfer at the wall in that
configuration. Nevertheless, a strong influence of this parameter is observed for angled perforation (α = 35o inAmmari et al. [1990]): higher heat
trans-fers are obtained for low density ratios. Several correlations estimate the heat transfer coefficient on the injection side however the complexity of the hole-to-hole interactions are not well predicted as discussed previously in Section1.1.3.
In the perforation
Nguyen and Dorignac [2008] studied thermal transfers occuring in a normal
oriented perforation with a ratio L/D equal to 8. Three distincts zones are observed based on the Nusselt variation and presented Fig 1.13. Zone A, where the separation occurs, represents the entrance of the perforation with
the stagnation point, the separation and the recirculation zone. The con-vective thermal transfers drop importantly before increasing to a maximum value. The reattachment then occurs in zone B with a decrease in the Nusselt number. The steady state is reached in zone C with y/d > 5.
y" x" y/D" Nu (y) "
Figure 1.13: Evolution of the Nusselt number along the dimensionless perfo-ration length L/D for various Reynolds Nguyen and Dorignac [2008]
The different curves displayed in Fig1.13are obtained for Reynolds going from 3000 to 35 000. It underlines the influence of the Reynolds number on the thermal effects in the perforation, the Nusselt number increasing with the Reynolds number. This behavior was also reported by Cho and Goldstein
[1995].
The numbers of rows have no influence on the flow and the heat fluxes in the perforation. The local heat fluxes are independent of the parameter L/D as showed in the work of Dorignac et al. [2005].A correlation based on the Reynolds number and the height of the perforation for normal perforations is proposed. Andrews et al. [1988a] reviewed several correlations based on the Reynolds number and the ratio L/D to estimate a global Nusselt number. The correlation proposed by Le Griv`es et al. [1979] was determined for tur-bulent flow with a L/D bounded by : 3 < L/D < 6 and ∆x/D = 10 :
N u = 0.51 1 + 4.3 10−2(L
D)
Re0.6D P r (1.23) The correlation proposed by Latko [1944] is given Eq 1.24.
Nu = 0.02775ReD0.8( Re0.2 D (L D)0.8 )0.275 (1.24)
Modified Colburn relation for turbulent smooth pipes as a function of the Reynolds and the distance from the entrance y/D reads :
For y/D < 0.325: N u = 0.046Re0.8D P r0.33 (1.25) For y/D > 0.325: N u = 0.023Re0.8
D P r0.33[1 + 1.35( y D 1.8 (1 + 0.8ln(y D)] (1.26)
In the secondary flow
According toByerley et al. [1988], the presence of the perforations increases the shear stress and thus the heat fluxes around them. The increase can be seen downstream of each perforation, as illustrated in Fig 1.14. Indeed the low velocity flow upstream is sucked into the perforation, resulting in a acceleration towards the wall and a rise of the temperature gradients and velocities leading to higher heat fluxes. It has been observed that in the vicinity of the holes the heat transfer coefficient can be multiplied by up to 6 compared to a flat plate without perforations. An increase of the heat fluxes is also noted upstream of the holes due to the reduction of the boundary layer thickness.
Higher heat fluxes are strongly related to the ratio of the jet velocity to the velocity of the cold flow : Sr = Vj/Vcold. The higher this ratio the higher the
fluxes downstream of the perforation. An increase of the velocity ratio also widens the surface impacted downstream because the stagnation point drifts away downstream creating a recirculation zone.
In the case where there is no suction, the heat transfer coefficient can be estimated using the correlation of Colburn for the flat plate, Eq 1.27. The boundary layer is perturbed in the vicinity of the holes leading to higher heat transfer coefficients. The use of the Colburn relation is known to underesti-mate the heat fluxes for a multi perforated plate.
N ucol = 0.023Re0.8P r0.33 (1.27)
Sparrow and Ortiz [1982] and Dorignac et al. [2005] studied the heat fluxes
when all the secondary flow goes through the perforation. An area around the perforation where the heat transfer coefficient is more important is observed but its shape is not comparable to the results found in the presence of a grazing flow. This observation highlights the importance of the suction on the heat fluxes on the cold side. These two works propose correlations based on the Nusselt number to estimate the heat transfer coefficient.
Sparrow and Ortiz[1982] proposed a relation based on the Reynolds and the
Prandtl number :
Figure 1.14: Spatial change of the heat transfer coefficient in the vicinity of the hole Byerley et al. [1988]
The one proposed by Dorignac et al. [2005] is also based on the Reynolds number and the geometric properties of the plate :
N u = 1.202(√∆x A) 1.879(∆x D ) 0.163Re0.409 h (1.29) with A = Sh−πD 2 4 and Sh = 3/2(∆x)2tan( π
6) is the periodic surface around
the hole in the experiment.
1.4
Modeling of a multiperforated plate
1.4.1
Homogeneous description of the dynamics
The creation of homogeneous models to represent the mass flux and the momentums on the two plate sides is motivated by the use of coarse meshes near the walls in complex geometries. The fluxes are averaged over the surface (Φmodel) of the multi perforated plate without distinction of the wall (Φw)
injection side, this yields : Vsuc n = σVjetsuc= ˙ m s2ρsucσ (1.30)
Vninj = σVjetinj = m˙ s1ρinjσ
(1.31)
The tangential velocity of the jet Vt is defined by the normal velocity and
the penetration angle α :
Vtsuc= Vnsuc tanα (1.32)
Vtinj = Vninj tanα (1.33)
To conserve the tangential momentum, it is shown in Mendez and Nicoud
[2008b] that the modified angle tan(α′
) = tan(α)σ must be used to define the proper homogeneous tangential velocity. The streamwise and normal momentum are imposed with a flux condition at the boundary condition. The homogeneous approach has been developed based on a LES calculation where the jet velocity and the main flow are aligned. There is no guarantee that it behaves accordingly for perforations with an angle of deviation, β, different to 0, as shown in the work of Michel et al.[2009].
1.4.2
A homogeneous modelisation of the heat fluxes
A homogeneous thermal model was proposed by Cottin [2013] based on a heat transfer coefficient and a reference temperature. Coupled Reynolds Averaged Navier Stokes (RANS) simulations were performed and compared to empirical correlations for the hot and cold sides and within the perforation. For each part of the plate, the heat transfer coefficient was estimated as follows:
hk=
Φk
(Twall,k− Tad,k)
(1.34)
where the subscript k represents a part of the plate and the operator - rep-resents spatially averaged quantities over a periodic profile around the hole.
In the main flow
Cottin [2013] used a blowing ratio from 3.25 to 8.5 and observed few
dif-ferences for the heat transfer coefficient as well. Ammari et al. [1990] also showed that for high blowing ratios, the contributions of the density ratio Rρ
and the velocity ratio RV = VVhotjet are different. In the homogeneous model,
For the hot side of the plate, a Stanton number (St) relation is used, Eq1.35, to avoid the definition of a reference length.
St,hot = C1(RV)C2× (Rρ)C3 (1.35)
The three constants C1, C2and C3are determined from the numerical results.
The heat transfer coefficient can then be determined from Eq 1.22 using Eq 1.36.
hhot = ρhotCp,hotUhotSt,hot (1.36)
The numerical heat transfer coefficient hhot,mod to impose is then estimated
by Eq1.37.
hhot,modSplate= hhots1
where s1 = Splate - s1 represent the solid liner surface at the injection side.
hhot,mod = hhot(1 − σ) (1.37)
In the perforation
Cottin [2013] found that the correlation proposed by Latko [1944] gives the
best prediction. Nevertheless a difference is observed and a correction was applied with the dependance of the term ( 1
(DL)0.8) 0.275 conserved, Eq 1.38. Nu,hole = 0.02775 × Re0.8D ( Re0.17 D (DL)0.8) 0.275 (1.38)
The heat transfer coefficient is then given from Eq 1.38 and the diameter of the perforation D, Eq 1.39.
hhole =
Nu,holeλjet
D (1.39)
The heat transfer coefficient estimated shows good agreement with the sim-ulations after the fourth row.
The enthalpy flux through a perforation is defined by Eq 1.40 consid-ering a perforation whose normal is oriented along ~y. The enthalpy flux is conserved in all the perforations through homogeneous suction and injection.
Z s1
s2
As in the model of Mendez and Nicoud [2008a], the porosity of the plate σ is introduced to account for the difference between the computed and the effective surface and so to respect the mass flow rate conservation. Eq 1.40
then yields : Z
Splate
(ρ σ(y)VnH)dxdy (1.41)
In the secondary flow
The secondary flow mean transfer coefficient is obtained from Eq 1.34 by averaging the heat transfer coefficient, the adiabatic and wall temperatures on the surface exchange surface. In his work, Byerley et al. [1988] observed that the velocity ratio is correlated with the heat transfer coefficient. Cottin
[2013] proposed a modified Nusselt number to account for this effect based on the Colburn correlation:
Nu,cold = Nu,colburn(1 + C4SR)C5 (1.42)
This expression degenerates to the flat plate correlation when there is no aspiration (SR= 0) and estimates a higher Nusselt number when the suction
increases.
The two constants C4 and C5 are determined to fit the numerical results
obtained in the coupled calculations. The heat transfer coefficient reads as:
hcold =
N ucoldλcold
(∆x∆z D )
(1.43)
On the cold side of the plate, both the heat fluxes from the secondary flow and the perforation flow are modeled. The heat transfer in the perforation is defined using an internal porosity Σ that reads :
Σ = Sint Splate
(1.44)
with Sint the exchange surface within the aperture.
The modeled flux on the cold side is obtained with Eq 1.45.
hcold,plate = hcold(1 − σ) + hjetΣ (1.45)
Definition of the reference temperature.
Once the heat transfer coefficient is estimated, the heat flux given by Eq1.19
adiabatic temperature, not known in the calculation. A mesh dependance was hold with respect to the y+, Eq 1.46.
y+ = uτy
ν (1.46)
with uτ the friction velocity at the wall, y the distance from the wall and
ν the viscosity at the wall. Cottin [2013] observed an agreement for the reference temperature Tadiab with the results of the coupled calculations for
y+ not too small, especially for the injection side as illustrated figure 1.16.
Figure 1.16: Influence of the size cell near the wall on the temperature ex-change. Left: in the injection side, right: in the suction side (Cottin [2013])
The weakness of the implementation is the adiabatic temperature esti-mated at the first cell/node. The adiabatic temperature results from the mixing mechanisms above the plate while in the homogeneous approach the first cell/node temperature can be equal to the coolant temperature due to the little mixing. As a result, the reference temperature is understimated which leads to an underestimation of the exchanged heat flux.
1.4.3
Heterogeneous modelisation
The heterogeneous approach has been developed to improve the mixing pre-diction while not meshing the effusion holes. This approach is in between the homogenous model, where no distinction between the wall and the hole is made, and a resolved calculation, where all the geometry is finely meshed and the mixing mechanisms calculated.
Rida et al. [2012] proposed to define, for each orifice, a coupled mass flow outlet on the cold side and a coupled mass flow inlet on the injection side. The mass source term is a function of the discharge coefficient CD. Good
results are obtained on industrial configurations, asserting the potential of the heterogeneous approach, in terms of velocity or temperature prediction compared to meshed (unresolved) perforation calculations. Andreini et al.
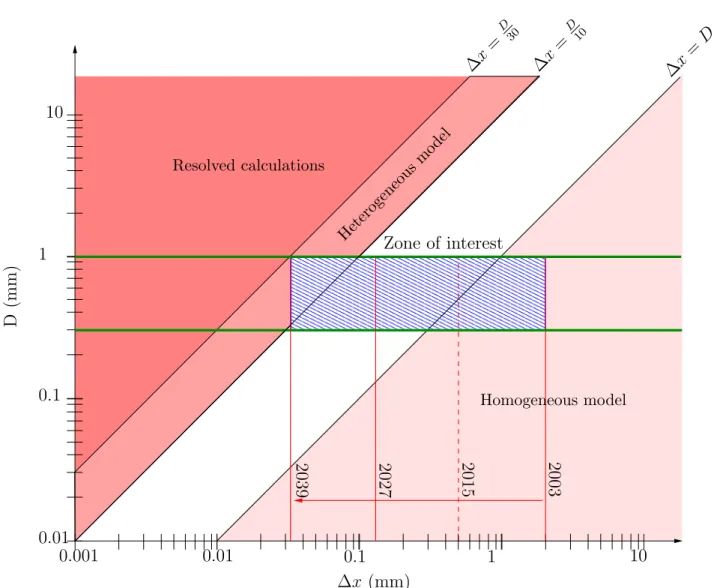
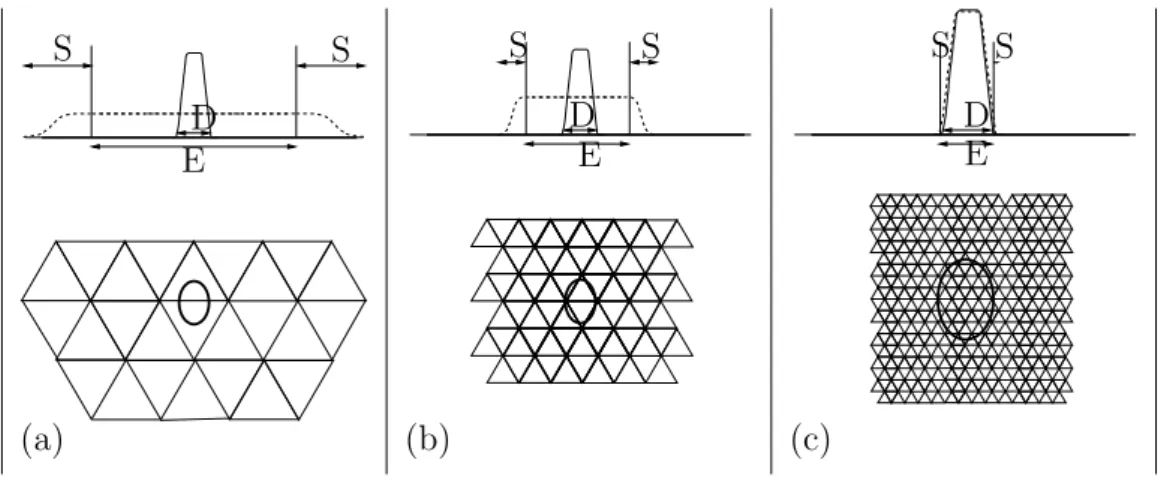
[2013] proposed a similar approach with a mass source-sink pair and a heat sink to take into acount the cooling within the aperture. The location and area of effect of these terms depend of the mesh resolution. This approach requires a certain mesh refinement to resolve the gradient close to the walls and the turbulent mechanisms. The best agreement with experimental data is obtained with a cell size of about 50% of the hole diameter. Similar con-clusions are drawn for volumetric formulationsHeidmann and Hunter[2001].
1.4.4
Resolved and meshed perforations
In the resolved calculation approach, the full plate geometry is represented. This approach requires very fine mesh to properly solve the gradients at the wall, which requires y+ less than 7, with low dissipation schemes and
subgrid models for LES with a correct asymptotic viscosity damping close to the wall Nicoud and Ducros[1999],Vreman [2004],Nicoud et al.[2011]. The very small volume cells and the number of elements imply heavy computation costs.
Meshed perforation calculations refer here to calculations where the per-forations are discretised but not fully resolved (less than 15 cells in the di-ameter). The dimensionless wall distance can be kept relatively small with a layer of small cells at the wall in RANS calculations since the numerics are more robust than LES and low Reynolds approaches are possible. In both cases, the mesh resolution can not reproduce the jet aerothermal behavior
Jouhaud et al., Camarri et al. [2006].
1.4.5
Wall law approaches
Cottin [2013] compared coupled RANS calculations with typical law of the
wall formulations to estimate the velocity and temperature profiles for the injection side and suction side. The coefficients used in the laws vary depend-ing on the case investigated and the side of the plate. They are dependent on the flow conditions namely the blowing ratio (respectively the suction ratio), the density ratio and geometric plate parameters. From these results,Callejo
based on coupled RANS calculations for various geometric and aerodynamics parameters: the momentum ratios J in the study range between 0.2 and 13.4 while it varies between 27 and 88 for combustors. The modified relations for the reduced velocity and the reduced temperature reads :
U+ = 1 κ + Bi ln(y+) + C1 (1.47) T+ = P rt κ + Di + C2 (1.48)
where κ, C1and C2 are the common constants of the wall laws and Bi, Di are
constants depending on the flow conditions and the porosity. At the injection side, Bi and Di are estimated with the blowing ratio and the density ratio
while at the suction side they are calculated with the suction ratio and the density ratio. The coefficients are determined with a multivariable regression on these three parameters with the 9 studied cases. More details are given in the corresponding article.
Wall laws are based on the wall shear stress τw to estimate the reduced
quantities. If the multiperforations are modeled, an additional modeling of τw is mandatory within the aerodynamics model. The usual wall laws are
derived from the streamwise momentum equation, simplified with two asump-tions for typical flat plane configuration. The first hypothesis concerns the streamwise changes which are supposed negligible compared to the changes in the normal direction. The second hypothesis considers that the boundary layer is dominated by diffusive fluxes. When wall laws have been proposed to model the aerothermal behavior of the flow around multi-perforated plates, these two asumptions have not been verified. For multiperforated plates, the first hypothesis is true, especially for straight perforations and high momen-tum ratios J leading to small streamwise components. The second hypothesis however is not as evident. Mendez and Nicoud[2008a] performed a resolved LES periodic calculation of a single hole to investigate the flow in a steady established state. According to the momentum balance analysis, the major contribution comes from the convective fluxes,up to 90%, compared to the diffusive fluxes, 10%. Thus, the second hypothesis is not verified for the mo-mentum.
1.5
Related studies
Table 1.3 gathers dynamics and geometrical parameters as well as the type of variable investigated for related studies. Single or few rows studiesRenze
et al. [2007], Bodart et al. [2013], Kalghatgi and Acharya [2014], Johnson
et al. [2013], Andreini et al. [2014], Jessen et al. [2012] are not included in
Table 1.3 since the film cooling come from the coalescence of several rows.
Experimental setup
Reference M/J Rows D α Regions Data
Emidio[1998] 1-3/7-12 9-35 5 60 Inj T, η
Rouvreau[2001] 0.8-4/0.3-18 21 5 60 Inj V~, T, η
Miron et al.[2004] 3.6/13 12 5 30 Inj V~
Michel et al.[2007] 8.8/77.4 9 5 60 Inj V~
Scrittore et al.[2007] 3.2-5/12-27 30 6 60 Inj V~, ηadiab
Zhong and Brown[2009] 0.4/0.1 12 0.3 90 All V~, T, η, ηadiab
Picchi[2014] 0.5-5/0.2-17 22 2 90,30 Inj Tadiab, ηadiab
Numerical setup
Reference M/J Rows D α Regions Data
Most[2007] 1.3-2.3/1.8-4.6 12 5 60 Inj V~
Harrington et al.[2001] 0.4/0.8 10 6 90 Inj Tadiab, ~V, ηadiab
Errera and Chemin[2004] 1.2/0.5 12 0.3 45 All T
Mendez and Nicoud[2008a] 1.5/2.25 ∞ 5 30 All V~
Zhong and Brown[2007] 0.4/0.1 12 0.3 90 All T, η, ηadiab
Cottin [2013] 3.2-8.5/3.1-21.7 15 0.5 30 All T, η
Florenciano [2013] 8.4/31 12 0.4 28 All T
Table 1.3: Review of the experimental and numerical multi-perforated plate setup. The diameters D are expressed in millimeters. The region ’Inj’ refers to the injection side of the plate. The velocity ~V and temperature fields when available are indicated. The subscript ’adiab’ refers to adiabatic values.
In this set of experiments, the blowing and momentum ratio investigated in the literature do not correspond to the ones found in helicopter engines, around 8 to 18 and 27 to 88 respectively. Regarding geometrical parameters, mostly deal with purely streamwise angled perforations and a flat plate,
Michel et al.[2007] being the only exception. Test rigs are designed according
to the Reynolds analogy with a scaling factor of the geometric dimensions up to 15 due to the small size of the perforations compared to the probe size. The ratio of the perforation length to the diameter and the plate porosity are generally respected Andrews et al. [1988a,b], Byerley et al. [1988], Peterson
and Plesniak [2007].
Numerical studies are usually based on Reynolds-Averaged-Navier-Stokes (RANS) simulations. To properly account for the jet interaction with the injection flow, specific turbulent models must be considered Bergeles et al.