RESEARCH OUTPUTS / RÉSULTATS DE RECHERCHE
Author(s) - Auteur(s) :
Publication date - Date de publication :
Permanent link - Permalien :
Rights / License - Licence de droit d’auteur :
Bibliothèque Universitaire Moretus Plantin
Institutional Repository - Research Portal
Dépôt Institutionnel - Portail de la Recherche
researchportal.unamur.be
University of NamurHyaluronan metabolism in human keratinocytes and atopic dermatitis skin is driven by a balance of hyaluronan synthases 1 and 3
Malaisse, Jérémy; Bourguignon, Virginie; De Vuyst, Evelyne; de Rouvroit, Catherine Lambert; Nikkels, Arjen F; Flamion, Bruno; Poumay, Yves
Published in:
The journal of investigative dermatology DOI:
10.1038/jid.2014.147
Publication date: 2014
Document Version
Early version, also known as pre-print
Link to publication
Citation for pulished version (HARVARD):
Malaisse, J, Bourguignon, V, De Vuyst, E, de Rouvroit, CL, Nikkels, AF, Flamion, B & Poumay, Y 2014,
'Hyaluronan metabolism in human keratinocytes and atopic dermatitis skin is driven by a balance of hyaluronan synthases 1 and 3', The journal of investigative dermatology, vol. 134, no. 8, pp. 2174-2182.
https://doi.org/10.1038/jid.2014.147
General rights
Copyright and moral rights for the publications made accessible in the public portal are retained by the authors and/or other copyright owners and it is a condition of accessing publications that users recognise and abide by the legal requirements associated with these rights. • Users may download and print one copy of any publication from the public portal for the purpose of private study or research. • You may not further distribute the material or use it for any profit-making activity or commercial gain
• You may freely distribute the URL identifying the publication in the public portal ?
Take down policy
If you believe that this document breaches copyright please contact us providing details, and we will remove access to the work immediately and investigate your claim.
Hyaluronan metabolism in human keratinocytes and atopic
dermatitis skin is driven by a balance of hyaluronan synthases
1 and 3
Jérémy Malaisse1 , Virginie Bourguignon1, Evelyne De Vuyst1 , Catherine Lambert de
Rouvroit1, Arjen F. Nikkels2 , Bruno Flamion1 and Yves Poumay1
1 Research Unit of Molecular Physiology (URPHYM), NARILIS, University of Namur,
Namur, Belgium
2Department of Dermatology, University Medical Center of Liège, Liège, Belgium
Correspondence : Yves Poumay, Research Unit of Molecular Physiology (URPHYM), NARILIS, University of Namur, 61 rue de Bruxelles, B5000 Namur, Belgium
Email : [email protected] Tel : +3281724257
Abbreviations : AD, atopic dermatitis ; HA, hyaluronan ; HAS, hyaluronan synthase ; HB-EGF, heparin-binding EGF-like growth factor ; IVL, involucrin ; KRT10, keratin 10; RA, all-trans retinoic acid ; RHE, reconstructed human epidermis.
ABSTRACT
Hyaluronan (HA) is a glycosaminoglycan synthesized directly into the extracellular matrix by three hyaluronan synthases (HAS1, HAS2, and HAS3). HA is abundantly synthesized by keratinocytes but its epidermal functions remain unclear. We used culture models to grow human keratinocytes as autocrine monolayers or as reconstructed human epidermis (RHE) to assess HA synthesis and HAS expression levels during the course of keratinocyte differentiation. In both models, epidermal differentiation downregulates HAS3 mRNA expression while increasing HAS1 without significant changes in hyaluronidase expression. HA production correlates with HAS1 mRNA expression level during normal differentiation. To investigate the regulation of HAS gene expression during inflammatory conditions linked to perturbed differentiation, lesional and non-lesional skin biopsies of atopic dermatitis (AD) patients were analyzed. HAS3 mRNA expression level increases in AD lesions compared to healthy and non-lesional skin. Simultaneously, HAS1 expression decreases. Heparin-binding EGF-like growth factor (HB-EGF) is upregulated in AD epidermis. An AD-like HAS expression pattern is observed in RHE incubated with HB-EGF. These results indicate that HAS1 is the main enzyme responsible for HA production by normal keratinocytes and thus, must be considered as an actor of normal keratinocyte differentiation. In contrast, HAS3 can be induced by HB-EGF and seems mainly involved in AD epidermis.
INTRODUCTION
Hyaluronan (HA) is an essential extracellular polysaccharide. Its abundance in dermis and epidermis contrasts with the lack of understanding of its functions in skin. HA is composed of alternating glucuronic acid and N-acetylglucosamine residues repeated several thousands of times to form a linear non-sulfated glycosaminoglycan (Toole, 2004). HA is produced at the inner cell membrane and directly exported to the extracellular space by three enzymes called hyaluronan synthases (HAS) 1, 2 and 3 (Rilla et al., 2005). The three HASs differ by their temporal expression during development, their specific activity, and the size of the respective HA polymers they produce (Itano et al., 1999). HAS2 appears to play a key role during development since deletion of its gene in mice is lethal at mid-gestation, due to multiple cardiovascular malformations (Camenisch et al., 2000). On the other hand, HAS1 and HAS3 null mice are viable (Bai et al., 2005; Kobayashi et al., 2010) as well as double-knockout mice lacking HAS1 and HAS3 (Mack et al., 2011). Enzymatic catabolism of HA is performed by hyaluronidases, mainly HYAL1 and HYAL2 (Toole, 2004). The skin contains 50% of the total body HA (Meyer and Stern, 1994). Labelling using a biotinylated HA-binding protein shows that HA is abundant in the dermis and to a lesser extent in the epidermis. In the latter, HA is mainly localised around the cells of basal and spinous layers (Tuhkanen et al., 1998). Involvement of HA and HASs in proliferation, differentiation, and migration of keratinocytes, as well as in the establishment of the epidermal barrier, has been reported (Maytin et al., 2004; Passi et al., 2004; Rilla et al., 2004; Bourguignon et al., 2006; Farwick et al., 2011). Yet the mechanisms of HA involvement in normal epidermis are not well identified or understood. Increased HA synthesis has been implicated in skin inflammation. An increase in HA staining parallel to an increase in HAS3 mRNA expression are observed in acute eczema (Ohtani et al., 2009). HAS2 and HAS3 in keratinocytes can be upregulated by pro-inflammatory cytokines
such as IL4, IL13, and IFN-γ (Sayo et al., 2002), by growth factors such as EGF or KGF (Karvinen et al., 2003; Pasonen-Seppanen et al., 2003), or by retinoic acid (Saavalainen et al., 2005; Pasonen-Seppanen et al., 2008). However, the specific regulation of HAS genes during spontaneous proliferation and differentiation of keratinocytes or during the establishment of the epidermal barrier has not yet been characterized.
Here, we have investigated HA synthesis in normal human keratinocytes using two culture models of epidermal differentiation induced by cell density, i.e. confluent keratinocyte monolayers and reconstructed human epidermis (RHE), both cultured without addition of molecules influencing the differentiation processes (Minner et al., 2010; Frankart et al., 2012), as well as in lesional and non-lesional skin from atopic dermatitis (AD) patients. Our data strikingly suggest that the balance of HA produced by distinct HASs is differentially involved in the regulation of keratinocyte physiology and pathophysiology: HAS1 is responsible for the bulk of HA production in normal keratinocytes, whereas HAS3 is prominent in pathological conditions. These observations pave the way to targeted HA modulation therapies.
RESULTS
Production of HA by human keratinocytes correlates with expression levels of HAS1 during differentiation and dedifferentiation
Autocrine cultures of human keratinocytes undergo differentiation as cells become confluent (Minner et al., 2010). HA concentration was measured in the culture medium, the pericellular zone, and the intracellular compartment of human keratinocyte monolayers before and after confluence. HA accumulates in the medium and around the cells mainly after culture confluence (figure 1a and 1b). The amount of intracellular HA (figure 1c) is variable while extracellular HA increases progressively and markedly with differentiation (figure 1a-b and figure 1e). One
may surmise that pericellular HA continuously diffuses into the culture medium. This pattern of HA production suggests an active role concomitant with differentiation of keratinocytes. Because HA’s functions are size-dependent, we analyzed the molecular weight of newly synthesized HA released into the medium at different culture steps (supplementary figure 1a). Various sizes of HA were detected in each condition with a peak around ~2,000 kDa. There were no significant changes in HA molecular size during differentiation.
To determine if one particular HAS is specifically involved in the enhanced production of HA by differentiating keratinocytes, the mRNA expression levels of HAS1, HAS2 and HAS3 were determined by quantitative PCR. The relative expression level of HAS1 mRNA increases 5-fold at confluence and between 5 and 10-5-fold after confluence (figure 1d). In contrast, the relative expression levels of HAS2 and HAS3 mRNA decrease significantly as soon as cultures become confluent and express differentiation markers (figure 1e). We also measured the mRNA expression of HYAL1 and HYAL2 during the same timeframe (supplementary figure 2a and 2b). Both are stable, suggesting that upregulation of HAS1 is the main driver of HA accumulation during differentiation.
To probe the potential link between keratinocyte differentiation and expressions of specific HASs, confluent cultures were incubated for 18 h with various concentrations of all-trans retinoic acid (RA), a well-known inducer of epidermal dedifferentiation (Poumay et al., 1999; Giltaire et al., 2009). This treatment strongly downregulates keratin 10 (KRT10) and upregulates involucrin (IVL) (figure 1g). Simultaneously, the mRNA levels of HAS2 and HAS3 dose-dependently increase while those of HAS1 decrease >10-fold. The effect of RA on HAS2 and HAS3 expressions has been previously described (Kaya et al., 2005; Saavalainen et al., 2005); our experiments highlight downregulation of HAS1 expression concomitantly with KRT10 disappearance (figure 1f).
The role of the EGF receptor (EGFR) in the correlation between HAS expression and keratinocyte differentiation was then evaluated. EGFR, especially when phosphorylated (pEGFR), is known to regulate the expression of numerous genes involved in differentiation (Tran et al., 2012). The abundance of EGFR and pEGFR was assessed on Western blots before and after confluence of keratinocyte cultures. Both forms of EGFR are detected at progressively lower levels as keratinocytes differentiate and express higher amounts of KRT10 (supplementary figure 3a). To test whether EGFR also controls the balance of HAS expression, subconfluent (C-2d) keratinocytes were treated with the EGFR-neutralizing antibody LA1 for 48 h. LA1 blocks EGFR phosphorylation (supplementary figure 3b) while increasing HAS1 expression 10-fold and decreasing HAS3 expression 10-fold (supplementary figure 3c). In summary, the HAS1/HAS3 expression ratio robustly correlates with keratinocyte differentiation state during both spontaneous differentiation and pharmacological treatments; EGFR may be involved in that switch.
Depletion of HA synthesis does not modify the expression profile of keratinocyte differentiation markers
Based on the preceding observations, HA may play a role in keratinocyte differentiation. To test this, keratinocyte monolayers were treated with either 4-methylumbelliferone (4MU), a widespread inhibitor of HA synthesis, or Streptomyces hyaluronidase, which degrades HA into small fragments. 4MU was previously shown to decrease rat keratinocyte proliferation at concentrations of 0.2–1.0 mM (Rilla et al., 2004). Using concentration-response experiments, we show that 0.5 mM 4MU is both effective (>75% decrease in HA release) and relatively non-toxic (<25% cell mortality if treatment is started at C-2d) in cultured human keratinocytes (supplementary figure 4a and 4b). Hyaluronidase treatment removes all HA (supplementary
figure 4c). However, exposure of cultures to either 0.5 mM 4MU or 1 U/ml Streptomyces hyaluronidase during 48 h did not modify the expression profile of KRT10, IVL or FLG over the course of keratinocyte differentiation (figure 2).
We conclude that HA synthesis is not involved in the differentiation process of human keratinocytes.
Production of HA during the reconstruction of human epidermis also correlates with HAS1 expression
The RHE with its air-liquid interface is a more physiological model of the epidermis that can be studied without influence of the dermis (Frankart et al., 2012). The amount of HA released in the RHE medium increases progressively during reconstruction (figure 3a). The HA amount in the tissue is about 100-fold the amount measured in the medium and increases in a similar way during reconstruction (figure 3b). After 11 days, there is twice as much HA as there are proteins (2 µg HA per µg of total cell protein). Fluorescent detection of HA in RHE sections shows a faint labelling after 1, 3, and 5 days and a dramatic increase after 7, 9, and 11 days of growth as the tissue stratifies and accumulates KRT10 and IVL suprabasally (figure 3c). HA labelling surrounds all keratinocytes throughout the epithelium. This pattern mimics the location of HA in normal epidermis in vivo (see figure 5).
The mRNA expression levels of HASs and hyaluronidases were also measured in RHE using quantitative PCR. HAS2 is scarcely expressed in RHE, becoming detectable after 40 cycles of PCR only (data not shown). The level of HAS1 mRNA expression is stable over the duration of the culture (figure 4). In contrast, HAS3 expression progressively decreases from the third day on, as soon as RHE expresses differentiation markers. A similar expression pattern is observed for HYAL1 and HYAL2 (supplementary figure 2c and 2d).
The size of HA released by RHE at various time points was analyzed using chromatography, revealing a broad profile of molecular sizes (supplementary figure 1b) similar to that of the monolayers (supplementary figure 1a). This profile does not change significantly during RHE differentiation.
Detectable HA is strongly increased in lesional epidermis of atopic dermatitis patients and correlates with downregulation of HAS1 and upregulation of HAS3
Previous studies have shown a link between HA and inflammatory skin diseases (Jameson et al., 2005; Ohtani et al., 2009; Barnes et al., 2012). HA distribution and HAS expression levels were investigated in biopsies of atopic dermatitis (AD) patients and compared with in vitro data. Skin biopsy specimens from an acute lesion and from surrounding normal appearing (non-lesional) skin of AD patients as well as specimens from healthy volunteers were collected after informed consent. As expected, morphologies of the non-lesional and healthy skins (figure 5a and 5b) appear identical. HA staining in the normal epidermis is finely localised around the cells of the basal and spinous layers (figure 5d and e). AD lesional skin sections, on the other hand, display distinctive epidermal hyperplasia and parakeratosis (figure 5c) (Oyoshi et al., 2009). Yet, HA staining is as intense as in normal skin sections and is localised in all intercellular spaces of lesional epidermis (figure 5f).
The dermis was partially visible on the sections. As often demonstrated previously (Wells et al., 1991), it is filled with compact HA staining (figure 5d and 5e) except in AD lesions where dermal HA staining is strikingly reduced (figure 5f).
The mRNA expression level of HAS was measured using quantitative PCR in similar 2-mm deep punch biopsies of 11 healthy skins, 9 non lesional skins, and 9 lesional skins of AD patients. The mean expression of HAS1 mRNA in the whole skin (mostly epidermis) is
decreased by 50% in both non-lesional and lesional skin of AD patients compared with healthy skin (figure 5g). On the other hand, the relative expression level of HAS3 mRNA is similar in healthy and non-lesional skin but increases approximately 10-fold in AD lesions. The relative expression level of HAS2 mRNA does not differ significantly between samples. In view of their stable expression in skin models (see supplementary figure 2), hyaluronidases were not evaluated in the biopsies.
Upregulation of HB-EGF can drive differential HAS expression in AD skin
Several studies have shown that growth factors influence HAS expression in keratinocytes (Sayo et al., 2002; Karvinen et al., 2003; Pasonen-Seppanen et al., 2003) and we have just shown that the HAS1/HAS3 ratio increases 100-fold in response to anti-EGFR treatment (see supplementary figure 3c). Immunohistochemical HB-EGF labelling of the biopsy specimens in the current study shows very little signal in healthy skin but a strong marking in both lesional and non-lesional AD epidermis (figure 6). This is in line with the results obtained in our previous study (Mathay et al., 2011). To determine if HB-EGF can induce differential HAS expression in the epidermis, we measured the mRNA levels of HAS1, HAS2 and HAS3 in RHE treated for 10 days with recombinant human HB-EGF at concentrations ranging from 0 to 25 ng.mL-1. HAS2 mRNA is scarcely expressed even after HB-EGF exposure (data not shown)
but HAS3 mRNA expression is dose-dependently elevated upon incubation with HB-EGF (figure 6g). Conversely, HAS1 expression decreases at high concentrations of the EGFR ligand (figure 6g).
Our data thus confirm that epidermal HB-EGF is induced in AD patients and that it can modulate the expression of HAS1 and HAS3 in the RHE model with the same pattern as in AD itself.
DISCUSSION
This study was undertaken to assess the regulation of HA production by HASs during spontaneous differentiation of human epidermal keratinocytes in two models (monolayer cultures and RHE) and in AD skin. The models contain no dermis, making epidermal analysis easier but preventing potential paracrine effects from the dermis. For instance, EGF signalling is able to influence HA metabolism in fibroblasts (Rock et al., 2012) and KGF may regulate HA metabolism of keratinocytes (Karvinen et al., 2003).
In both culture models, HA was found to accumulate with keratinocyte differentiation in parallel with an increase in HAS1 mRNA expression and a decrease in HAS3. The expression of HAS2 mRNA was very low both in vitro and in vivo, and decreased further during differentiation of the monolayer, suggesting that HAS2 plays a minor role in keratinocyte physiology. Similarly, we could not show any role for hyaluronidases as HYAL1 and HYAL2 expressions were stable in monolayers and decreased during epidermal reconstruction. Furthermore, both the monolayers and RHE contained mostly high molecular weight (>106 Da)
HA even in non-differentiating conditions when HAS1 was weakly expressed. Human epidermal HA is also composed of high molecular weight (>106 Da) HA species (Tammi et al.,
1991).
At first sight, our results may seem discordant with existing knowledge as published data indicate that HAS3 is responsible for HA synthesis in keratinocytes while HAS1 produces HA in fibroblasts (Sayo et al., 2002; Yamada et al., 2004). However, we believe that the results obtained in the current study based on spontaneous differentiation of human keratinocytes induced by cell density are very relevant for skin physiology. In fact, the role of HAS3 in epidermal HA production was previously demonstrated by incubating keratinocytes with
cytokines like TGFβ or IFN-γ (Sayo et al., 2002), growth factors like EGF or KGF (Pienimaki et al., 2001; Karvinen et al., 2003; Pasonen-Seppanen et al., 2003), or RA (Saavalainen et al., 2005; Pasonen-Seppanen et al., 2008). All these factors can interfere with the balance of HASs. In our study we also tested RA and EGFR blockade on keratinocyte monolayers. Anti-EGFR antibodies increased the HAS1/HAS3 expression ratio 100-fold and RA decreased that ratio 100-fold. RA also increased HAS2 expression, thus completely reversing the changes in HAS1, HAS2 and HAS3 expression observed under spontaneous differentiation. Interestingly, RA was also found to increase HB-EGF expression (Giltaire et al., 2009), suggesting that HB-EGF could explain the increase in HAS3 expression as observed in other models (Monslow et al., 2009). In addition, treatment of RHE with HB-EGF decreased the HAS1/HAS3 ratio 50-fold. All these observations allow us to postulate that HAS1 and HAS3 are distinctly regulated in keratinocytes, possibly by the EGFR pathway, and likely function under different circumstances: HAS1 is the most important HA synthesizing enzyme during epidermal differentiation while the role of HAS3 emerges during pathological conditions.
An important result of the current study is the fact that HA, though produced at high levels during differentiation, is not necessary for this process. Indeed, the expression profile of differentiation markers was not modified when HA was depleted using either 4MU or hyaluronidase treatment. Moreover, the HA is deposited mainly in keratinocyte layers in RHE which are IVL negative and KRT10 low at later time points. This might also indicate an independent regulation of keratinocyte differentiation and HA synthesis.
Correspondingly, the double-knockout mice that lack HAS1 and HAS3 do not present a disruption of epidermal differentiation (Mack et al., 2011) although HAS2 could exert a compensatory effect in that case. Our results thus clarify the discrepancy in the literature about the link between HA and keratinocyte differentiation. Some publications report that HA induces differentiation (Bourguignon et al., 2006; Farwick et al., 2011) whereas others demonstrate that
HA inhibits differentiation (Maytin et al., 2004; Passi et al., 2004). Our study suggests HA is not involved in the process of spontaneous epidermal differentiation.
However, HA could become critical in pathological conditions. In particular, AD lesional skin showed a striking upregulation of HAS3 and downregulation of HAS1 with no significant changes in the amount or pattern of HA in the epidermis. We can only speculate on the consequences of an inverted HAS1/HAS3 ratio in AD lesions. There is no hint that this switch could induce changes in the HA molecular size profile, at least based on the measurements of HA molecular weights during spontaneous keratinocyte differentiation. However, recent experiments have shown that HAS3, but not HAS1, can induce HA receptor-independent pericellular coats and shedding of microvesicles (Rilla et al., 2013b; Siiskonen et al., 2014). HAS3 can also function with a lower concentration of intracellular UDP-linked substrates than HAS1 (Rilla et al., 2013a). Any of these elements could be involved in the switch to inflammation-activated keratinocytes.
Our study also highlights the role of EGF ligands in keratinocyte pathophysiology. In particular, HB-EGF was overexpressed in AD skin and the HAS expression pattern in RHE incubated with HB-EGF was identical to the pattern observed in AD lesion, suggesting that HB-EGF could be a critical factor able to modulate HAS expression in AD skin. However, the strong labelling of HB-EGF in non-lesional epidermis of AD patients indicates that HB-EGF likely needs synergy with other molecules such as inflammatory cytokines to regulate HAS expression pattern in AD lesions.
In conclusion, our study indicates that the balance of HA produced by distinct HAS enzymes is critical for regulating keratinocyte physiology. We have shown that HAS1 is involved in the production of HA by keratinocytes during normal differentiation although suppression of HA does not prevent this process. In contrast, HAS3 is likely expressed by keratinocytes in response to stressing or in pathological conditions such as AD while HAS1 is downregulated. HB-EGF
may play a role in HAS3 induction. Future studies are required to elucidate the detailed mechanisms governing the balance between HAS1 and HAS3 epidermal expression during differentiation and in pathological conditions.
MATERIALS AND METHODS Skin biopsies
See supplementary material online
Cell culture and reconstruction of the epidermis
See supplementary material online
Measurements of hyaluronan concentrations
The cell medium was collected to measure extracellular HA; then cells were treated with trypsin to collect pericellular HA; finally they were lysed with 0.1 M Tris-HCl buffer (pH 7.4) containing 10 mM CaCl2 to measure intracellular or intra-tissular HA. The medium and extracts
were incubated overnight with 500 mU/ml Pronase (Sigma-Aldrich, Bornem, Belgium) at 55°C. HA concentration was quantified using Hyaluronan DuoSet kit (R&D systems, Abingdon, UK). Total cell protein concentration was measured using Pierce Protein Assay (ThermoScientific, Illinois, USA).
Total RNA isolation and quantitative PCR
Total RNA was extracted from monolayers using High Pure RNA isolation kit (Roche, Basel, Switzerland) and from RHE using RNeasy kit (Qiagen, Hilden, Germany). cDNA was generated from 1 μg of total RNA using the Super Script II reverse transcriptase kit (Invitrogen, Merelbeke, Belgium). cDNA was amplified using FastStart Universal SYBR Green Master (Roche, Basel, Switzerland) in a 7300 real-time PCR machine (Applied Biosystems, Lennik,
Belgium). Primers (Sigma-Aldrich, Bornem, Belgium) were used at 300 nM. They are listed in Table S1. mRNA levels were normalized to geometric mean of RPL13A and TBP mRNA expression levels (Minner and Poumay, 2009). Data were analyzed using the ∆∆CT quantitative method (Livak and Schmittgen, 2001).
Labelling
RHE or biopsies were fixed in 4% formalin in 70% ethanol–5% glacial acetic acid to improve HA detection (Lin et al., 1997), embedded in paraffin, and sectioned with a microtome. Tissue sections were deparaffinised, rehydrated and rinsed in water. Sections were blocked and permeabilized for 1 h in PBS containing 0.2% bovine serum albumin (PAA Laboratories GmbH, Pasching, Austria) and 0.02% Triton X-100 (Merck, Darmstadt, Germany). For HA labelling, slides were incubated overnight at 4°C with biotinylated hyaluronan-binding complex (generously given by Professor Markku Tammi) diluted 1:50 in the above solution. After washing, all slices were incubated for 1 h in fluorescein streptavidin (Vector laboratories, CA, USA). Nuclei were counterstained with Hoechst 33258 (Molecular Probes Inc., OR, USA). Slices were mounted using Mowiol (Sigma-Aldrich, Steinheim, Germany) for observation on an Olympus AX70 microscope. Immunolabeling of HB-EGF (Mathay et al., 2008), IVL, and KRT10 (Frankart et al., 2012) was performed as described.
Statistical analysis
HA concentration and mRNA expression data were analyzed using one-way ANOVA and Holm-Sidak test on results of three independent experiments in each model. Statistical analyses of biopsy mRNA expression levels were performed using either paired Wilcoxon signed-rank test or Mann–Whitney test (Bonferroni corrected).
CONFLICT OF INTEREST
The authors state no conflict of interest.
ACKNOWLEDGMENTS
We thank S. Giltaire, C. Mathay, M. Hermant and A-L. Thomas for collecting samples and D. Van Vlaender and V. De Glas for expert technical assistance. Prof. M. Tammi (University of Eastern Finland, Kuopio) kindly provided the HA binding complex. Financial support from FRFC 2.4.522.10F and FNRS 1.5.003.06F grants to YP. EDV is supported by a grant from the Région Wallonne.
REFERENCES
Bai KJ, Spicer AP, Mascarenhas MM, et al. (2005) The role of hyaluronan synthase 3 in ventilator-induced lung injury. Am J Respir Crit Care Med 172:92-8.
Barnes L, Carraux P, Saurat JH, et al. (2012) Increased expression of CD44 and hyaluronate synthase 3 is associated with accumulation of hyaluronate in spongiotic epidermis. J Invest Dermatol 132:736-8.
Bourguignon LY, Ramez M, Gilad E, et al. (2006) Hyaluronan-CD44 interaction stimulates keratinocyte differentiation, lamellar body formation/secretion, and permeability barrier homeostasis. J Invest Dermatol 126:1356-65.
Camenisch TD, Spicer AP, Brehm-Gibson T, et al. (2000) Disruption of hyaluronan synthase-2 abrogates normal cardiac morphogenesis and hyaluronan-mediated transformation of epithelium to mesenchyme. J Clin Invest 106:349-60.
Farwick M, Gauglitz G, Pavicic T, et al. (2011) Fifty-kDa hyaluronic acid upregulates some epidermal genes without changing TNF-alpha expression in reconstituted epidermis. Skin Pharmacol Physiol 24:210-7.
Frankart A, Malaisse J, De Vuyst E, et al. (2012) Epidermal morphogenesis during progressive in vitro 3D reconstruction at the air-liquid interface. Exp Dermatol 21:871-5.
Giltaire S, Herphelin F, Frankart A, et al. (2009) The CYP26 inhibitor R115866 potentiates the effects of all-trans retinoic acid on cultured human epidermal keratinocytes. Br J Dermatol 160:505-13.
Itano N, Sawai T, Yoshida M, et al. (1999) Three isoforms of mammalian hyaluronan synthases have distinct enzymatic properties. J Biol Chem 274:25085-92.
Jameson JM, Cauvi G, Sharp LL, et al. (2005) Gammadelta T cell-induced hyaluronan production by epithelial cells regulates inflammation. J Exp Med 201:1269-79.
Karvinen S, Pasonen-Seppanen S, Hyttinen JM, et al. (2003) Keratinocyte growth factor stimulates migration and hyaluronan synthesis in the epidermis by activation of keratinocyte hyaluronan synthases 2 and 3. J Biol Chem 278:49495-504.
Kaya G, Grand D, Hotz R, et al. (2005) Upregulation of CD44 and hyaluronate synthases by topical retinoids in mouse skin. J Invest Dermatol 124:284-7.
Kobayashi N, Miyoshi S, Mikami T, et al. (2010) Hyaluronan deficiency in tumor stroma impairs macrophage trafficking and tumor neovascularization. Cancer Res 70:7073-83.
Lin W, Shuster S, Maibach HI, et al. (1997) Patterns of hyaluronan staining are modified by fixation techniques. J Histochem Cytochem 45:1157-63.
Livak KJ, Schmittgen TD (2001) Analysis of relative gene expression data using real-time quantitative PCR and the 2(-Delta Delta C(T)) Method. Methods 25:402-8.
Mack JA, Feldman RJ, Itano N, et al. (2011) Enhanced Inflammation and Accelerated Wound Closure Following Tetraphorbol Ester Application or Full-Thickness Wounding in Mice Lacking Hyaluronan Synthases Has1 and Has3. J Invest Dermatol.
Mathay C, Giltaire S, Minner F, et al. (2008) Heparin-binding EGF-like growth factor is induced by disruption of lipid rafts and oxidative stress in keratinocytes and participates in the epidermal response to cutaneous wounds. J Invest Dermatol 128:717-27.
Mathay C, Pierre M, Pittelkow MR, et al. (2011) Transcriptional profiling after lipid raft disruption in keratinocytes identifies critical mediators of atopic dermatitis pathways. J Invest Dermatol 131:46-58.
Maytin EV, Chung HH, Seetharaman VM (2004) Hyaluronan participates in the epidermal response to disruption of the permeability barrier in vivo. Am J Pathol 165:1331-41.
Meyer LJ, Stern R (1994) Age-dependent changes of hyaluronan in human skin. J Invest Dermatol 102:385-9.
Minner F, Herphelin F, Poumay Y (2010) Study of epidermal differentiation in human keratinocytes cultured in autocrine conditions. Methods Mol Biol 585:71-82.
Minner F, Poumay Y (2009) Candidate housekeeping genes require evaluation before their selection for studies of human epidermal keratinocytes. J Invest Dermatol 129:770-3.
Monslow J, Sato N, Mack JA, et al. (2009) Wounding-induced synthesis of hyaluronic acid in organotypic epidermal cultures requires the release of heparin-binding egf and activation of the EGFR. J Invest Dermatol 129:2046-58.
Ohtani T, Memezawa A, Okuyama R, et al. (2009) Increased hyaluronan production and decreased E-cadherin expression by cytokine-stimulated keratinocytes lead to spongiosis formation. J Invest Dermatol 129:1412-20.
Oyoshi MK, He R, Kumar L, et al. (2009) Cellular and molecular mechanisms in atopic dermatitis. Adv Immunol 102:135-226.
Pasonen-Seppanen S, Karvinen S, Torronen K, et al. (2003) EGF upregulates, whereas TGF-beta downregulates, the hyaluronan synthases Has2 and Has3 in organotypic keratinocyte cultures: correlations with epidermal proliferation and differentiation. J Invest Dermatol 120:1038-44.
Pasonen-Seppanen SM, Maytin EV, Torronen KJ, et al. (2008) All-trans retinoic acid-induced hyaluronan production and hyperplasia are partly mediated by EGFR signaling in epidermal keratinocytes. J Invest Dermatol 128:797-807.
Passi A, Sadeghi P, Kawamura H, et al. (2004) Hyaluronan suppresses epidermal differentiation in organotypic cultures of rat keratinocytes. Exp Cell Res 296:123-34.
Pienimaki JP, Rilla K, Fulop C, et al. (2001) Epidermal growth factor activates hyaluronan synthase 2 in epidermal keratinocytes and increases pericellular and intracellular hyaluronan. J Biol Chem 276:20428-35.
Poumay Y, Herphelin F, Smits P, et al. (1999) High-cell-density phorbol ester and retinoic acid upregulate involucrin and downregulate suprabasal keratin 10 in autocrine cultures of human epidermal keratinocytes. Mol Cell Biol Res Commun 2:138-44.
Rilla K, Oikari S, Jokela TA, et al. (2013a) Hyaluronan synthase 1 (HAS1) requires higher cellular UDP-GlcNAc concentration than HAS2 and HAS3. J Biol Chem 288:5973-83.
Rilla K, Pasonen-Seppanen S, Deen AJ, et al. (2013b) Hyaluronan production enhances shedding of plasma membrane-derived microvesicles. Exp Cell Res 319:2006-18.
Rilla K, Pasonen-Seppanen S, Rieppo J, et al. (2004) The hyaluronan synthesis inhibitor 4-methylumbelliferone prevents keratinocyte activation and epidermal hyperproliferation induced by epidermal growth factor. J Invest Dermatol 123:708-14.
Rilla K, Siiskonen H, Spicer AP, et al. (2005) Plasma membrane residence of hyaluronan synthase is coupled to its enzymatic activity. J Biol Chem 280:31890-7.
Rock K, Meusch M, Fuchs N, et al. (2012) Estradiol protects dermal hyaluronan/versican matrix during photoaging by release of epidermal growth factor from keratinocytes. J Biol Chem 287:20056-69.
Saavalainen K, Pasonen-Seppanen S, Dunlop TW, et al. (2005) The human hyaluronan synthase 2 gene is a primary retinoic acid and epidermal growth factor responding gene. J Biol Chem 280:14636-44.
Sayo T, Sugiyama Y, Takahashi Y, et al. (2002) Hyaluronan synthase 3 regulates hyaluronan synthesis in cultured human keratinocytes. J Invest Dermatol 118:43-8.
Siiskonen H, Karna R, Hyttinen JM, et al. (2014) Hyaluronan synthase 1 (HAS1) produces a cytokine-and glucose-inducible, CD44-dependent cell surface coat. Exp Cell Res 320:153-63.
Tammi R, Saamanen AM, Maibach HI, et al. (1991) Degradation of newly synthesized high molecular mass hyaluronan in the epidermal and dermal compartments of human skin in organ culture. J Invest Dermatol 97:126-30.
Toole BP (2004) Hyaluronan: from extracellular glue to pericellular cue. Nat Rev Cancer 4:528-39.
Tran QT, Kennedy LH, Leon Carrion S, et al. (2012) EGFR regulation of epidermal barrier function. Physiol Genomics 44:455-69.
Tuhkanen AL, Tammi M, Pelttari A, et al. (1998) Ultrastructural analysis of human epidermal CD44 reveals preferential distribution on plasma membrane domains facing the hyaluronan-rich matrix pouches. J Histochem Cytochem 46:241-8.
Wells AF, Lundin A, Michaelsson G (1991) Histochemical localization of hyaluronan in psoriasis, allergic contact dermatitis and normal skin. Acta Derm Venereol 71:232-8.
Yamada Y, Itano N, Hata K, et al. (2004) Differential regulation by IL-1beta and EGF of expression of three different hyaluronan synthases in oral mucosal epithelial cells and fibroblasts and dermal fibroblasts: quantitative analysis using real-time RT-PCR. J Invest Dermatol 122:631-9.
FIGURE LEGENDS
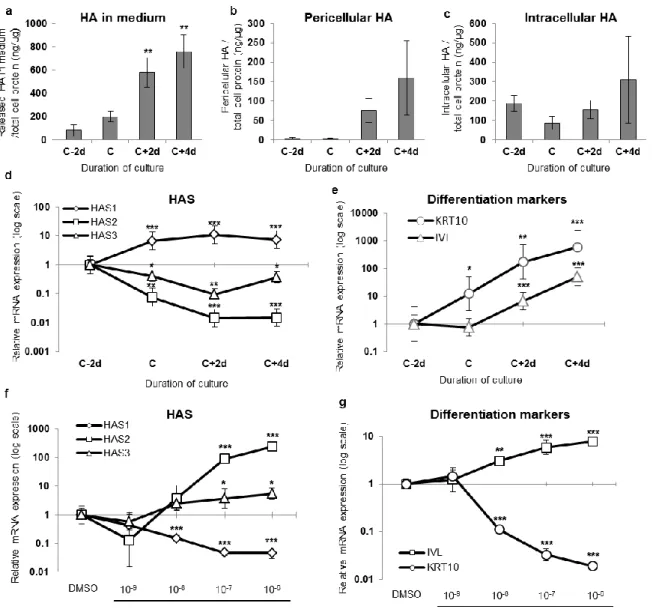
Figure 1
HA concentration and HAS expression correlate with epidermal differentiation in keratinocyte monolayers.
HA amounts (means±SEM of triplicates) in culture medium (a), released by trypsin incubation (pericellular HA; b), or measured in total cell extracts (intracellular HA; c) of keratinocyte autocrine monolayers were determined every 48h, starting two days before confluence (C-2d) until four days after confluence (C+4d) and normalized to cell proteins. The expression of the 3 main HA synthases (HASs) was measured by real-time PCR during the growth of autocrine monolayers (d) or in confluent cultures incubated for 18h with all-trans retinoic acid (10-9-10 -6mol.L-1) or DMSO as control (f).Epidermal differentiation was analyzed by measuring the
relative expression levels of KRT10 and IVL mRNA (e and g). The mRNA levels at C-2d (e) and DMSO (g) were arbitrarily fixed at 1. The y-axis is a logarithmic scale and error bars represent 95% confidence intervals (n=3, ANOVA 1RM, *P<0.05, **P<0.01, ***P<0.001 vs C-2d or DMSO).
Figure 2
Analysis of HA depletion by 4-methylumbelliferone (4MU) or Streptomyces hyaluronidase (Hase) on relative mRNA expression levels of involucrin (IVL), filaggrin (FLG) and keratin 10 (KRT10) in monolayer culture of keratinocytes during their epidermal differentiation. Keratinocytes were grown in monolayer and the differentiation was
induced by confluence. Cells were treated with 1U/ml of Hase (a, c and e) or 0.5mM of 4MU (b, d and f) during 48h at each confluence stages. The expression of KRT10 (a and b), IVL (c
and d) and FLG (e and f) was measured by real-time PCR and expression levels were normalized to the average expression of two housekeeping genes (RPLP0 and TBP). The mRNA levels in control conditions were taken as references and arbitrarily fixed at 1. The y axis is a logarithmic scale and error bars represent 95% confidence intervals (n=3, ANOVA 2RM analysis of variance)
Figure 3
HA concentration and distribution during the reconstruction of human epidermis.
Reconstructed human epidermises (RHEs) were obtained after 1, 3, 5, 7, 9 and 11 days of growth. The newly synthesized HA in the medium (a) and in the RHE layer (b) were measured every 48 h and normalized with respect to total cellular protein concentration. Data are shown as means ± SEM (n=3, ANOVA 1RM, *P<0.05, **P<0.01, ***P<0.001 vs day 1). (c) RHEs obtained after 1, 3, 5, 7, 9 and 11 days of growth on polycarbonate filter at the air-liquid interface were fixed, processed for histology and stained for morphology (hematoxylin/eosin) or for HA (green) and nuclei (Hoechst 33258; blue). The differentiation process was assessed based on the staining of KRT10 and IVL. Bar = 50 μm.
mRNA expression of HA synthases during the reconstruction of human epidermis. Total
RNA from reconstructed human epidermis (RHE) obtained after 1, 3, 5, 7, 9 and 11 days of growth was extracted, reverse transcription was performed, and cDNA was analyzed by real-time PCR. The expression levels of HAS1-3, keratin10 (KRT10) and Loricrin (Lor) were normalized to the average expression of two housekeeping genes (RPLP0 and TBP). The mRNA level at day 1 was taken as reference and arbitrarily set at 1. The y-axis is a logarithmic scale and error bars represent 95% confidence intervals (n=3, ANOVA 1RM, *P<0.05, **P<0.01, ***P<0.001 vs day 1).
Figure 5
HA distribution and mRNA expression of HA synthases in atopic dermatitis (AD) skin samples. Sections of normal skin (a,d), non-lesional skin of AD patient (b,e), and lesional skin
of AD patient (c,f) were stained with hematoxylin/eosin/Saffron (a,b,c) or labelled with a biotinylated HA binding protein (d,e,f). Bar = 100 μm. (g) Total RNA was extracted from biopsies of 11 normal skins, 9 non-lesional skins of AD patients, and 9 lesional skins of AD patients. Real-time PCR was performed and the values are expressed relative to the means of 10 healthy samples. Statistical analyses were performed by a paired Wilcoxon signed-rank test for the comparison of lesional versus non-lesional AD skin and by a Mann–Whitney test for the comparisons of lesional and non-lesional versus healthy skin (*P<0.05, ***P<0.001).
Figure 6
HB-EBF distribution in AD skin and mRNA expression of HA synthases during reconstruction of human epidermis incubated with HB-EGF. Sections of normal skin (a,d),
non-lesional skin of AD patient (b,e), and lesional skin of AD patient (c,f) were labelled (a,b,c) or not (d,e,f) with an antibody against HB-EBF (d,e,f). Bar = 50 μm. (g) Reconstructed human epidermises (RHEs) were incubated at first day of reconstruction with concentrations of rHB-EGF ranging from 0 to 25 ng.mL-1. rHB-EGF was renewed every two days until 11th day of
reconstruction. Total RNA was extracted from each culture and real-time PCR was performed. The mRNA levels of 0 ng.mL-1 rHB-EGF were arbitrarily set at 1 and error bars represent 95%
SUPPLEMENTARY DATA
Supplementary figure 1
Size distribution of HA present in the medium of monolayer cultures and recombinant human epidermis (RHE)
Human keratinocytes were grown as either (a) autocrine monolayers with differentiation induced by cell confluence; they were analysed 2 days before confluence (C-2d), at confluence (C) and 2 and 4 days after confluence (C+2d and C+4d); or (b) reconstructed epidermis (RHE); they were analyzed after 5, 7, 9 and 11 days of growth. The newly synthesized HA released into the medium every 48 h was chromatographed on a column of Sephacryl S-1000 together with HA standard fragments of 2500, 500 and 150 kDa. HA was measured in each fraction and shown as mean ± SD (n=3). The peak maximum of HA standard fragments is represented in each graph (). Graph (c) compares the size distributions of post-confluent monolayer (C+4d) and RHE (11d).
Supplementary figure 2
mRNA expression of hyaluronidases (HYAL1 and HYAL2) during differentiation of keratinocyte cultures or reconstruction of human epidermis (RHE).
Keratinocytes were grown in two models as described in Supplementary figure 1. Total RNA was extracted from each culture condition from two days before confluence (C-2d) until four days after confluence (C+4d) in monolayers (a,b) or after 1, 3, 5, 7, 9 or 11 days of tissue reconstruction (c,d). Reverse transcription was performed and cDNA was analyzed by real-time PCR. Expression levels of HYAL1 and HYAL2 were normalized to the average expression of two housekeeping genes (RPLP0 and TBP). The mRNA level at C-2d was taken as reference and arbitrarily fixed at 1. The error bars represent 95% confidence intervals (n=3, ANOVA 1RM, *P<0.05, ***P<0.001 vs C-2d or 1d).
Supplementary figure 3
Abundance of total and phosphorylated EGF receptor (EGFR and pEGFR) and amount of HAS1 and HAS3 during epidermal differentiation and treatment with an EGFR neutralizing antibody
(a) Keratinocytes were grown as autocrine monolayers and differentiation was induced by cell confluence. Proteins were extracted from each culture condition, from two days before confluence (C-2d) until four days after confluence (C+4d). Western blot analysis was performed using antibodies against EGFR and pEGFR. Keratin 10 was used to assess differentiation and RPL13a, as loading control. (b,c) Subconfluent cultures (C-2d) were incubated or not (CTL) with 10 µg/ml of EGFR neutralizing antibody (LA1) during 48 h. Proteins (b) were extracted from each culture condition and analysed as in (a); total RNA (c) was extracted from each condition, reverse transcribed, and the cDNA was analysed and quantified by real-time PCR. Expression levels of HAS1 and HAS3 were normalized to the average expression of two housekeeping genes (RPLP0 and TBP). The mRNA levels in control conditions were taken as references and arbitrarily fixed at 1. The y-axis in (c) is a logarithmic scale and error bars represent 95% confidence intervals (n=3, one-way analysis of variance, ***P<0.001 vs CTL conditions).
Supplementary figure 4
Analysis of HA depletion by 4-methylumbelliferone (4MU) or Streptomyces hyaluronidase (Hase) in monolayer culture of keratinocytes during their epidermal differentiation
Keratinocyte monolayers were exposed to various concentrations of 4MU or to 1 U/ml of Hase at different confluence stages from two days before confluence (C-2d) until four days after confluence (C+4d). (a) Cellular viability was analysed and expressed as percentage of surviving cells compared to untreated control. (b,c) Cells were treated with 0.5 mM of 4MU (b) or 1 U/ml of Hase (c) during 48 h at each confluence stage. The amount of newly synthesized HA released in the medium during that time was measured and normalized to total cell protein content. Data are shown as means ± SD (n=3, two-way analysis of variance, *P<0.05, **P<0.01, ***P<0.001).
SUPPLEMENTARY MATERIALS AND METHODS
Chemicals
Retinoic acid (RA), 4-methylumbelliferone (4MU) and Streptomyces hyaluronidase (Hase) were purchased from Sigma Aldrich (Bornem, Belgium). Neutralizing antibody against EGFR (clone LA1) was obtained from Millipore (Brussels, Belgium). EGF was obtained from R&D Systems (Abingdon, UK). Rabbit antihuman EGF receptor (EGFR), rabbit antihuman phosphor-EGFR Tyr 1173, and rabbit antihuman RPL13 antibodies were purchased from Cell Signaling (Leiden, The Netherlands). Mouse antihuman keratin 10 was from Dako (Heverlee, Belgium). HA standards for measurement of HA molecular weight were obtained from Hyalose (Oklahoma City, OK, USA).
Skin biopsies
Following approval by the ethics committees of the University Hospital in Liège and Clinique St-Luc in Namur, both in Belgium, this study was conducted in accordance with the Declaration of Helsinki. Nine volunteers suffering from atopic dermatitis (AD) underwent a superficial 2mm skin punch biopsy on lesional and surrounding non-lesional skin as described (Mathay et al., 2011). Abdominal samples obtained from plastic surgery were used as healthy controls and for in vitro culture experiments. All the subjects gave written informed consent before the examinations.
Cell culture and reconstruction of the epidermis
Keratinocyte cultures were grown in autocrine culture conditions as described earlier (Minner et al., 2010) and in polycarbonate culture inserts for reconstructed human epidermis (RHE) models described earlier (Frankart et al., 2012; Minner et al., 2010). Recombinant human HB-EGF (259-HE) was from R&D Systems (Abingdon, UK).
Measurement of HA molecular weight
The culture medium was collected, subjected to gel filtration on a column of Sephacryl S-1000 (Amersham Biosciences, Uppsala, Sweden) and eluted at 70 µl/min with 0.15 M sodium
acetate, 0.1% CHAPS (Sigma-Aldrich, Steinheim, Germany). After chromatography, HA was measured in each fraction as described previously. Samples of known molecular weight HA were chromatographed on the same columns.
MTT assay procedure
A volume of 0.5 ml of MTT solution (Sigma-Aldrich, Bornem, Belgium) at 0.5 mg/ml in defined culture medium was added onto cultures and incubated for 1 h at 37 °C (5% CO2). After
incubation, the MTT solution was discarded and 1 ml of isopropanol (Merck, Overijse, Belgium) was added to each culture. The extraction process of blue MTT solution was performed during 10 min at room temperature on a shaking platform. The Optical Density (OD) of the blue MTT solution at 540 nm was determined and the mean OD540 of the untreated controls was set to represent 100% of viability. The results are expressed as percentage of these controls.
Protein extraction and Western blotting
Keratinocytes were lyzed and scraped into Laemmli sample buffer (62.5 mM Tris-HCl, 2% sodium dodecyl sulphate, 8.7% glycerol, 0.05% bromophenol blue, 0.2% dithiothreitol). Extracted proteins were analyzed using SDS-polyacrylamide gel electrophoresis and transferred onto polyvinylidene difluoride (PVDF) membranes (GE Healthcare, Diegem, Belgium). Membranes were incubated for 1 h with specific antibodies diluted in PBS buffer containing 1% Tween 20 and 5% nonfat powdered milk. After a washing step, the membranes were incubated with HRP-conjugated antirabbit antibody (Cell Signaling, Leiden, The Netherlands). The chemiluminescence substrate from Roche (Basel, Switzerland) was used to visualize the recognized protein bands. For visualization, an ImageQuant LAS 4000mini (GE Healthcare, Diegem, Belgium) was used.
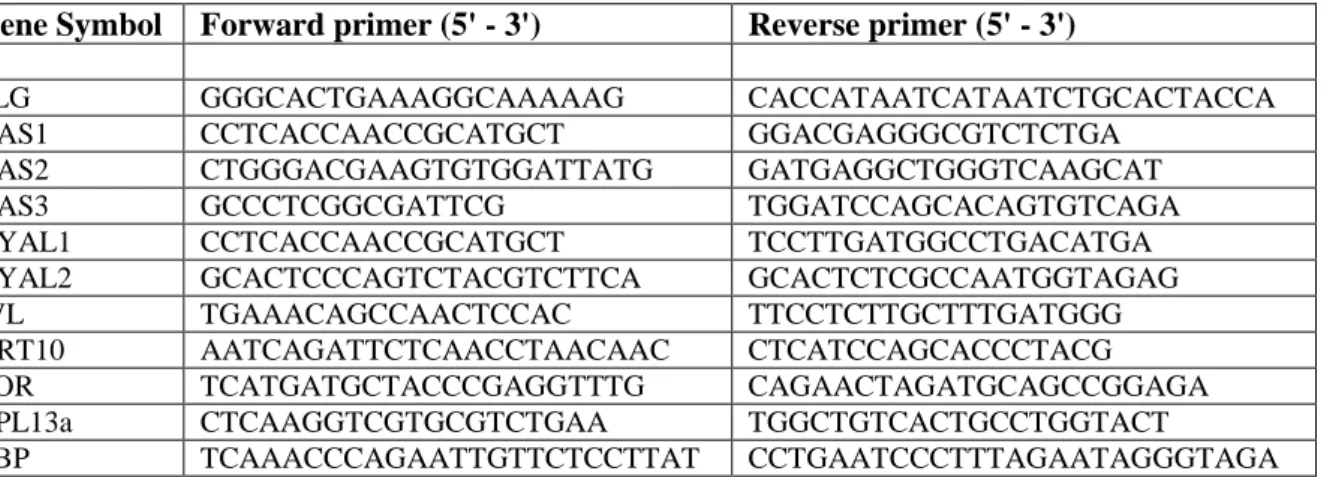
Table S1: real-time PCR primers
Gene Symbol Forward primer (5' - 3') Reverse primer (5' - 3')
FLG GGGCACTGAAAGGCAAAAAG CACCATAATCATAATCTGCACTACCA
HAS1 CCTCACCAACCGCATGCT GGACGAGGGCGTCTCTGA
HAS2 CTGGGACGAAGTGTGGATTATG GATGAGGCTGGGTCAAGCAT
HAS3 GCCCTCGGCGATTCG TGGATCCAGCACAGTGTCAGA
HYAL1 CCTCACCAACCGCATGCT TCCTTGATGGCCTGACATGA
HYAL2 GCACTCCCAGTCTACGTCTTCA GCACTCTCGCCAATGGTAGAG
IVL TGAAACAGCCAACTCCAC TTCCTCTTGCTTTGATGGG
KRT10 AATCAGATTCTCAACCTAACAAC CTCATCCAGCACCCTACG
LOR TCATGATGCTACCCGAGGTTTG CAGAACTAGATGCAGCCGGAGA
RPL13a CTCAAGGTCGTGCGTCTGAA TGGCTGTCACTGCCTGGTACT
TBP TCAAACCCAGAATTGTTCTCCTTAT CCTGAATCCCTTTAGAATAGGGTAGA
Reference
Frankart A, Malaisse J, De Vuyst E, et al. (2012) Epidermal morphogenesis during
progressive in vitro 3D reconstruction at the air-liquid interface. Experimental dermatology 21:871-5.
Mathay C, Pierre M, Pittelkow MR, et al. (2011) Transcriptional profiling after lipid raft disruption in keratinocytes identifies critical mediators of atopic dermatitis pathways. J Invest Dermatol 131:46-58.
Minner F, Herphelin F, Poumay Y (2010) Study of epidermal differentiation in human keratinocytes cultured in autocrine conditions. Methods Mol Biol 585:71-82.