HAL Id: hal-00302422
https://hal.archives-ouvertes.fr/hal-00302422
Submitted on 16 Jan 2007HAL is a multi-disciplinary open access
archive for the deposit and dissemination of sci-entific research documents, whether they are pub-lished or not. The documents may come from teaching and research institutions in France or abroad, or from public or private research centers.
L’archive ouverte pluridisciplinaire HAL, est destinée au dépôt et à la diffusion de documents scientifiques de niveau recherche, publiés ou non, émanant des établissements d’enseignement et de recherche français ou étrangers, des laboratoires publics ou privés.
A study on the relationship between mass
concentrations, chemistry and number size distribution
of urban fine aerosols in Milan, Barcelona and London
S. Rodríguez, R. van Dingenen, J.-P. Putaud, A. Dell’Acqua, J. Pey, X.
Querol, A. Alastuey, S. Chenery, K.-F. Ho, R. M. Harrison, et al.
To cite this version:
S. Rodríguez, R. van Dingenen, J.-P. Putaud, A. Dell’Acqua, J. Pey, et al.. A study on the relationship between mass concentrations, chemistry and number size distribution of urban fine aerosols in Mi-lan, Barcelona and London. Atmospheric Chemistry and Physics Discussions, European Geosciences Union, 2007, 7 (1), pp.605-639. �hal-00302422�
ACPD
7, 605–639, 2007Mass, chemistry and number size distribution of urban aerosols S. Rodr´ıguez et al. Title Page Abstract Introduction Conclusions References Tables Figures ◭ ◮ ◭ ◮ Back Close
Full Screen / Esc
Printer-friendly Version
Interactive Discussion Atmos. Chem. Phys. Discuss., 7, 605–639, 2007
www.atmos-chem-phys-discuss.net/7/605/2007/ © Author(s) 2007. This work is licensed
under a Creative Commons License.
Atmospheric Chemistry and Physics Discussions
A study on the relationship between mass
concentrations, chemistry and number
size distribution of urban fine aerosols in
Milan, Barcelona and London
S. Rodr´ıguez1,2,3,*, R. Van Dingenen1, J.-P. Putaud1, A. Dell’Acqua1, J. Pey3, X. Querol3, A. Alastuey3, S. Chenery2, K.-F. Ho5, R. M. Harrison4, R. Tardivo6, B. Scarnato7, and V. Gianelle7
1
Institute for Environment and Sustainability, Joint Research Centre, European Commission, T.P. 290, Ispra (VA) 21020, Italy
2
British Geological Survey, Keyworth, Nottingham, NG12 5GG, UK
3
Institute of Earth Science “Jaume Almera”, CSIC, Sol ´e i Sabar´ıs, S/N, 08028, Barcelona, Spain
4
University of Birmingham, Division of Environmental Health and Risk Management, Edgbaston, Birmingham B15 2TT, UK
5
The Hong Kong Polytechnic University, Department of Civil and Structural Engineering, TU418, Hung Hom, Kowloon, Hong Kong
6
Politecnico di Milano, Piazza Leonardo da Vinci, 32-20133 Milan, Italy
7
ACPD
7, 605–639, 2007Mass, chemistry and number size distribution of urban aerosols S. Rodr´ıguez et al. Title Page Abstract Introduction Conclusions References Tables Figures ◭ ◮ ◭ ◮ Back Close
Full Screen / Esc
Printer-friendly Version
Interactive Discussion * now at: University of Huelva – Iza ˜na Atmospheric Observatory (INM-CSIC), La Marina, 20,
6aplanta, 38071, Santa Cruz de Tenerife, Canary Islands, Spain
Received: 3 November 2006 – Accepted: 18 December 2006 – Published: 16 January 2007 Correspondence to: S. Rodr´ıguez (srodriguez@inm.es)
ACPD
7, 605–639, 2007Mass, chemistry and number size distribution of urban aerosols S. Rodr´ıguez et al. Title Page Abstract Introduction Conclusions References Tables Figures ◭ ◮ ◭ ◮ Back Close
Full Screen / Esc
Printer-friendly Version
Interactive Discussion Abstract
A physicochemical characterization of the urban fine aerosol (aerosol number size dis-tribution, chemical composition and mass concentrations) in Milan, Barcelona and Lon-don is presented in this article. The objective is to obtain a comprehensive picture on the involvement of the microphysical processes of the aerosol dynamic in the: 1) 5
regular evolution of the urban aerosol (daily, weekly and seasonal basis) and in the day-to-day variations (from clean-air to pollution-events), and 2) link between “aerosol chemistry and mass concentrations” with the “number size distribution”.
The mass concentrations of the fine PM2.5 aerosol exhibit a high correlation with the number concentration of particles >100 nm (which only accounts for <20% of the 10
total number concentration N of fine aerosols) and do not correlate with the num-ber of particles <100 nm (“ultrafine particles”, which accounts for >80% of fine par-ticles). Organic matter (OM) and black-carbon (BC) are the only aerosol components showing a significant correlation with ultrafine particles (attributed to vehicles emis-sions), whereas ammonium-nitrate, ammonium-sulphate and also OM and BC cor-15
relate with N>100(nm) (attributed to gas-to-particle transformation mechanisms and some primary emissions). Time series of the aerosol DpN diameter (dN/dlogD mode), mass PM2.5 concentrations and number N>100(nm) concentrations, exhibit corre-lated day-to-day variations which point to a significant involvement of condensation of semi-volatile compounds during urban pollution events. This agrees with the fact 20
that ammonium-nitrate is the component exhibiting the highest increases from mid-to-high pollution episodes, when the mid-to-highest DpN increases are observed. The results indicates that “fine PM2.5 particles urban pollution events” tend to occur when conden-sation processes have made particles grow enough to produce significant concentra-tions of N>100(nm). In contrast, because the low contribution of ultrafine particles to 25
the fine aerosol mass concentrations, high “ultrafine particles N<100(nm) events” fre-quently occurs under low PM2.5 conditions. The data of this study point that vehicles emissions are strongly involved in this ultrafine particles aerosol pollution (for example,
ACPD
7, 605–639, 2007Mass, chemistry and number size distribution of urban aerosols S. Rodr´ıguez et al. Title Page Abstract Introduction Conclusions References Tables Figures ◭ ◮ ◭ ◮ Back Close
Full Screen / Esc
Printer-friendly Version
Interactive Discussion the “morning-rush-hours to nocturnal-background” concentrations ratio is 1.5–2.5 for
“particles 10–100 nm” and <1.5 for both “particle >100 nm and PM2.5”).
1 Introduction
Atmospheric aerosol (or particulate matter-PM) is now one of the most concerning air pollutants owing to its ability to influence on climate, its adverse effects on human 5
health and the difficulties in controlling their emissions (e.g. Wichmann et al., 2000; Sun et al., 2005; IPCC, 2001). Studies on urban fine atmospheric aerosol are experiencing a growing interest owing to: 1) the aerosol characterisation is difficult because it is made up of a complex mixture of solid and liquid substances (some of them semi-volatile) with a large range in particle size and 2) the still not very well characterised 10
links between “urban and regional air quality” and “climate change”.
This concern on aerosol pollution in Europe has resulted in several studies focused on the composition and physical properties of PM throughout the continent (e.g. Ru-uskanen et al., 2001; Van Dingenen et al., 2004; Putaud et al., 2004; Querol et al., 2004; G ¨otschi et al., 2005; Rodr´ıguez et al., 2007). In Europe, fine PM2.5 particles 15
are mainly constituted by primary and secondary matter linked to combustion emis-sions, and also by mineral dust and sea salt. Although, the sources and composition of fine particles are being understood (except the biogenic contribution to organic mat-ter; e.g. Janson et al., 2001), there are still significant uncertainties. The involvement of the different microphysical processes of the aerosol dynamics (i.e. nucleation, co-20
agulation, condensation, evaporation, etc. . . ) in the “urban and regional fine aerosol pollution events” has not deeply been characterized. In order to contribute to reduce the uncertainties on this subject, we have performed a study on fine aerosols chem-ical composition, mass concentrations and number size distribution in three cities of Western Europe: Milan, Barcelona and London. The objective are: 1) to provide a 25
comprehensive picture on the involvement of the above cited microphysical processes in the regular daily, weekly and seasonal evolution of the urban aerosol, and 2) to
ACPD
7, 605–639, 2007Mass, chemistry and number size distribution of urban aerosols S. Rodr´ıguez et al. Title Page Abstract Introduction Conclusions References Tables Figures ◭ ◮ ◭ ◮ Back Close
Full Screen / Esc
Printer-friendly Version
Interactive Discussion study the microphysical processes leading to high mass concentration episodes by
linking the aerosol chemistry with the changes in the number size distribution. For this purpose, the data set from each study city was analysed in detail. Because the size of the data base and because we have made an effort in avoiding strong data reductions (e.g. avoiding so many “averages” which lead to information looses), the set of analysis 5
performed provided a large amount of results. We have made an effort for synthesizing in one single article the key findings, in order to provide this general view of fine ur-ban aerosols. Finally, the implications of these findings on our current “view” of urur-ban aerosol pollution are discussed.
2 Study regions
10
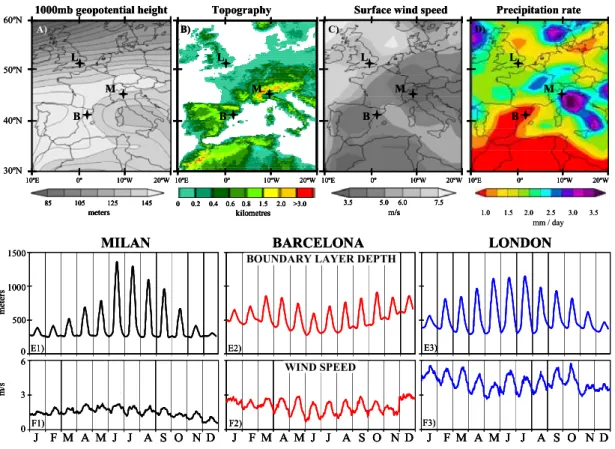
The factors affecting the pollutants transport and dispersion, as well as the aerosol composition, in Western Europe experience significant variations from South to North (Mill ´an et al., 2002; Rodr´ıguez et al., 2007). The three cities selected for this study are representative of some of these differences (Fig. 1).
London is located within a meteorological context favouring the frequent renovation 15
of air masses. This is due to the relatively flat terrain, the predominant mean westerly winds and frequent passages of cold fronts and depressions resulting in rain (Fig. 1). These are the predominant conditions at the North of the Alps and Pyrenees. In con-trast, the areas surrounding the Western Mediterranean basin are characterised by an abrupt topography, which coupled with the characteristic synoptic scale patterns, 20
results in low mean wind speeds and regional circulations that hinder the air mass renovations and favour the accumulation of aerosols in the surrounds of the emission regions (Fig. 1).
Barcelona is within a region where meteorological conditions favour the occurrence of high background levels of PM due to: 1) the predominant meteorology favouring 25
regional pollution events because of weak gradient conditions and regional recircula-tions, 2) the low precipitation rates in the region (the lowest of Europe) which enhances
ACPD
7, 605–639, 2007Mass, chemistry and number size distribution of urban aerosols S. Rodr´ıguez et al. Title Page Abstract Introduction Conclusions References Tables Figures ◭ ◮ ◭ ◮ Back Close
Full Screen / Esc
Printer-friendly Version
Interactive Discussion the residence time of aerosol, 3) an enhancement of the mineral dust resuspension
processes in cities (by road traffic) due to the scarce roads cleaning because of the low precipitation rates, and in rural areas due to the arid soils.
Milan is within the bottom of the Po valley, where intense urban pollution events are favoured by the very low wind speed and the frequent occurrence of inversion layers 5
near the ground in winter.
These differentiated conditions in the three cities are clearly evidenced in the local meteorological variables, such as in-situ wind speed (Fig. 1f) and the boundary layer depth (BLD; Fig. 1e). For example, observe how in summer the BLD maximises in Milan and London because of the thermal convective activity, whereas in Barcelona 10
it exhibits a minimum owing to the subsidence over the coast because of the vertical recirculation of air masses along the coastal ranges (resulting in a decrease in the “thickness of the in-land sea breeze layer”).
Another factor that contributes to differentiate the Mediterranean aerosol composition is the Saharan dust transport, which occurs with a much higher frequency in Southern 15
than in Central-Northern Europe.
3 Methodology
This study was performed in central urban background sites of Milan (Via-Messina), Barcelona (Institute “Jaume Almera” – CSIC) and London (Bloomsbury).
3.1 Aerosol chemical characterization 20
Sampling of PM2.5 (24-h sampling) was performed on quartz filters once every 4 days using DIGITEL™ high volume samplers. After filter conditioning, mass concentrations were determined by gravimetry. The concentrations of non-sea-salt-SO=4, NO−3, NH+4, sea salt (Na+Cl+sea-salt-SO=4), mineral dust (Al2O3+SiO2+Ca+CO=3+Ti+Fe+Sr),
or-ganic matter (OM=1.6*OC) and black carbon (BC) and some trace elements, were de-25
ACPD
7, 605–639, 2007Mass, chemistry and number size distribution of urban aerosols S. Rodr´ıguez et al. Title Page Abstract Introduction Conclusions References Tables Figures ◭ ◮ ◭ ◮ Back Close
Full Screen / Esc
Printer-friendly Version
Interactive Discussion termined by ion chromatography, thermal-optical-reflectance, ICP-AES, ICP-MS and
some indirect determinations described by Querol et al. (2001) and Cao et al. (2004). A total of 96, 94 and 65 PM2.5 samples from Milan, Barcelona and London were anal-ysed in this 1-year study, respectively.
3.2 Aerosol physical characterization 5
Aerosol number size distribution measurements were performed by using TSI™ Differ-ential Mobility Particle Sizers (particle size 10-800nm in MILAN and BARCELONA and 10–415 nm in London).
Gravimetric equivalent hourly mass concentrations of PM2.5 were determined by multiplying the hourly concentrations of aerosol volume (in Milan), “GRIMM™” PM2.5 10
(in Barcelona) and “TEOM™” PM2.5 (in London) by factors (slope of the linear relation-ships) obtained by cross correlating the PM2.5 concentrations determined by the filter sampling versus the aerosol volume (Milan), the “GRIMM™” PM2.5 (in Barcelona) and the “TEOM™” PM2.5 (in London), respectively.
At Milan and Barcelona, these measurements were performed from November 2003 15
to December 2004. At London, the number size distribution was measured from Jan-uary to December 2003, whereas the chemical characterization was performed from April 2004 to April 2005.
4 Results and discussion
The results are presented in several specific sections which gives response to the main 20
questions which prompted this study. Because during the data treatment we tried to avoid strong data reductions, some of the figures that will be shown in the following sections provide a high density of information. Our discussion will focus only on the most relevant points and mainly in the common aerosol features at the three sites.
ACPD
7, 605–639, 2007Mass, chemistry and number size distribution of urban aerosols S. Rodr´ıguez et al. Title Page Abstract Introduction Conclusions References Tables Figures ◭ ◮ ◭ ◮ Back Close
Full Screen / Esc
Printer-friendly Version
Interactive Discussion 4.1 Mean physical properties
Table 1 and Fig. 2 show the mean PM2.5 and number concentrations, as well as the mean size distributions at the three study sites. Annual mean concentrations of PM2.5, N>10(nm) and N10-100 at the three sites are within the range of typical values across Western Europe (Ruuskanen et al., 2001; Van Dingenen et al., 2004), PM2.5: 20– 5
45 µg/m3, N>10(nm): 10–25×103cm−3and N10-100: 10–20×103cm−3. N10-415 ac-counts for ∼99% of N>10(nm), whereas the ultrafine fraction N10-100 acac-counts for 80–85% of N>10(nm) at the 3 sites. The Milan and Barcelona to London ratios for PM2.5, N>10(nm) and N10-100 are equals to 2.3, 2.2 and 2.3 and 1.3, 1.5 and 1.5, respectively. The mode of the number (DpN: ∼37nm), surface (DpS: 180–230 nm) and 10
volume (DpV: 300–440 nm) size distribution exhibits the very well known displacement toward coarser fractions.
4.2 Mean chemical composition
Table 2 shows the mean chemical composition of PM2.5. The ‘most to less’ important PM2.5 contributors are: 1) OM (28–31% of PM2.5), 2) NO−3 at Milan (21%) & Lon-15
don (11%) and nss-SO=4 at Barcelona (14%), 3) nss-SO=4 at Milan (10%) and London (9%) and NO−3 at Barcelona (10%), 4) NH+4 (10% at Milan and 6–7% at Barcelona and London), and 5) BC (6–7%). Mineral dust concentrations are much higher at Barcelona (4.6 µg/m3) than at the other sites (1.7 µg/m3at Milan and 0.6 µg/m3at Lon-don), whereas nss-SO=4 concentrations are much lower in London (2.8 µg/m3) than in 20
the other sites (4.6 µg/m3).
MILAN exhibits the highest PM2.5 concentrations because of the much higher concentrations of OM and ammonium-nitrate. The difference PM2.5 (Milan) minus PM2.5 (Barcelona or London): 15 µgPM2.5/m3 = 7.0 µgNO−3/m
3
+ 5.5 µgOM/m3 + 2.5 µgNH+4/m3.
ACPD
7, 605–639, 2007Mass, chemistry and number size distribution of urban aerosols S. Rodr´ıguez et al. Title Page Abstract Introduction Conclusions References Tables Figures ◭ ◮ ◭ ◮ Back Close
Full Screen / Esc
Printer-friendly Version
Interactive Discussion 4.3 Aerosol daily evolution
The processes prompting the daily evolution of aerosols have been studied by perform-ing the followperform-ing analysis: 1) the daily evolution of the hourly mean values of the “road traffic intensity”, “primary trace gases concentrations (CO, NOxand SO2)” and “several
aerosols parameters (including the size distribution mode, mass concentrations and 5
number concentration in several size ranges)” during every day of the week (Fig. 3), 2) calculation of the increase ratio in the aerosol concentrations from the “nocturnal background (02:00-05:00)” to the “morning rush hours (06:00–08:00)” and to the whole “daylight period (06:00–18:00)” for the mass concentrations and for the number con-centrations in several size ranges (Fig. 4), 3) calculation of the correlation coefficient 10
between the weekly evolution of the aerosol mass concentrations, aerosol number con-centrations (in several size ranges) and trace gases linked to combustions emissions (Fig. 5). The following discussion is based on the results plotted in Figs. 3–5.
All metrics of the aerosol concentration exhibit a maximum during the morning rush hours of the working days owing to the vehicles emissions (Figs. 3a–b). Road traf-15
fic emissions result in a higher increase in the concentrations of ultrafine (<100 nm) than in the coarser particles (Fig. 4). The “morning-rush hours” to “nocturnal-background” concentrations ratio is 1.5–3.0 for particles <50 nm and ≤1.5 for par-ticles >200 nm (Fig. 4a1). The same trend is observed for the increase from the ‘nocturnal-background’ to the whole “daylight period” (Fig. 4b1). The DpN particle 20
diameter (dN/dlogD mode) exhibits values within the ranges 35–50 nm during daylight and 50–70 nm at night (Fig. 3c). This daily evolution is the result of: 1) an abrupt DpN decrease in the morning because the sharp increase in road traffic emissions, 2) low DpN values along the daylight owing to the “contribution of photochemical nucle-ation particles”, “evapornucle-ation of semi-volatile compounds from the particle’s surface” 25
and the still on course vehicle emissions (with a lower intensity than in the morning), and 3) a strong nocturnal DpN increase owing to the lack of significant emissions and the particles growth because the effects “particles coagulation” and “condensation of
ACPD
7, 605–639, 2007Mass, chemistry and number size distribution of urban aerosols S. Rodr´ıguez et al. Title Page Abstract Introduction Conclusions References Tables Figures ◭ ◮ ◭ ◮ Back Close
Full Screen / Esc
Printer-friendly Version
Interactive Discussion semi-volatile species onto pre-existing particles”. The daylight-to-night change in the
ambient conditions influences on this DpN daily evolution, by favouring evaporation during daylight (due to the increase in temperature and to the decrease of the gas-phase precursors concentrations owing to the dilution induced by the higher boundary layer depth; Fig. 1e) and condensation at night (conditions opposites to the diurnal 5
ones). Particle growth by coagulation in short time scales (∼hours) is the origin of the low residence time of particles <50 nm that we have observed, and contributes to the above cited high “morning-rush hours” and “daylight” to “nocturnal-background” con-centrations ratios (Fig. 4). Notice how N10-20 experiences a strong decrease after the evening-rush hour, which is not observed in the number concentration of particles 10
>100 nm owing to: 1) the growth of particles with an initial size <100nm contributes to
N>100(nm), and 2) coagulation is not as important for particles >100 nm. These ob-servations on the road traffic influence on the aerosol number size distribution, its daily evolution and the working-days to weekends changes, agrees with other observations in urban areas (e.g. Wehner et al., 2002; Wehner and Widensohler, 2003; Kittelson et 15
al., 2004; Harrison and Jones, 2005).
This analysis of the urban aerosol in the 3 study cites shows that:
1) the ultrafine particles N10-100 better reflect road traffic emissions than PM2.5 (e.g. observed this at MILAN in Fig. 3a1–b1). This is also valid for N>10(nm) owing to the ultrafine fraction N10-100 accounts for a very high portion of N>10(nm) (80–85%). 20
2) the daily evolution of PM2.5 is much better correlated with that of N>100(nm) than with that of dominant ultrafine N10-100 particles (Fig. 5). Observe in Fig. 3 how the above description for the particles >100 nm applies for PM2.5 as well. This is attributed to the fact that particles >100nm contributes to the aerosol mass and volume much more than ultrafine particles (even the later accounts for 80–85% of the total number 25
of fine particles; Fig. 1).
3) the daily evolution of the road traffic derived gas pollutants correlates better with the number concentration N than with PM2.5 (Figs. 5a2–d2).
ACPD
7, 605–639, 2007Mass, chemistry and number size distribution of urban aerosols S. Rodr´ıguez et al. Title Page Abstract Introduction Conclusions References Tables Figures ◭ ◮ ◭ ◮ Back Close
Full Screen / Esc
Printer-friendly Version
Interactive Discussion 4.4 Seasonal evolution and PM2.5 events
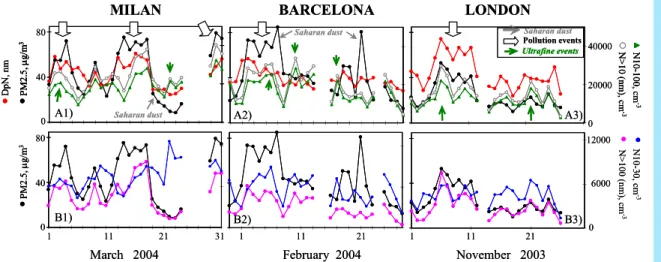
Figure 6 shows the “daily mean concentrations of PM2.5 including its most important contributors”, and the “hourly mean values of the aerosol size distribution mode (DpN), aerosol mass PM2.5 concentrations and aerosol number concentration in several size ranges’. In order to identify the processes involved in the “day-to-day changes of the 5
aerosol features” and in the “seasonal evolution of aerosols”, the following analysis were applied to the data plotted in Fig. 6: 1) the occurrence of “urban PM pollution episodes”, “African dust outbreaks” and “clean air events” was identified on the basis of the meteorology by analysing the time series of several aerosol parameters (using a methodology described in Rodr´ıguez et al. (2005, and references therein); see some 10
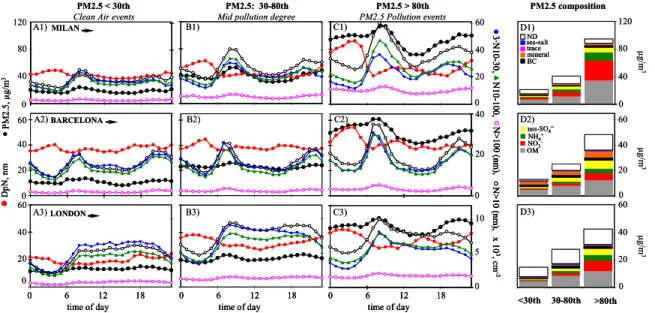
examples in Fig. 7), and 2) a study of the mean chemical composition and daily evolu-tion of aerosols during events of low (PM2.5<30th-percentile), mid (30th<PM2.5<80th) and high (PM2.5>80th) mass PM2.5 concentrations (Fig. 8).
Some of the PM2.5 chemical components exhibit features commonly observed across Europe (Fig. 6): 1) BC, OM and NO−3 levels maximises in winter, 2) nss-SO=4 15
exhibits higher background levels and a higher relative contribution in summer, and 3) nss-SO=4 and NO−3 mainly occurs as ammonium salts (ionic balance analysis not shown). Moreover, the number concentration in all size ranges exhibits higher levels in winter than in summer (Fig. 6). This winter maximum is prompted by several mecha-nisms, such as: 1) concentration of PM and its gaseous precursors owing to the less 20
“dilution” prompted by the “lower boundary layer depth”, and 2) lower temperature that favour condensation and rapid nucleation from fresh emissions. The differences in the aerosol mean concentration and in the intensity of the winter maximum observed at the three studied cities are strongly related to the meteorological features described above (Fig. 1).
25
As stated above, the occurrence of the main types of “aerosol episodes” was iden-tified on the basis of the meteorology (details on meteorological features will not be discussed here). As expected, “low PM – clean air episodes” mostly occurred
dur-ACPD
7, 605–639, 2007Mass, chemistry and number size distribution of urban aerosols S. Rodr´ıguez et al. Title Page Abstract Introduction Conclusions References Tables Figures ◭ ◮ ◭ ◮ Back Close
Full Screen / Esc
Printer-friendly Version
Interactive Discussion ing high wind speed events (frequently associated with air masses renovation linked
to cold front passages), “PM pollution episodes” were favoured by weak baric gradi-ent conditions and anticyclonic situations (frequgradi-ently associated with winter inversion layers near the ground at MILAN), and “Saharan dust transport” occurred under well known meteorological scenarios.
5
The most important PM2.5 pollution events occur in winter, when OM and ammonium-nitrate are the most important contributors (these components accounts for 75%, 50% and 47% of PM2.5 mass in winter (November–February) and 32%, 25% and 34% of PM2.5 in summer (June–August) at Milan, Barcelona and London, respec-tively). During periods dominated by concatenations of “urban pollution events” and 10
“clean air-low PM episodes”, the daily mean PM2.5 and DpN time series show signifi-cant correlations, indicating that PM2.5 is made up of coarser particles during “pollution events” than under “clean air conditions”. Figure 7 (where the types of events are high-lighted) shows some examples from the three studied cities, where it can be observed how DpN increases from 30 to ∼65 nm are associated with PM2.5 increases from 20 to 15
80 µg/m3at Milan and Barcelona and to 50 µg/m3at London, from “clean air” to “urban pollution” events. Observe in Fig. 8 (where the mean chemical composition and daily evolution of aerosols under different pollution degrees is shown) how the increase in the aerosol PM2.5 mass concentrations throughout the sequence “low-mid-high” lev-els is associated with an increase in the nocturnal DpN values, leaving the diurnal 20
DpN values relatively constant throughout the sequence. This indicates that an in-crease in the aerosol PM2.5 mass concentrations is associated with an enhancement in the nocturnal particle growth described above (“daily evolution” section). A detailed event-to-event analysis corroborates this simultaneous DpN and PM2.5 correlated in-creases at night during PM2.5 episodes (examples of episodes not shown for the sake 25
of brevity).
Although both “coagulation between particles” and “condensation of semi-volatile species onto pre-existing particles” may contribute to this nocturnal particle growth just described above (Figs. 8a to c), only condensation may accounts for the observed
ACPD
7, 605–639, 2007Mass, chemistry and number size distribution of urban aerosols S. Rodr´ıguez et al. Title Page Abstract Introduction Conclusions References Tables Figures ◭ ◮ ◭ ◮ Back Close
Full Screen / Esc
Printer-friendly Version
Interactive Discussion simultaneous increase in the particle’s DpN diameter and mass PM2.5
concentra-tions. This condensation of semi-volatile species is enhanced when temperature de-creases (e.g. winter vs. summer or night vs. daylight) and when reducing the “boundary layer depth” (owing to less dilution increases the concentration of gas-phase precur-sors favouring that these compounds easily exceed the equilibrium vapour pressure, 5
i.e. supersaturation). Our data points that condensation onto pre-existing particles of ammonium-nitrate at the three study sites and some OM species at MILAN are strongly involved in the particle growth from the “mid” to “high” PM2.5 events (when the high-est “daylight-to-night” DpN increase is observed; Fig. 8c). This is supported by these observations (Fig. 8):
10
1) ammonium and nitrate are the compounds exhibiting the highest increase from “mid” to “high” PM2.5 episodes at the three sites, with “high/mid concentration” ratios= 4.5 and 2.9 at Milan and London, and =3.5 and 2.5 at Barcelona for nitrate and ammo-nium, respectively, and <2 for the other major components (except for OM at Milan). This nocturnal formation of ammonium-nitrate, that would increase the particle diame-15
ter by condensation, has already been documented (Weber et al., 2001 and Alastuey et al., 2004).
2) the increase in the concentrations of OM from “mid” to “high” PM2.5 episodes is much higher than that of BC at Milan (“high/mid” events ratios= 3.1 for OM and 1.5 for BC) than at Barcelona (1.5 for OM and 1.2 for BC) and London (1.4 for OM and 1.1 20
for BC). Because the BC (a primary particle) increase is mainly attributed to the lower dilution during pollution episodes (because the lower “boundary layer depth”), the much higher OM increase at Milan is attributed to condensation processes (secondary OM formation).
These enhanced condensation conditions at Milan with respect to the other sites, 25
are favoured by: 1) lower winter temperatures, and 2) the much lower boundary layer depth due to the frequent occurrences of winter temperature inversions layers. This enhanced condensation may accounts for the: 1) larger summer-to-winter increase in OM, DpN and N>100(nm) at MILAN than the other sites (see these ratios in the
up-ACPD
7, 605–639, 2007Mass, chemistry and number size distribution of urban aerosols S. Rodr´ıguez et al. Title Page Abstract Introduction Conclusions References Tables Figures ◭ ◮ ◭ ◮ Back Close
Full Screen / Esc
Printer-friendly Version
Interactive Discussion per left corner of Figs. 6c, 6g, 6j), 2) much higher winter (∼9.5) than summer (∼5.8)
OM/BC ratios at Milan, whereas these ratios remains relatively constant from summer to winter both at Barcelona (∼5.2) and London (∼5.6). Notice how the most important daylight to night DpN increase is observed in Milan (Fig. 8), where the highest concen-trations of semi-volatile components (ammonium-nitrate and unidentified OM species) 5
are recorded.
Saharan dust transport also contributed to PM2.5 levels (Fig. 6d): 4 events occurred in Barcelona (over 94 filter samples), 3 events in Milan (96 samples) and any one in London (65 samples). Mineral dust concentrations during these Saharan dust episodes were into the ranges 8–15 µg/m3in Barcelona and 4–11 µg/m3in Milan. During mineral 10
dust events attributed to local urban sources (e.g. road traffic resuspension, demolition and contribution works), dust concentrations within the ranges 7–22 µg/m3, 3–6 µg/m3 and 1–2 µg/m3 in Barcelona, Milan and London, respectively, were observed. Min-eral dust experiences a seasonal evolution with a winter maximum both at Milan and London, and a summer maximum in Barcelona.
15
Finally, in the examples shown in Fig. 7, it can be observed how the total number con-centration N>10(nm) also tend to increase from the “clean air” to the “urban pollution” events, frequently from <1×10⁴ to >2×104cm−3. However, the degree of correlation between PM2.5 and the number concentration changes significantly depending on the particle size. Observe, in the examples shown in Fig. 7, how: 1) N>100(nm) shows 20
a good correlation with PM2.5, 2) N10-100 may exhibit concentrations equally high during both high and low PM2.5 concentrations episodes, 3) N10-30 may even reach higher concentrations during low than during high PM2.5, and 4) the number concen-tration and DpN doesn’t experience any significant variation during the Saharan dust events. These relationships are “quantified”, and its origin discussed, in the following 25
ACPD
7, 605–639, 2007Mass, chemistry and number size distribution of urban aerosols S. Rodr´ıguez et al. Title Page Abstract Introduction Conclusions References Tables Figures ◭ ◮ ◭ ◮ Back Close
Full Screen / Esc
Printer-friendly Version
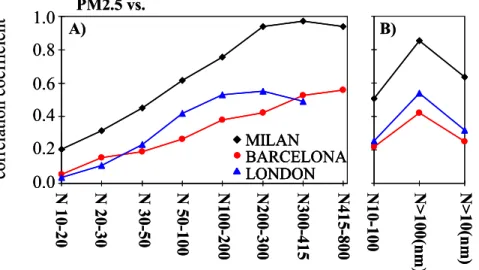
Interactive Discussion 4.5 Relationship between PM2.5 and number size distribution
The relationship between the aerosol PM2.5 mass concentrations and the number size distribution has been studied by: 1) calculating and analysing the correlation coeffi-cient between PM2.5 and the number concentration in several size ranges (Fig. 9), 2) analysing the “scatter plots” of PM2.5 versus the number concentration in several size 5
ranges (Fig. 10), and 3) calculating and analysing the correlation coefficient between the main PM2.5 chemical constituents and the number concentration in several size ranges (Fig. 11). The following discussion is based on these analysis performed over the 1 year data base.
Because the particle mass increases with the particle size, the correlation between 10
PM2.5 and number concentrations increases with the particle diameter, from “r”<0.2 for 10–20 nm to 0.6–1.0 for >400 nm (Fig. 9a). As consequence, PM2.5 correlates much better with N>100(nm) (a fraction which only accounts for a 15–20% of the total number concentration N>10(nm)) than with the dominant ultrafine fraction N10-100 (Fig. 9).
15
The correlation of most of PM2.5 components with the number concentration in-creases with the particle diameter (Figs. 11c–k, this analysis is not available for Lon-don). This is more clearly observed for secondary species such as nss-SO=4, NO−3 and NH+4 (Figs. 11f, g and h), whose gas-to-particle conversion rates onto the surface of pre-exiting particles are favoured under the presence of particles with a large surface 20
(such as those >100nm; Fig. 2b): “according to the Kelvin effect the equilibrium vapour pressure over a sphere increases when the sphere’s diameter decreases”. In contrast, BC and OM exhibits high “r” values both in the ultrafine and >100 nm size fraction owing to the primary vehicles emissions and the subsequent particle growth by coagulation and condensation (Figs. 1d–e). Observe how BC and OM are the only components 25
exhibiting a significant correlation with the ultrafine N10-100 particles (Figs. 11a–b). These size distributions of the correlation coefficients (Figs. c–k) resemble those of the chemical PM2.5 components obtained by cascade impactor sampling (Putaud et al.,
ACPD
7, 605–639, 2007Mass, chemistry and number size distribution of urban aerosols S. Rodr´ıguez et al. Title Page Abstract Introduction Conclusions References Tables Figures ◭ ◮ ◭ ◮ Back Close
Full Screen / Esc
Printer-friendly Version
Interactive Discussion 2004; Cabadas et al., 2004).
Because both the particle’s surface and mass increases with the particle’s diameter, the N>100(nm) number, mass PM2.5 concentration and surface concentrations are positively correlated (Figs. 9, 10c–d). This indicates that: 1) an increase in N>100(nm) results in an increase of the aerosol surface available for gas-to-particle transfer of 5
matter by condensation, and 2) “urban PM2.5 pollution events” mostly occurs when particles are grown enough to result in high N>100(nm) values (e.g. by condensation onto the surface of pre-existing particles of ammonium-nitrate; Figs. 11f–h). Observe in Fig. 7 how N>100(nm) is the only particle’s size fraction that exhibits high concen-trations only during PM2.5 episodes.
10
4.6 PM2.5 versus ultrafine particles events
The data analysis described above (Figs. 7–11) also allowed to study the relationship between aerosol PM2.5 mass and ultrafine N10-100 particles events.
The relationship of the ultrafine N10-100 fraction (and its subsets) with PM2.5 is more complex than the “simple positive correlation between PM2.5 and N>100(nm)”. 15
Observe in Fig. 7 how N10-30, N10-100 and N>10(nm) may exhibits high concen-trations during both high and low PM2.5 events. According to the involvement of the different microphysical processes on the relationship between PM2.5 and ultrafine par-ticles, we distinguish these events:
A) Simultaneous high or low “PM2.5 and N10-100 events” are observed during con-20
catenations of some “clean air” and “PM2.5 pollution” events (e.g. 1–7 and 29–31 March 2004 at Milan, 1–9 February 2004 at Barcelona or 1–12 November 2003 at London; Fig. 7), when the previously discussed influence of meteorology results in the increase or decrease of PM concentrations. The data of the central part of the PM2.5 vs. N10-30 and PM2.5 vs. N10-100 scatter plots are associated with this type of events 25
(Figs. 10a–b). During these episodes, the increase in PM2.5 levels occur because par-ticles have grown enough to produce a significant N>100(nm) values (observe in Fig. 7 the DpN and N>100(nm) increases during the above cited examples).
ACPD
7, 605–639, 2007Mass, chemistry and number size distribution of urban aerosols S. Rodr´ıguez et al. Title Page Abstract Introduction Conclusions References Tables Figures ◭ ◮ ◭ ◮ Back Close
Full Screen / Esc
Printer-friendly Version
Interactive Discussion B) Low PM2.5 and high N10-100 episodes (also associated with N10-30 events) are
frequently recorded (e.g. 20–24 of March 2004 at Milan, 9–13 and 17 of February 2004 at Barcelona and 21–22 and 24 of November 2003 at London; Fig. 7). These events are caused by the occurrence of “very small fresh particles” (observe in Fig. 7 the low “DpN and N>100(nm)” and high “N10-30” values during the above cited examples) as-5
sociated with two possible processes: 1) recent primary emissions (e.g. BC and some OM species) and 2) new particles formation by nucleation (e.g. sulphate and some OM species; Jung et al., 2006). The fact that the aerosol surface concentrations are low during these events (Fig. 10d) favours the occurrence of these very small particles, be-cause under low aerosol surface concentrations: 1) the coagulation rates remain low 10
(increasing the residence time of these fresh small particles), and 2) the condensation rates decreases and consequently the gas-to-particle transfer of matter by nucleation is favoured with respect to higher PM2.5 concentration events (this is due to the fact that condensation and nucleation are competing processes, being the first favoured under high aerosol surface concentrations and vice versa; see a discussion on this in 15
Rodr´ıguez et al., 2005). This type of events accounts for the data located in the right lower corner (“labelled as fresh PM”) of the PM2.5 vs. N10-30 and PM2.5 vs. N10-100 scatter plots (Figs. 10a–b).
C) High PM2.5 and low N10-100 episodes. Examples (Fig. 7): 4 and 13–15 March 2004 at Milan and 7, 18–19 and 21 February 2004 at Barcelona. The following mecha-20
nisms may be involved in these events: 1) an enhancement of coagulation and conden-sation processes in relatively “aged air” (e.g. during pollution events at night; Fig. 8c), and 2) the presence of high density primary particles (e.g. fly-ashes, metals or mineral local or Saharan dust). These types of events account for the data located in the left upper corner (“labelled as aged PM” according to the first mechanism cited above) of 25
the PM2.5 vs. N10-30 and PM2.5 vs. N10-100 scatter plots (Fig. 10a–b).
The influence of the above cited mechanisms favouring the presence of ultrafine particles under low PM2.5 concentrations is also observed in Fig. 8: the decrease in the aerosol concentrations from “high-to-mid” and “mid-to-low” PM2.5 events exhibits
ACPD
7, 605–639, 2007Mass, chemistry and number size distribution of urban aerosols S. Rodr´ıguez et al. Title Page Abstract Introduction Conclusions References Tables Figures ◭ ◮ ◭ ◮ Back Close
Full Screen / Esc
Printer-friendly Version
Interactive Discussion ratios ∼0.5 for PM2.5, 0.6 for N>100(nm), 0.8 for N10-100 and 0.9 for N10-30 at the
3 sites. Observe how the decrease is much less important for ultrafine particles. This could have implications for air quality improvements strategies: “a decrease in the aerosol precursor emissions may raise the ultrafine particles load in urban air”. The relationships leading to these conclusions have also been observed in urban and rural 5
areas (Wichmann et al., 2000; Laakso et al., 2003; Rodr´ıguez et al., 2005).
5 Summary and conclusions
In this article, data on urban fine aerosol physicochemical characterization in Milan, Barcelona and London are studied. The analysis of the aerosol number size distri-bution, chemical composition and mass PM2.5 concentrations data, provides a com-10
prehensive picture on the involvement of the different microphysical processes of the aerosol dynamics (i.e. nucleation, coagulation, condensation, evaporation, etc. . . ) in the regular evolution of the urban aerosol in a daily, weekly and seasonal basis as well as in the aerosol evolution from clean to pollution episodes.
Mean concentrations of PM2.5 and N>10(nm) at the three sites are within the range 15
of typical values across Western Europe, PM2.5: 20–45 µg/m3 and N>10(nm): 10– 25×103cm−3, being the highest concentrations recorded in Milan and the lowest in London. Ultrafine particles N10-100 accounts 80–85% of the total number concen-tration of fine aerosol, and the number size distribution mode (DpN) is ∼37 nm. The results of this study evidence the much higher levels of: 1) “mineral dust” in the Mediter-20
ranean cities (4.6 µg/m3 in Barcelona, 1.7 µg/m3 in Milan and 0.6 µg/m3 in London) and 2) organic matter and ammonium-nitrate in the Po Valley (Milan 7.0 µgNO−3/m3, 5.5 µgOM/m3 and 2.5 µgNH+4/m3 higher than in Barcelona and London). The links between “aerosol chemical composition and mass concentrations” with the “number size distribution” have been studied in terms of the involvement of the microphysical 25
processes.
con-ACPD
7, 605–639, 2007Mass, chemistry and number size distribution of urban aerosols S. Rodr´ıguez et al. Title Page Abstract Introduction Conclusions References Tables Figures ◭ ◮ ◭ ◮ Back Close
Full Screen / Esc
Printer-friendly Version
Interactive Discussion centrations of fine PM2.5 aerosols exhibits a high correlation with the number
concen-tration of particles >100nm (N>100(nm) and its subsets) and a low correlation with the number of particles <100 nm (N<100(nm) and its subsets). These associations, which are consistently observed all across the analysis of the daily, weekly and sea-sonal evolution, as well as in the day-to-day aerosol variations, indicates that PM2.5 5
is significantly influenced by the microphysical processes leading to the presence of N>100(nm). The following positive correlations are observed: 1) ammonium-nitrate and ammonium-sulphate with N>100(nm), attributed to gas-to-particle transformation mechanisms involving “condensation onto” and/or “reaction with” the surface of pre-existing particles, 2) organic matter (OM) and black-carbon (BC) with both the ultrafine 10
N<100(nm) and the coarser N>100(nm), attributed to road traffic emissions and sub-sequent particle growth due to coagulation and condensation processes. Moreover, OM and BC are the only aerosol components showing a significant correlation with the ultrafine particles, which is attributed to road traffic emissions.
The involvement of the different microphysical processes on aerosol variations in 15
several time scales has been studied:
Daily evolution. Because the diurnal “primary emissions, nucleation and evapora-tion processes” and the nocturnal “particle growth by condensaevapora-tion and coagulaevapora-tion”, aerosol tend to be lesser during daylight (DpN: 35–50 nm) than at night (DpN: 50– 70 nm). Road traffic emissions results in a much higher increase in the ultrafine than in 20
coarser particles: “nocturnal-background” to “morning rush hours” increase of 1.5–2.5 for ultrafine N10-100 particles and <1.5 for N>100(nm) and PM2.5.
Seasonal evolution and pollution PM2.5 events. Time series of daily mean values of DpN, PM2.5 and N>100(nm) tend to exhibits day-to-day correlated variations dur-ing the concatenation of “urban pollution events” and “classical clean air episodes (in 25
terms of PM2.5)”. This tendency to increase the DpN diameter when increasing PM2.5 concentrations is attributed to condensation of semi-volatile species, being ammonium-nitrate (and OM in MILAN) the component exhibiting the highest increase from “mid”-to-“high” PM2.5 episodes (when the highest DpN increase is observed). These results
ACPD
7, 605–639, 2007Mass, chemistry and number size distribution of urban aerosols S. Rodr´ıguez et al. Title Page Abstract Introduction Conclusions References Tables Figures ◭ ◮ ◭ ◮ Back Close
Full Screen / Esc
Printer-friendly Version
Interactive Discussion indicates that PM2.5 events tend to occur when condensation processes have made
particles grown enough to produce significant concentrations of N>100(nm).
Ultrafine 100 versus PM2.5. Because the very low contribution of ultrafine N10-100 particles to the mass concentration of fine PM2.5 aerosols, N10-N10-100 do not shows a systematic positive or negative correlation with PM2.5. N>100(nm) is the only parti-5
cle size-fraction which exhibits high concentration only during PM2.5 episodes. Events of low PM2.5 and high N10-100 concentrations occur frequently, and these are at-tributed to fresh vehicles emissions and new particle formation by nucleation. These results have important implications on how aerosol pollution is being monitored, since most of observations are based in terms of mass concentrations (PM2.5). This study 10
shows how PM2.5: 1) is mainly weighted by particles >100 nm, which only accounts for <20% of the total number concentration of fine particles, and 2) doesn’t account for the dominant ultrafine N10-100 fraction of urban aerosols (>80% of fine particles). Because vehicles primary emissions mainly occur in the ultrafine fraction, a specific monitoring of the ultrafine aerosols is important.
15
Acknowledgements. The Ministry of Education, Culture and Science of Spain provided the: 1) grant to S. Rodr´ıguez for the stages at the JRC (Italy) and BGS (UK), and 2) project CGL2004-05984 C07-02/CLI that contributed to this study. The OC-BC analysis were performed thank to the support of the J. J. Cao (Chinese Academy of Sciences) and S. C. Lee. (The Hong Kong Polytechnic University). The NOAA-CDC, NOAA-READY, NASA-web-map-viewer products and
20
SKIRON and DREAM Saharan dust transport forecasts contributed to this study. We thank to DIGITEL™Company for their “fast respond” in supporting our sampling.
References
Alastuey, A., Querol, X., Rodr´ıguez, S., Plana, F., Lopez-Soler, A., Ruiz, C., and Mantilla, E.: Monitoring of atmospheric particulate matter around sources of secondary inorganic aerosol,
25
Atmos. Environ., 38, 4979–4992, 2004.
ACPD
7, 605–639, 2007Mass, chemistry and number size distribution of urban aerosols S. Rodr´ıguez et al. Title Page Abstract Introduction Conclusions References Tables Figures ◭ ◮ ◭ ◮ Back Close
Full Screen / Esc
Printer-friendly Version
Interactive Discussion Robinson, A. L.: Mass size distributions and size resolved chemical composition of fine
particulate matter at the Pittsburgh supersite, Atmos. Environ., 38, 3127–3141, 2004. Cao, J. J. Lee, S. C., Ho, K. F., Zou, S. C., Fung, K., Li, Y., Watson, J. G., and Chow, J. C.:
Spatial and seasonal variations of atmospheric organic carbon and elemental carbon in Pearl River Delta Region, China, Atmos. Environ., 38, 4447–4456, 2004.
5
G ¨otschi, T., Hazenkamp-von Arx, M. E., Heinrichc, J., Bono, R., Burney, P., Forsberg, B., Jarvis, D., Maldonado, J., Norb ¨ach, D., Stern, W. B., Sunyer, J., Tor ´en, K., Verlato, G., Simona, V., and K ¨unzl, N.: Elemental composition and reflectance of ambient fine particles at 21 European locations, Atmos. Environ., 39, 5947–5958, 2005.
Harrison, R. M. and Jones, A. M.: Multisite study of particle number concentrations in urban
10
air, Environ. Sci. Technol., 39, 6063–6070, 2005.
IPCC: Climate Change 2001: The Scientific Basis. Cambridge University Press, 2001.
Janson, R., Rosman, K., Karlsson, A., and Hansson, H. C.: Biogenic emissions and gaseous precursors to forest aerosols, Tell. Ser. B, Chem. Phys. Meteorol., 53, 423–440, 2001. Jung, J. G., Adams, P. J., and Pandis, S. N.: Simulating the size distribution and chemical
15
composition of ultrafine particles during nucleation events, Atmos. Environ., 40, 2248–2259, 2006.
Kittelson, D. B., Watts, W. F., and Johnson, J. P.: Nanoparticle emissions on Minnesota high-ways, Atmos. Environ., 38, 9–19, 2004.
Laakso, L., Hussein, T., Aarnio, P., Komppula, M., Hiltunen, V., Viisanen, Y., and Kulmala, M.:
20
Diurnal and annual characteristics of particle mass and number concentrations in urban, rural and Arctic environments in Finland, Atmos. Environ., 37, 2629–2641, 2003.
Mill ´an, M. M., Sanz, M. J., Salvador, R., and Mantilla, E.: Atmospheric dynamics and ozone cycles related to nitrogen deposition in the western Mediterranean, Environ. Pollut., 118, 167–186, 2002.
25
Putaud, J. P., Raes, F., Dingenen, R. V., et al.: A European Aerosol Phenomenology. 2: physical characteristics of particulate matter at kerbside, urban, rural and background sites in Europe, Atmos. Environ., 38, 2579–2595, 2004.
Querol, X., Alastuey, A., Rodriguez, S., Plana, F., Ruiz, C. R., Cots, N., Massague, G., and Puig, O.: PM10 and PM2.5 source apportionment in the Barcelona Metropolitan area, Catalonia,
30
Spain, Atmos. Environ., 35, 6407–6419, 2001.
Querol, X., Alastuey, A., Ruiz, C.R., Art´ı˜nano, B., Hansson, H. C., Harrison, R. M., Buringh, E., ten Brink, H. M., Lutz, M., Bruckmann, P., Straehl, P., and Schneide, J.. Speciation and origin
ACPD
7, 605–639, 2007Mass, chemistry and number size distribution of urban aerosols S. Rodr´ıguez et al. Title Page Abstract Introduction Conclusions References Tables Figures ◭ ◮ ◭ ◮ Back Close
Full Screen / Esc
Printer-friendly Version
Interactive Discussion of PM10 and PM2.5 in selected European cities, Atmos. Environ., 38, 6547–6555, 2004.
Rodr´ıguez, S., Van Dingenen, R., Putaud, J. P., Martins-Dos Santos, S., and Roselli, D.: Nu-cleation and growth of new particles in the rural atmosphere of Northern Italy – Relationship to Air Quality Monitoring, Atmos. Environ., 39, 6734–6746, 2005.
Rodr´ıguez, S., Querol, X., Alastuey, A., and de la Rosa, J.: Atmospheric particulate matter and
5
air quality in the Mediterranean: a review, Environ. Chem. Lett., doi:10.1007/s10311-006-0071-0, in press, 2007.
Ruuskanen, J., Tuch, Th., Ten Brink, H., Peters, A., Khlystov, A., Mirme, A., Kos, G. P. A., Brunekreef, B., Wichmann, H. E., Buzorius, G., Vallius, M., Kreyling, W. G., and Pekkanen, J.: Concentrations of ultrafine, fine and PM2.5 particles in three European cities, Atmos.
10
Environ., 35, 3729–3738, 2001.
Sun, Q., Wang, A., Jin, X., Natanzon, A., Duquaine, D., Brook, R. D., Aguinaldo, J. G. S., Fayad, Z. A., Fuster, V., Lippman, M., Chen, L. C., and Rajagopalan, S.: Long-term Air Pollution Ex-posure and Acceleration of Atherosclerosis and Vascular Inflammation in an Animal Model. JAMA 294, 23 3003–3010, 2005.
15
Van Dingenen, R. V., Raes, F., Putaud, J. P., et al.: A European Aerosol Phenomenology. 1: physical characteristics of particulate matter at kerbside, urban, rural and background sites in Europe, Atmos. Environ., 38, 2561–2577, 2004.
Weber, R. J., Orsini, D., Daun, Y., Lee, Y. N., Klotz, P. J., and Brechtel, F.: A particle-into- liquid collector for rapid measurement of aerosol bulk chemical composition, Aerosol Sci. Technol.,
20
35, 718–727, 2001.
Wehner, B., Birmili, W., Gnauk, T., and Widensohler, A.: Particle number size distributions in a street canyon and their transformation into the urban-air background: measurements and a simple model study, Atmos. Environ., 36, 2215–2223, 2002.
Wehner, B. and Widensohler, A.: Long term measurements of submicron urban aerosols:
25
statistical analysis for correlations with meteorological conditions and trace gases, Atmos. Chem. Phys., 3, 867–879, 2003,
http://www.atmos-chem-phys.net/3/867/2003/.
Wichmann, H. E., Spix, C., Tuch, T., W ¨olke, G., Peters, A., Heinrich, J., Kreyling, G., and Heyder, J.: Daily mortality and fine and ultrafine particles in Erfurt, Germany. Part-I: Role
30
of particle number and particle mass. Health Effects Institute, Research Report, number 98, November 2000, 2000.
ACPD
7, 605–639, 2007Mass, chemistry and number size distribution of urban aerosols S. Rodr´ıguez et al. Title Page Abstract Introduction Conclusions References Tables Figures ◭ ◮ ◭ ◮ Back Close
Full Screen / Esc
Printer-friendly Version
Interactive Discussion
Table 1. Aerosol number (N) and mass (PM2.5) concentrations statistic at Milan
(Novem-ber 2003–Decem(Novem-ber 2004), Barcelona (Novem(Novem-ber 2003–Decem(Novem-ber 2004) and London (April 2004–April 2005 for PM2.5 and January–December 2003). DpN, DpS, DpV: mode of the num-ber, surface and volume size distribution. m1: mode of the mean size distribution, m2 and med.: mean and median of all hourly values of the size distribution modes. ND: number of daily mean data used for the calculations. 1PM2.5: values calculated from sampling on filter (1day every 4-days),2PM2.5: values computed from continuous measurements after correcting for gravimetric equivalence.
Milan Barcelona London
N cm−3 % cm−3 % cm−3 % 10–800 25833 16811 10–415 25676 99 16759 99 11 409 10–20 2455 10 1941 12 1348 12 20–30 4145 16 3386 20 1986 17 30–50 5634 22 3988 24 2693 24 50–100 8365 32 5093 30 3302 29 100–200 3795 15 1855 11 1601 14 200–415 1283 5 496 3 475 4 415–800 157 <1 49 <1
nm m1 m2 med m1 m2 med m1 m2 med
DpN 36 47 41 36 39 36 38 50 43
DpS 233 213 179 179 178 179 198 228 198
DpV 309 340 309 309 294 309 437 355 379
µg/m3 ND mean 90th ND mean 90th ND mean 90th
1
PM2.5 96 47 87 94 34 55 63 31 45
2
ACPD
7, 605–639, 2007Mass, chemistry and number size distribution of urban aerosols S. Rodr´ıguez et al. Title Page Abstract Introduction Conclusions References Tables Figures ◭ ◮ ◭ ◮ Back Close
Full Screen / Esc
Printer-friendly Version
Interactive Discussion
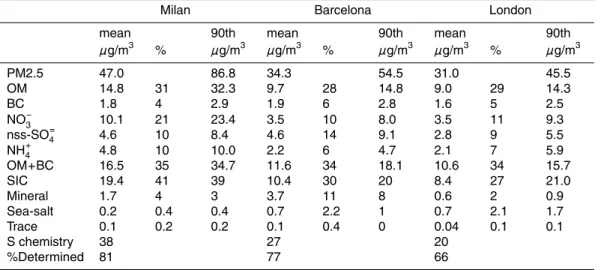
Table 2. Statistic of PM2.5 composition based on 96, 94 and 65 samples collected in Milan,
Barcelona and London from December 2003 to December 2004, December 2003 to December 2004, and April 2004 to April 2005, respectively. Trace elements: sum of Zn, V, Cr, Co, Ni, Cu, As, Cd and Pb.
Milan Barcelona London
mean 90th mean 90th mean 90th
µg/m3 % µg/m3 µg/m3 % µg/m3 µg/m3 % µg/m3 PM2.5 47.0 86.8 34.3 54.5 31.0 45.5 OM 14.8 31 32.3 9.7 28 14.8 9.0 29 14.3 BC 1.8 4 2.9 1.9 6 2.8 1.6 5 2.5 NO− 3 10.1 21 23.4 3.5 10 8.0 3.5 11 9.3 nss-SO=4 4.6 10 8.4 4.6 14 9.1 2.8 9 5.5 NH+4 4.8 10 10.0 2.2 6 4.7 2.1 7 5.9 OM+BC 16.5 35 34.7 11.6 34 18.1 10.6 34 15.7 SIC 19.4 41 39 10.4 30 20 8.4 27 21.0 Mineral 1.7 4 3 3.7 11 8 0.6 2 0.9 Sea-salt 0.2 0.4 0.4 0.7 2.2 1 0.7 2.1 1.7 Trace 0.1 0.2 0.2 0.1 0.4 0 0.04 0.1 0.1 S chemistry 38 27 20 %Determined 81 77 66
ACPD
7, 605–639, 2007Mass, chemistry and number size distribution of urban aerosols S. Rodr´ıguez et al. Title Page Abstract Introduction Conclusions References Tables Figures ◭ ◮ ◭ ◮ Back Close
Full Screen / Esc
Printer-friendly Version Interactive Discussion mm / day 30ºN 40ºN 50ºN 60ºN 0º 10ºW 20ºW 10ºE C) Topography 1000mb geopotential height A) Precipitation rate kilometres 0 0.2 0.4 0.6 0.8 1.5 2.0 >3.0 85 105 125 145 meters 7.5 6.0 3.5 5.0 m/s 1.0 1.5 2.0 2.5 3.0 3.5
Surface wind speed
0º 10ºW 20ºW
10ºE 10ºE 0º 10ºW 20ºW 10ºE 0º 10ºW 20ºW
D) B) B M L B M L B M L B M L 0 1000 0 1500 500 m /s LONDON MILAN 3 6 0 m et er s
BOUNDARY LAYER DEPTH
BARCELONA WIND SPEED M J A J A S O N D F M J M J A J A S O N D F M J M J A J A S O N D F M J F1) E1) F3) E3) F2) E2) mm / day 30ºN 40ºN 50ºN 60ºN 0º 10ºW 20ºW 10ºE C) Topography 1000mb geopotential height A) Precipitation rate kilometres 0 0.2 0.4 0.6 0.8 1.5 2.0 >3.0 85 105 125 145 meters 7.5 6.0 3.5 5.0 m/s 1.0 1.5 2.0 2.5 3.0 3.5
Surface wind speed
0º 10ºW 20ºW
10ºE 10ºE 0º 10ºW 20ºW 10ºE 0º 10ºW 20ºW
D) B) B M L B M L B M L B M L 30ºN 40ºN 50ºN 60ºN 0º 10ºW 20ºW 10ºE 0º 10ºW 20ºW 10ºE C) Topography 1000mb geopotential height A) Precipitation rate kilometres 0 0.2 0.4 0.6 0.8 1.5 2.0 >3.0 85 105 125 145 meters 7.5 6.0 3.5 5.0 m/s kilometres 0 0.2 0.4 0.6 0.8 1.5 2.0 >3.0 kilometres 0 0.2 0.4 0.6 0.8 1.5 2.0 >3.0 85 105 125 145 meters 85 105 125 145 meters 7.5 6.0 3.5 5.0 m/s 7.5 6.0 3.5 5.0 m/s 1.0 1.5 2.0 2.5 3.0 3.5
Surface wind speed
0º 10ºW 20ºW
10ºE 0º 10ºW 20ºW
10ºE 10ºE10ºE 0º0º 10ºW10ºW 20ºW20ºW 10ºE10ºE 0º0º 10ºW10ºW 20ºW20ºW
D) B) B M L B M L B M L B M L B M L B M L B M L B M L 0 1000 0 1500 500 m /s LONDON MILAN 3 6 0 m et er s
BOUNDARY LAYER DEPTH
BARCELONA WIND SPEED M J A J A S O N D F M J M J A J A S O N D F M J M J A J A S O N D F M J F1) E1) F3) E3) F2) E2) 0 1000 0 1500 500 m /s LONDON MILAN 3 6 0 m et er s
BOUNDARY LAYER DEPTH BOUNDARY LAYER DEPTH
BARCELONA WIND SPEED WIND SPEED M J A J A S O N D F M J F M A M J J A S O N D J M J A J A S O N D F M J F M A M J J A S O N D J M J A J A S O N D F M J F M A M J J A S O N D J F1) E1) F3) E3) F2) E2)
Figure 1
μ μ μ μFig. 1. Maps of topography and 2000–2005 climatology of several meteorological fields over
Europe (a–d) and daily mean evolution per month during 2004 of the Boundary Layer Depth and in-situ wind speed (e–f) at London (L), Barcelona (B) and Milan (M).
ACPD
7, 605–639, 2007Mass, chemistry and number size distribution of urban aerosols S. Rodr´ıguez et al. Title Page Abstract Introduction Conclusions References Tables Figures ◭ ◮ ◭ ◮ Back Close
Full Screen / Esc
Printer-friendly Version Interactive Discussion dS/dlogD dV/dlogD C) dN/dlogD B) A) μm3·cm-3 cm-3 μm2·cm-3 Diameter, nm Diameter, nm Diameter, nm L O N D O N B A RCE L O N A M IL A N 0 10000 20000 30000 10 100 1000 0 500 1000 10 100 1000 0 25 50 10 100 1000 dS/dlogD dV/dlogD C) dN/dlogD B) A) μm3·cm-3 cm-3 μm2·cm-3 Diameter, nm Diameter, nm Diameter, nm L O N D O N B A RCE L O N A M IL A N L O N D O N L O N D O N B A RCE L O N A B A RCE L O N A M IL A N M IL A N 0 10000 20000 30000 10 100 1000 0 500 1000 10 100 1000 0 25 50 10 100 1000 Figure 2
Fig. 2. Mean size distribution of aerosol number, surface and volume concentrations during the
ACPD
7, 605–639, 2007Mass, chemistry and number size distribution of urban aerosols S. Rodr´ıguez et al. Title Page Abstract Introduction Conclusions References Tables Figures ◭ ◮ ◭ ◮ Back Close
Full Screen / Esc
Printer-friendly Version Interactive Discussion C) 0 15000 0 30000 1500 0 15000 A3) 30 0 30 30 20 70 10000 30 0 2000 0 0 0 60 15 1000 30 50 D p N , n m Sunday
Monday Tuesday Wednesday Thursday Friday Saturday
B2) B3) 60 3000 P M 2. 5, μ g/ m 3 P M 2. 5, μ g/ m 3 BA RC E L O N A L O N D O N M IL A N N O , μ g/ m 3 N O , μ g/ m 3 5·S O 2 cm -3 N 1 0 -41 5 20·N 2 0 0 -4 15 N 10-2 0 LO N D O N BA R C EL O N A N 10-8 0 0 20·N 2 0 0 -4 15 20 0·N 4 15 -8 0 0 c m -3 c m -3 A2) cm -3 N 1 0 -20 4000 0 10000 50000 100 40 60 30000 0 20 2000 B1) A1) 50 P M 2. 5, μ g/ m 3 N O , μ g/ m 3 0 M ILA N N 10-8 0 0 20 ·N 20 0 -4 1 5 15 0·N 4 15 -8 0 0 c m -3 V eh ic le s/ ho u r c m -3 N 10-2 0 C) 0 15000 0 30000 1500 0 15000 A3) 30 0 30 30 20 70 10000 30 0 2000 0 0 0 60 15 1000 30 50 D p N , n m Sunday
Monday Tuesday Wednesday Thursday Friday Saturday
B2) B3) 60 3000 P M 2. 5, μ g/ m 3 P M 2. 5, μ g/ m 3 P M 2. 5, μ g/ m 3 P M 2. 5, μ g/ m 3 BA RC E L O N A L O N D O N M IL A N BA RC E L O N A L O N D O N M IL A N N O , μ g/ m 3 N O , μ g/ m 3 N O , μ g/ m 3 N O , μ g/ m 3 5·S O 2 5·S O 2 cm -3 N 1 0 -41 5 20·N 2 0 0 -4 15 N 10-2 0 LO N D O N BA R C EL O N A N 10-8 0 0 20·N 2 0 0 -4 15 20 0·N 4 15 -8 0 0 N 10-8 0 0 20·N 2 0 0 -4 15 20 0·N 4 15 -8 0 0 c m -3 c m -3 A2) cm -3 N 1 0 -20 4000 0 10000 50000 100 40 60 30000 0 20 2000 B1) A1) 50 P M 2. 5, μ g/ m 3 N O , μ g/ m 3 0 M ILA N N 10-8 0 0 20 ·N 20 0 -4 1 5 15 0·N 4 15 -8 0 0 c m -3 V eh ic le s/ ho u r c m -3 N 10-2 0 4000 0 10000 50000 100 40 60 30000 0 20 2000 B1) A1) 50 P M 2. 5, μ g/ m 3 P M 2. 5, μ g/ m 3 N O , μ g/ m 3 N O , μ g/ m 3 0 M ILA N N 10-8 0 0 20 ·N 20 0 -4 1 5 15 0·N 4 15 -8 0 0 N 10-8 0 0 20 ·N 20 0 -4 1 5 15 0·N 4 15 -8 0 0 c m -3 V eh ic le s/ ho u r c m -3 N 10-2 0 Figure 3
Fig. 3. Hourly mean concentrations of aerosol parameters, gaseous pollutants and road traffic
ACPD
7, 605–639, 2007Mass, chemistry and number size distribution of urban aerosols S. Rodr´ıguez et al. Title Page Abstract Introduction Conclusions References Tables Figures ◭ ◮ ◭ ◮ Back Close
Full Screen / Esc
Printer-friendly Version Interactive Discussion μ μ μ μ 1.0 2.5 1.5 2.0 1.0 2.5 1.5 2.0 N 10-2 0 N 200 -3 00 N 20-30 N30-50 PM 2. 5 N 4 15-80 0 N 100 -200 N 3 00-41 5 N 50-1 0 0 N 10 -100 N >1 00( n m ) B2) A2) B1) A1) daylight / night-background morning-rush / nocturnal-background conc en tr at ion s ra ti o L O N D O N M IL A N B A RCE L O N A N >10(nm ) 1.0 2.5 1.5 2.0 1.0 2.5 1.5 2.0 N 10-2 0 N 200 -3 00 N 20-30 N30-50 PM 2. 5 N 4 15-80 0 N 100 -200 N 3 00-41 5 N 50-1 0 0 N 10 -100 N >1 00( n m ) B2) A2) B1) A1) daylight / night-background morning-rush / nocturnal-background conc en tr at ion s ra ti o L O N D O N M IL A N BA R C E L O N A L O N D O N L O N D O N M IL A N M IL A N B A RCE L O N A B A RCE L O N A N >10(nm )
Figure 4
Fig. 4. “Morning rush hours (06:00–08:00) to nocturnal-background (02:00–05:00)” and
“day-light (06:00–18:00) to night-background (02:00–05:00)” ratios of the aerosol PM2.5 mass and number concentration in several size ranges during working days of the 1-year study period.
ACPD
7, 605–639, 2007Mass, chemistry and number size distribution of urban aerosols S. Rodr´ıguez et al. Title Page Abstract Introduction Conclusions References Tables Figures ◭ ◮ ◭ ◮ Back Close
Full Screen / Esc
Printer-friendly Version Interactive Discussion EGU N 20-30 N 30-50 N 50-100 N 100-200 N 200-300 N 415-800 N 10-20 0.6 0.9 0.3 0.2 1.0 0.6 0.5 1.0 0.75 0.5 1.0 0.75 N10-20 vs. N>10 (nm) vs. C3) N10-100 vs. 0.9 0.3 0.0 0.6 0.9 0.3 0.0 0.6 0.9 0.3 0.0 0.6 0.9 0.3 0.0 0.6 N > 100( n m ) C O NO NO 2 0.9 0.3 0.6 0.9 0.3 0.6 0.9 0.3 0.6 0.9 0.3 0.6 S O 2 P M 2 .5 N 10-100 PM2.5 vs. C1) C2) A3) A1) A2) D3) D1) D2) B3) B1) B2) co rr el at io n c o ef fi ci en t L O N D O N M IL A N BA R C E L O N A N 300-415 N > 10( n m ) N 20-30 N 30-50 N 50-100 N 100-200 N 200-300 N 415-800 N 10-20 0.6 0.9 0.3 0.2 1.0 0.6 0.5 1.0 0.75 0.5 1.0 0.75 N10-20 vs. N>10 (nm) vs. C3) N10-100 vs. 0.9 0.3 0.0 0.6 0.9 0.3 0.0 0.6 0.9 0.3 0.0 0.6 0.9 0.3 0.0 0.6 N > 100( n m ) C O NO NO 2 0.9 0.3 0.6 0.9 0.3 0.6 0.9 0.3 0.6 0.9 0.3 0.6 S O 2 P M 2 .5 N 10-100 PM2.5 vs. C1) C2) A3) A1) A2) D3) D1) D2) B3) B1) B2) co rr el at io n c o ef fi ci en t L O N D O N M IL A N B A R C E L O N A L O N D O N L O N D O N M IL A N M IL A N BA R C E L O N A BA R C E L O N A N 300-415 N > 10( n m ) Figure 5 μ μμμ
Fig. 5. Correlation coefficient between the weekly cycles (Monday to Sunday daily cycles)
of “PM2.5, N10-20, N10-100 and N>10(nm)” and those of “the aerosol PM2.5 mass, number concentrations (in several size ranges) and gases”.
ACPD
7, 605–639, 2007Mass, chemistry and number size distribution of urban aerosols S. Rodr´ıguez et al. Title Page Abstract Introduction Conclusions References Tables Figures ◭ ◮ ◭ ◮ Back Close
Full Screen / Esc
Printer-friendly Version Interactive Discussion 50 150 50 LONDON BARCELONA MILAN 25 0 75 20 μ g/ m 3 50 0 μ g/ m 3 75 25 0 25 μ g/ m 3 0 10 μ g/ m 3 J FMAMJJ ASOND D DJ FMAMJ JASOND 2004 2004 nss-SO4= BC NH4+ NO3 -OM mineral dust PM2.5 A3) A2) A1) B3) B2) B1) C3) C2) C1) D3) D2)
D1) African dust African dust
J F N O S A J J M A D M 2005 2004
200 MILAN BARCELONA LONDON
0 μ g/ m 3 J FMAMJ J AS OND 2003 N>10(nm) E3) E2) 100 E1) 100000 0 50000 nm PM2.5 DpN 40000 30000 15000 N>100(nm) 0 150 40000 0 20000 20000 N50-100 (nm) 0 0 50 100 J FMAMJ J ASOND 2004 J FMAMJ J AS OND 2004 c m -3 cm -3 cm -3 cm -3 J3) J1) J2) N10-50 (nm) F3) F1) F2) G3) G1) G2) H3) H1) H2) I3) I1) I2) 1.8 1.2 w/s= 1.0 5.5 2.6 0.7 6.3 1.5 1.2 7.8 1.8 w/s= 1.3 w/s= 2.4 3.1 1.3 1.3 1.3 1.3 0.7 1.2 w/s= 1.8 1.4 1.5 1.3 w/s= 1.9 2.2 1.3 1.5 w/s= 1.0 w/s= 1.6 w/s= 1.6 1.3 2.0 w/s= 2.1 1.3 1.3 w/s= 0.7 1.1 1.3 50 150 50 LONDON BARCELONA MILAN 25 0 75 20 μ g/ m 3 50 0 μ g/ m 3 75 25 0 25 μ g/ m 3 0 10 μ g/ m 3 J FMAMJJ ASOND D DJ FMAMJ JASOND 2004 2004 nss-SO4= BC NH4+ NO3 -OM mineral dust PM2.5 A3) A2) A1) B3) B2) B1) C3) C2) C1) D3) D2)
D1) African dust African dust
J F N O S A J J M A D M 2005 2004 50 150 50 LONDON BARCELONA MILAN 25 0 75 20 μ g/ m 3 50 0 μ g/ m 3 75 25 0 25 μ g/ m 3 0 10 μ g/ m 3 J FMAMJJ ASOND D J FMAMJJ ASOND D D J FDJ FMMAAMMJJ JJAASSOONNDD 2004 2004 nss-SO4= BC NH4+ NO3 -OM mineral dust PM2.5 A3) A2) A1) B3) B2) B1) C3) C2) C1) D3) D2)
D1) African dust African dust
J F N O S A J J M A D M 2005 2004J JAS ON J F M A D M 2005 2004
200 MILAN BARCELONA LONDON
0 μ g/ m 3 J FMAMJ J AS OND 2003 J FMAMJ J AS OND 2003 N>10(nm) E3) E2) 100 E1) 100000 0 50000 nm PM2.5 DpN 40000 30000 15000 N>100(nm) 0 150 40000 0 20000 20000 N50-100 (nm) 0 0 50 100 J FMAMJ J ASOND 2004 J FMAMJ J ASOND 2004 J FMAMJ J AS OND 2004 J FMAMJ J AS OND 2004 c m -3 cm -3 cm -3 cm -3 J3) J1) J2) N10-50 (nm) F3) F1) F2) G3) G1) G2) H3) H1) H2) I3) I1) I2) 1.8 1.2 w/s= 1.0 5.5 2.6 0.7 6.3 1.5 1.2 7.8 1.8 w/s= 1.3 w/s= 2.4 3.1 1.3 1.3 1.3 1.3 0.7 1.2 w/s= 1.8 1.4 1.5 1.3 w/s= 1.9 2.2 1.3 1.5 w/s= 1.0 w/s= 1.6 w/s= 1.6 1.3 2.0 w/s= 2.1 1.3 1.3 w/s= 0.7 1.1 1.3 Figure 6
Fig. 6. Daily mean concentrations of PM2.5 and including its major contributors (a–d) and
hourly mean concentrations of PM2.5 and the aerosol-number concentration in several size ranges (e–j). w/s = mean winter (November–February)/summer (May–August) concentrations