HAL Id: hal-01703558
https://hal.archives-ouvertes.fr/hal-01703558
Submitted on 11 Nov 2020
HAL is a multi-disciplinary open access
archive for the deposit and dissemination of
sci-entific research documents, whether they are
pub-lished or not. The documents may come from
teaching and research institutions in France or
abroad, or from public or private research centers.
L’archive ouverte pluridisciplinaire HAL, est
destinée au dépôt et à la diffusion de documents
scientifiques de niveau recherche, publiés ou non,
émanant des établissements d’enseignement et de
recherche français ou étrangers, des laboratoires
publics ou privés.
Spotting high-z molecular absorbers using neutral
carbon: Results from a complete spectroscopic survey
with the VLT
P. Noterdaeme, C. Ledoux, S. Zou, P. Petitjean, R. Srianand, S. Balashev, S.
López
To cite this version:
P. Noterdaeme, C. Ledoux, S. Zou, P. Petitjean, R. Srianand, et al.. Spotting high-z molecular
absorbers using neutral carbon: Results from a complete spectroscopic survey with the VLT.
As-tron.Astrophys., 2018, 612, pp.A58. �10.1051/0004-6361/201732266�. �hal-01703558�
Astronomy
&
Astrophysics
https://doi.org/10.1051/0004-6361/201732266© ESO 2018
Spotting high-z molecular absorbers using neutral carbon
Results from a complete spectroscopic survey with the VLT
?
P. Noterdaeme
1, C. Ledoux
2, S. Zou
1, P. Petitjean
1, R. Srianand
3, S. Balashev
4, and S. López
51 Institut d’Astrophysique de Paris, CNRS-UPMC, UMR7095, 98bis boulevard Arago, 75014 Paris, France
e-mail: noterdaeme@iap.fr
2 European Southern Observatory, Alonso de Córdova 3107, Vitacura, Casilla 19001, Santiago 19, Chile 3 Inter-University Centre for Astronomy and Astrophysics, Post Bag 4, Ganeshkhind, 411007 Pune, India 4 Ioffe Institute, Polyteknicheskaya 26, 194021 Saint-Petersburg, Russia
5 Departamento de Astronomía, Universidad de Chile, Casilla 36-D, Santiago, Chile
Received 9 November 2017 / Accepted 22 January 2018
ABSTRACT
While molecular quasar absorption systems provide unique probes of the physical and chemical properties of the gas as well as original constraints on fundamental physics and cosmology, their detection remains challenging. Here we present the results from a complete survey for molecular gas in thirty-nine absorption systems selected solely upon the detection of neutral carbon lines in Sloan Digital Sky Survey (SDSS) spectra, without any prior knowledge of the atomic or molecular gas content. H2 is found in all twelve
systems (including seven new detections) where the corresponding lines are covered by the instrument setups and measured to have log N(H2)& 18, indicating a self-shielded regime. We also report seven CO detections (7/39) down to log N(CO) ∼ 13.5, including a
new one, and put stringent constraints on N(CO) for the remaining 32 systems. N(CO) and N(CI) are found to be strongly correlated with N(CO)/N(CI) ∼ 1/10. This suggests that the CI-selected absorber population is probing gas deeper than the HI–H2transition in
which a substantial fraction of the total hydrogen in the cloud is in the form of H2. We conclude that targeting CI-bearing absorbers is a
very efficient way to find high-metallicity molecular absorbers. However, probing the molecular content in lower-metallicity regimes as well as high-column-density neutral gas remains to be undertaken to unravel the processes of gas conversion in normal high-z galaxies. Key words. ISM: molecules – quasars: absorption lines
1. Introduction
The detection and analysis of molecular absorption lines along the lines of sight to background light sources has proven to be an extremely useful tool to investigate the physical and chemi-cal state of the interstellar medium (ISM) thanks to the sensitive formation, destruction, and excitation processes of molecules. Such a technique applies from the solar neighbourhood towards nearby stars (e.g.Savage et al. 1977;Boissé et al. 2013) to the gas in and around high-redshift galaxies revealed by damped Lyman-α systems (DLAs; e.g.Levshakov et al. 1989;Ge et al.
1997; Petitjean et al. 2000; Cui et al. 2005; Srianand et al.
2005;Noterdaeme et al. 2008; Jorgenson et al. 2010;Carswell
et al. 2011;Balashev et al. 2017). In addition, the detection of molecular species at high-redshift provides original and sensi-tive probes of fundamental physics and cosmology. Tiny shifts in the relative wavelengths of H2 Lyman and Werner lines can
be used to constrain the possible space-time variation of the proton-to-electron mass ratio down to a few parts-per-million over a timescale of Gyrs (seeUbachs et al. 2016, and references therein). The excitation of CO rotational levels, in turn, provides one of the best thermometers for measuring the temperature of
?Based on observations and archival data from the European
South-ern Observatory (ESO) prog. IDs 060.A-9024, 072.A-0346, 278.A-5062, 080.A-0482, 080.A-0795, 081.A-0242, 081.A-0334, 082.A-0544, 082.A-0569, 083.A-0454, 084.A-0699, 086.A-0074 and 086.A-0643 using the Ultraviolet and Visual Echelle Spectrograph (UVES) and X-shooter at the Very Large Telescope (VLT), on Cerro Paranal, Chile.
the cosmic microwave background (CMB) radiation at high red-shift (Srianand et al. 2008;Noterdaeme et al. 2011). Last but not least, the molecular phase of the ISM makes the link between the gas accreted onto a galaxy and its gravitational collapse that gives birth to stars. However, the small number of known molec-ular absorbers contrasts with the huge number of DLAs detected so far (e.g.Prochaska et al. 2005;Noterdaeme et al. 2012): only about 25 confirmed high-redshift H2-bearing DLAs have been
reported to date (seeBalashev et al. 2017and references therein), highlighting the small covering factor of the molecular gas and the need for efficient selection techniques.
In the local ISM, early works using Copernicus showed that H2and neutral carbon (CI) were frequently observed in the same
absorption systems (e.g.Liszt 1981). Despite the high abundance of carbon, it is usually found in ionised forms in high-redshift DLAs and the neutral carbon is seen only in a small fraction of DLAs that also show H2absorption (e.g.Ge et al. 2001;Srianand
et al. 2005). This is likely due to the first ionisation potential of carbon (11.26 eV) being close to the energy of Lyman-Werner photons that lead to H2dissociation (through Solomon process,
see e.g. Stecher & Williams 1967). CI also conveniently pro-duces absorption lines out of the Lyman-α forest that can be identified even at low spectral resolution. We have therefore per-formed the first blind survey for neutral carbon lines in quasar spectra from the Sloan Digital Sky Survey (SDSS;Ledoux et al. 2015), without any prior knowledge of the associated atomic and molecular content. The 66 CI candidates constitute our parent sample. We report here on the complete follow up of this sample
A58, page 1 of6
A&A 612, A58 (2018)
with the Ultraviolet and Visual Echelle Spectrograph (UVES) at a resolving power R ∼ 50 000 and the X-shooter spectrograph (R ∼ 5000) at the Very Large Telescope (VLT).
2. Observations and results
We obtained spectra for almost all systems that are observable from Paranal Observatory, that is, a sample of thirty nine con-firmed CI absorbers. Details about the observing procedures, data reduction, and metal line measurements are presented in Ledoux et al. (in prep.). A near-infrared study of the NaI and CaIIlines as well as the dust extinction properties are presented
inZou et al.(2018). Here, we focus on the detection of H2and
CO. Wavelengths and oscillator strengths for H2 and CO lines
are from the compilations ofMalec et al.(2010) andDaprà et al. (2016), respectively.
2.1. Molecular hydrogen
We detect H2 absorption lines whenever covered by our
spec-tra (twelve systems). Five of these are already reported in the literature (Noterdaeme et al. 2007,2010;Srianand et al. 2008;
Jorgenson et al. 2010; Klimenko et al. 2016), from which we
have taken the H2 column densities, and seven are new
detec-tions. We estimated the total H2 column densities for the new
detections through Voigt-profile fitting, focusing on the low rota-tional levels that contain most of the H2. We note that while the
velocity profile of singly ionised metals is wide with a large num-ber of components, we detect H2only at velocities where CIis
also detected. Below we comment on each system, in order of increasing right ascension of the background quasar.
J091721+015448, zabs = 2.107: this system was observed
with X-shooter at a spectral resolution of ∼60 km s−1. We obtain an accurate measurement of the total H2column density thanks
to the damping wings that are seen for the low rotational levels in the four bands covered by our spectrum (see Fig.1) and obtain log N(H2)= 20.11 ± 0.06.
J111756+143716, zabs= 2.001: this system is characterised by
two narrow H2components seen in the UVES spectrum (Fig.2)
in different rotational levels. These components also correspond to those seen in the neutral carbon lines. While our best-fit value is found to be around log N(H2) ∼ 18, we note that the data
quality is poor and that only one band is covered, making it impossible to assess the presence of blends. In addition, at such a column density, the absorption is in the logarithmic part of the curve of growth. We are therefore unable to associate an uncer-tainty to this measurement that we display with a large arbitrary (albeit quite conservative) 1 dex error bar in Fig.9.
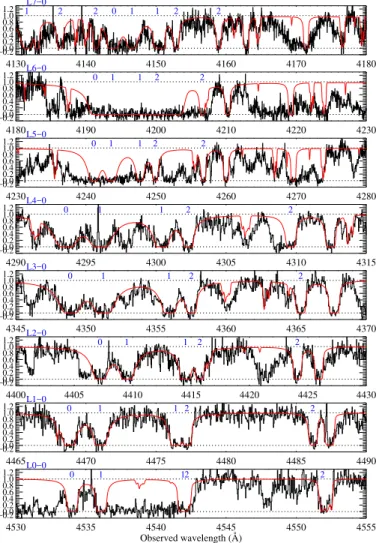
J131129+222552, zabs= 3.092: thanks to the high absorption
redshift, no less than twenty Lyman and Werner H2 bands are
covered by our UVES spectrum, shown in Fig.3. Four compo-nents can be distinguished in the high rotational levels but lines from the J= 0 and J = 1 rotational levels are strongly damped and therefore modelled using a single component. The damping wings together with the large number of detected transitions and the achieved high signal-to-noise ratio (S/N) values allow for a very precise measurement of the total H2column density which
we found to be log N(H2)= 19.69 ± 0.01.
J164610+232922, zabs= 1.998: while the S/N of our UVES
spectrum in the region of H2lines (see Fig.4) is quite low1, two
1 Although SDSS J164610+232922 is a relatively bright quasar (g=
18.5), only a single 4000 s exposure could be obtained at a high airmass (1.7).
Fig. 1.Selected regions of the X-shooter spectrum of J0917+0154 fea-turing H2 lines. The rotational levels J= 0 to J = 2 are indicated in
blue above their corresponding absorption line and the label above each panel indicates the band they belong to. Higher rotational levels are fitted but not labelled to avoid overcrowding the figure.
Fig. 2.As in Fig.1but for the UVES spectrum of J1117+1437.
narrow H2 components are clearly seen in rotational levels J=
0–3 and our spectrum covers four Lyman bands that span more than an order of magnitude in oscillator strengths. We find a total column density N(H2) ≈ 1018cm−2with a ∼30% uncertainty.
J225719−100104, zabs= 1.836: this system is more complex
with no less than eight H2 components, strongly blended with
each other. Unfortunately, only three Lyman H2bands are
cov-ered by the UVES data (Fig.5), the bluest of which in a region with low S/N. To remove strong degeneracy between parameters, we had to fix the excitation temperature T01to 100 K. While this
is a strong assumption, we note that varying T01 within a factor
of two has little effect on the total column H2density (changes
∼0.1 dex). Still, we caution that this error may be underestimated and covering bluer transitions is required to confirm our column density measurement (log N(H2)= 19.5 ± 0.1).
J233156-090802, zabs = 2.142: in spite of the low S/N
achieved for this system, shown in Fig.6, the data is clearly con-sistent with strongly damped H2 lines at the same redshift as
that of CO lines (see following section). We fitted the J= 0, 1, 2 lines, from which we obtain realistic excitation temperatures, T01 ∼ 140 K and T02 ∼ 180 K. The total H2 column density is
found to be log N(H2)= 20.57 ± 0.05.
J233633-105841, zabs = 1.829: the H2profile in this system
is well modelled by two components, that are partially blended at the X-shooter spectral resolution. The bluest component, how-ever, dominates the total column density, and the measurement is facilitated by the presence of damping wings and the high S/N achieved. We note that the L0–0 band is partially blended with
Fig. 3. As in Fig.1but for the UVES spectrum of J1311+2225. We note that different bands start to overlap which each other at the shortest wavelength. As for other systems, the label indicated at the top left of each panelcorresponds to the band to which the identified rotational levels belong.
unrelated absorption lines, which we modelled when fitting H2
(see Fig.7). We obtain log N(H2)= 19.0 ± 0.12.
2.2. Carbon monoxide
CO is detected in seven systems in our sample, six of them already reported by our group and one being a new detection pre-sented here for the first time. This brings the number of known high-z CO-bearing quasar absorbers to nine2. We measured upper limits on N(CO) for all systems assuming the Doppler parameter to be 1 km s−1, similar to what has been measured in all high-z CO absorbers to date. We also assume the CMB radi-ation to be the main excitradi-ation source in diffuse gas at high-z (as observed bySrianand et al. 2008;Noterdaeme et al. 2011).
We calculated the local (i.e. for each band individually) and global χ2 values for a range of total column densities. CO is detected when the χ2 curves are consistent with each other and
present a clear inflexion point, defining the best-fit value. For non-detections, χ2(N(CO)) is generally monotonic with a
min-imum consistent with that of N(CO) = 0 within uncertainty.
2 The detections towards J1211+0833 (Ma et al. 2015) and J0000+0015
(Noterdaeme et al. 2017) are not formally part of the statistical sample although selected upon their CIcontent.
Fig. 4.As in Fig.1but for the UVES spectrum of J1646+2329.
Fig. 5.As in Fig.1but for the UVES spectrum of J2257−1001.
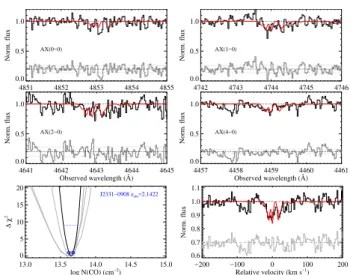
Our 3 σ upper limit corresponds to the column density where the χ2 is 9 above this minimum. With this method, not only do we recover all the known CO absorbers but we also iden-tify the new CO system, at z= 2.143 towards SDSS J2331−0908 (Fig.8), observed by Nestor and collaborators (Prog. ID 080.A-0795). This is only the fourth high-z system with direct and simultaneous measurements of N(CO) and N(H2).
Before discussing our findings, it is worth mentioning that, in the local ISM, the excitation temperature of CO is found to be a few degrees above the CMB temperature (e.g.Burgh et al. 2007), owing to additional excitation processes such as collisions, far-infrared dust emission, and possibly cosmic rays. Relaxing our assumptions we find that the derived CO column density lim-its (as well as the CO column density for the new detection at zabs= 2.143 towards SDSS J2331−0908) are not changed
signif-icantly as the total band equivalent width is almost conserved. For example, allowing an excitation temperature 5 K above the CMB temperature only increases the derived values by less than 0.04 dex.
A&A 612, A58 (2018)
Fig. 6.As in Fig.1but for the UVES spectrum of J2331−0908. The data have been rebinned by 7 pixels for visual purposes only.
Fig. 7. As in Fig.1 but for the X-shooter spectrum of J2336-1058. The green and purple dotted lines in the bottom panel show the con-tribution from unrelated Lyα (from a sub-DLA at zabs = 1.585) and
OVI(zabs= 2.039) absorption, respectively. The contribution from H2
alone is shown in red and the total absorption-line profile is depicted in orange.
3. Discussion
Table 1 summarises the H2 and CO detections and column
density measurements. Figure 9 presents the H2 and CO
col-umn densities as well as the overall molecular fraction h fH2i=
2N(H2)/(2N(H2)+ N(HI)) as a function of N(CI) for our
com-plete sample. Known systems from the literature are also added for comparison but not considered for statistical analysis.
We find that H2 is detected with N(H2) >∼ 1018 cm−2in all
systems with log N(CI) > 13.5. In this regime, H2 is likely to
be self-shielded and the molecular fraction substantial in the H2-bearing gas. We also observe a possible trend for
increas-ing N(H2) with increasing N(CI) (Spearman rank correlation
coefficient r = 0.4, 1.2 σ significance) in our statistical sam-ple, albeit with a large dispersion. We note that systems that were not CI-selected (from literature) seem not to follow this trend. Four of them indeed have N(H2) > 5 × 1019cm−2 in
spite of relatively low CI column density (log N(CI) <∼ 14). This difference is likely due to the different chemical enrich-ments: CI-selected systems probe mostly high-metallicity gas (Zou et al. 2018; Ledoux et al., in prep.) while the four mentioned literature systems all have low metallicities.
Fig. 8. CO AX bands at zabs = 2.1422 towards J2331−0908 (top
four panels, AX(3–0) is not covered by the instrument setup). The bottom-right panelshows a co-addition of the CO bands, using ( f /σ)2
-weighting, where f is the oscillator strength and σ the uncertainty on the normalised flux, for easy visualisation of the detection. The bottom-left panelshows the∆χ2= χ2−χ2
mincurves (grey for individual band,
black for total).
Since the column density at which HIis converted into H2
strongly depends on the chemical properties of the gas, in par-ticular the abundance of dust grains (e.g. Bialy & Sternberg 2016), we can expect less HIin the molecular cloud envelope for high-metallicity systems compared to low-metallicity ones. In addition, contrary to DLAs, CIsystems were selected with-out any prior knowledge of the HIcontent (Ledoux et al. 2015) and should have less contribution from unrelated atomic gas that does not belong to the envelope of the H2 cloud. This is seen
in the bottom panel of Fig.9, where the correlation between h f i and N(CI) is seen with r = 0.6 at 2.1 σ: the average overall H2
molecular fraction is about 15% in our sample (and about 30% when CO is detected) but <3% at log N(CI) < 14.
The correlation between N(CO) and N(CI) for CO detections is strong with r= 0.88 (2.6 σ). From the column density distri-butions, we can see that the probability to detect CO becomes much larger above N(CI) ∼ 5 × 1014cm−2(6/12) than below this
value (1/27). In addition, there is no CO detection among the 18 systems with log N(CI) < 14.4. Since the CO detection limits are significantly below (∼1 dex) the typical N(CO) in the case of detection, this result is robust3. Considering also lower and upper limits on both N(CO) and N(CI), we still find the N(CO)–N(CI) correlation to have ∼92% probability.
This strong correlation is likely due to the strong dependence of CO abundance on the metallicity (through the abundance of carbon, the abundance of dust grains as molecule-formation cat-alyst, and an effective shielding of UV photons). InLedoux et al. (2015), we showed that strong CIsystems produce more redden-ing than other classes of quasar absorbers. We further note that the dust reddening is systematically higher in CO-bearing sys-tems than other H2systems without CO. The relative behaviours
of CO, H2, and CIagree qualitatively with models of ISM clouds
immersed in a UV radiation field: these clouds are expected to
3 We note that N(CO)-limits also tend to be more stringent for
sys-tems with low N(CI). This is likely due to easier detection of small CI
equivalent widths in SDSS towards bright quasars (or that such systems extinguish less the background quasars), for which the follow-up data is also of better quality.
Table 1. CO and H2content of strong CIabsorbers.
Quasar zabs log N (cm−2) Ref.
CI CO H2 J0216−0021 1.737 14.25 ± 0.02 <12.97 – 1 J0300−0721 1.536 >14.77 ≤13.79 – 1 J0811+0838 1.906 13.68 ± 0.13 <13.24 – 1 J0815+2640 1.681 >14.73 <13.68 – 1 J0820+1559 1.547 >14.71 <14.01 – 1 J0852+1935 1.788 15.01 ± 0.12 <13.33 – 1 J0854+0317 1.567 14.23 ± 0.01 <13.11 – 1 J0857+1855 1.730 14.57 ± 0.13 13.54 ± 0.05 – 2 J0917+0154 2.107 14.32 ± 0.06 <14.07 20.11+0.06−0.06 1 J0927+1543 1.731 >14.61 <13.32 – 1 J1047+2057 1.775 >14.90 14.40 ± 0.07 – 2 J1117+1437 2.001 14.40 ± 0.03 <13.13 ∼18 1 J1122+1437 1.554 13.83 ± 0.03 <12.99 – 1 J1129−0237 1.623 >14.96 <13.31 – 1 J1133−0057 1.706 15.12 ± 0.06 ≤14.07 – 1 J1237+0647 2.691 15.01 ± 0.02 14.17 ± 0.09 19.21+0.13−0.12 3 J1248+2848 1.513 14.25 ± 0.10 <13.25 – 1 J1302+2111 1.656 14.30 ± 0.02 <13.48 – 1 J1306+2815 2.012 14.47 ± 0.04 <13.26 – 1 J1311+2225 3.092 14.30 ± 0.02 <13.43 19.69+0.01−0.01 1 J1314+0543 1.583 14.40 ± 0.02 ≤13.77 – 1 J1341+1852 1.544 13.51 ± 0.03 <13.00 – 1 J1346+0644 1.512 14.51 ± 0.02 <13.60 – 1 J1439+1117 2.418 14.81 ± 0.02 13.89 ± 0.02 19.38+0.10 −0.10 4 J1459+0129 1.623 14.32 ± 0.09 <13.57 – 1 J1522+0830 1.627 >14.47 <13.50 – 1 J1603+1701 1.890 13.80 ± 0.10 <12.88 – 1 J1604+2203 1.641 >15.14 14.59 ± 0.11 – 5 J1615+2648 2.118 14.49 ± 0.06 <13.16 – 1 J1623+1355 1.751 14.41 ± 0.07 <13.30 – 1 J1646+2329 1.998 14.32 ± 0.06 <13.40 18.02+0.11−0.11 1 J1705+3543 2.038 >15.01 14.14 ± 0.03 – 2 J2123−0050 2.060 14.11 ± 0.02 <13.07 17.94+0.01−0.01 1,6 J2229+1414 1.586 13.96 ± 0.05 <13.55 – 1 J2257−1001 1.836 14.65 ± 0.01 <13.09 19.5 ± 0.1 1 J2331−0908 2.143 >14.70 13.65 ± 0.03 20.57+0.05−0.05 1 J2336−1058 1.829 14.07 ± 0.02 <12.93 19.00+0.12−0.12 1 J2340−0053 2.054 14.09 ± 0.04 <12.58 18.47+0.04−0.04 1,7 J2350−0052 2.426 14.36 ± 0.01 <12.94 18.52+0.29−0.49 1,8
References. The references listed in the last column are for molecular measurements. When two references are listed, they correspond to CO then H2, in this order. (1) This work; (2)Noterdaeme et al.(2011); (3)
Noterdaeme et al.(2010); (4)Srianand et al.(2008); (5)Noterdaeme et al.(2009); (6)Klimenko et al.(2016); (7)Jorgenson et al.(2010); (8) Noterdaeme et al.(2007). Unless already available from the literature, CIcolumn densities were obtained through the apparent optical depth method.
exhibit an onion-like structure where hydrogen converts from atomic to molecular form when going towards the centre of the cloud. Carbon is predominantly ionised in the external layers, then becomes neutral, while CO is dominant only in the inner dense molecular parts of the cloud (see e.g.Bolatto et al. 2013). Unfortunately, it remains difficult to disentangle the atomic gas that belongs to a molecular cloud envelope and contributes to its shielding from unrelated HI, simply intercepted along the same
Fig. 9.Column densities of CO (top), H2(middle) and overall
molec-ular fractions (bottom) vs N(CI). CO detections are represented by red colours. The N(CI)-distributions and median log N(CO) values (hori-zontal lines) are shown for the statistical sample only (circles). Squares correspond to high-z H2 DLA systems from the literature (Balashev
et al. 2010, 2011,2017;Carswell et al. 2011;Guimarães et al. 2012; Noterdaeme et al. 2015,2017;Petitjean et al. 2002).
line of sight. This means that the measured h f i is a lower limit to the actual H2 molecular fraction in the CI-bearing cloud. Since
CO and CIare only found in shielded gas, their observed abun-dance ratio should be less affected by the presence of unrelated gas. Indeed, we find CO/CI∼ 0.1 for all detections (green dotted line in Fig.9), a value which is also consistent with the non-detections at lower N(CI). This indicates a regime deeper than the layer where the HI–H2transition occurs.
The CO/H2ratio is found to be low (∼[3–9] × 10−6) for three
out of four cases where both these molecules are detected and can be more than an order of magnitude lower in other strong H2
systems, including the new CO detection. Even in these cases, the high N(H2) likely indicates well-molecularized regions.
Sev-eral factors such as the grain size distribution or the intensity of the cosmic-ray field likely play important roles in determining whether CO will be present or not in H2-dominated regions (e.g.
Shaw et al. 2016;Noterdaeme et al. 2017;Bisbas et al. 2017).
Multiple clouds can also easily explain large H2 column
den-sities without significant CO, in a similar way to how multiple HI–H2transition layers explain higher N(HI) than predicted by
single cloud models (Bialy et al. 2017).
We conclude that CI is a very good proxy to spot high-redshift molecular absorbers that can be used for a variety of studies including fundamental physics and cosmology. It is
A&A 612, A58 (2018)
however crucial not only to constrain the physical parameters in individual systems (and hopefully for individual velocity compo-nents separately) but also to explore different metallicity regimes (Balashev et al. 2017) using different selections (e.g.Balashev
et al. 2014) to understand better the molecular structure of ISM
clouds at high redshifts.
Acknowledgements.We thank T. Krühler for help with the X-shooter data reduc-tion. P.N. thanks the European Southern Observatory for hospitality and support during part of this work was done. P.N., P.P.J. and R.S. acknowledge support from the Indo-French Centre for the Promotion of Advanced Research (Project 5504-B). We acknowledge support from the PNCG funded by CNRS/INSU-IN2P3-INP, CEA and CNES, France. This research is part of the project HIH2 funded by the Agence Nationale de la Recherche, under grant ANR-17-CE31-0011-01 (JCJC). S.B. thanks the Institut d’Astrophysique de Paris for hospitality and the Institut Lagrange de Paris for financial support. S.L. has been supported by FONDECYT grant 1140838 and by PFB-06 CATA.
References
Balashev, S. A., Ivanchik, A. V., & Varshalovich, D. A. 2010,Astron. Lett., 36, 761
Balashev, S. A., Petitjean, P., Ivanchik, A. V., et al. 2011,MNRAS, 418, 357 Balashev, S. A., Klimenko, V. V., Ivanchik, A. V., et al. 2014,MNRAS, 440, 225 Balashev, S. A., Noterdaeme, P., Rahmani, H., et al. 2017,MNRAS, 470, 2890 Bialy, S., & Sternberg, A. 2016,ApJ, 822, 83
Bialy, S., Bihr, S., Beuther, H., Henning, T., & Sternberg, A. 2017,ApJ, 835, 126 Bisbas, T. G., van Dishoeck, E. F., Papadopoulos, P. P., et al. 2017,ApJ, 839, 90 Boissé, P., Federman, S. R., Pineau des Forêts, G., & Ritchey, A. M. 2013,A&A,
559, A131
Bolatto, A. D., Wolfire, M., & Leroy, A. K. 2013,ARA&A, 51, 207 Burgh, E. B., France, K., & McCandliss, S. R. 2007,ApJ, 658, 446
Carswell, R. F., Jorgenson, R. A., Wolfe, A. M., & Murphy, M. T. 2011,MNRAS, 411, 2319
Cui, J., Bechtold, J., Ge, J., & Meyer, D. M. 2005,ApJ, 633, 649
Daprà, M., Niu, M. L., Salumbides, E. J., Murphy, M. T., & Ubachs, W. 2016, ApJ, 826, 192
Ge, J., Bechtold, J., & Black, J. H. 1997,ApJ, 474, 67 Ge, J., Bechtold, J., & Kulkarni, V. P. 2001,ApJ, 547, L1
Guimarães, R., Noterdaeme, P., Petitjean, P., et al. 2012,AJ, 143, 147 Jorgenson, R. A., Wolfe, A. M., & Prochaska, J. X. 2010,ApJ, 722, 460 Klimenko, V. V., Balashev, S. A., Ivanchik, A. V., & Varshalovich, D. A. 2016,
Astron. Lett., 42, 137
Ledoux, C., Noterdaeme, P., Petitjean, P., & Srianand, R. 2015,A&A, 580, A8 Levshakov, S. A., Foltz, C. B., Chaffee, F. H., & Black, J. H. 1989,AJ, 98,
2052
Liszt, H. S. 1981,ApJ, 246, L147
Ma, J., Caucal, P., Noterdaeme, P., et al. 2015,MNRAS, 454, 1751 Malec, A. L., Buning, R., Murphy, M. T., et al. 2010,MNRAS, 403, 1541 Noterdaeme, P., Petitjean, P., Srianand, R., Ledoux, C., & Le Petit, F. 2007,A&A,
469, 425
Noterdaeme, P., Petitjean, P., Ledoux, C., Srianand, R., & Ivanchik, A. 2008, A&A, 491, 397
Noterdaeme, P., Petitjean, P., Ledoux, C., & Srianand, R. 2009,A&A, 505, 1087 Noterdaeme, P., Petitjean, P., Ledoux, C., et al. 2010,A&A, 523, A80
Noterdaeme, P., Petitjean, P., Srianand, R., Ledoux, C., & López, S. 2011,A&A, 526, L7
Noterdaeme, P., López, S., Dumont, V., et al. 2012,A&A, 542, L33 Noterdaeme, P., Srianand, R., Rahmani, H., et al. 2015,A&A, 577, A24 Noterdaeme, P., Krogager, J.-K., Balashev, S., et al. 2017,A&A, 597, A82 Petitjean, P., Srianand, R., & Ledoux, C. 2000,A&A, 364, L26
Petitjean, P., Srianand, R., & Ledoux, C. 2002,MNRAS, 332, 383 Prochaska, J. X., Tripp, T. M., & Howk, J. C. 2005,ApJ, 620, L39 Savage, B. D., Bohlin, R. C., Drake, J. F., & Budich, W. 1977,ApJ, 216, 291 Shaw, G., Rawlins, K., & Srianand, R. 2016,MNRAS, 459, 3234
Srianand, R., Petitjean, P., Ledoux, C., Ferland, G., & Shaw, G. 2005,MNRAS, 362, 549
Srianand, R., Noterdaeme, P., Ledoux, C., & Petitjean, P. 2008,A&A, 482, L39 Stecher, T. P., & Williams, D. A. 1967,ApJ, 149, L29
Ubachs, W., Bagdonaite, J., Salumbides, E. J., Murphy, M. T., & Kaper, L. 2016, Rev. Mod. Phys., 88, 021003
Zou, S., Petitjean, P., Noterdaeme, P., et al. 2018, A&A, in press, DOI:10.1051/0004-6361/201732033