HAL Id: hal-00359795
https://hal.archives-ouvertes.fr/hal-00359795
Submitted on 9 Feb 2009
HAL is a multi-disciplinary open access
archive for the deposit and dissemination of sci-entific research documents, whether they are pub-lished or not. The documents may come from teaching and research institutions in France or abroad, or from public or private research centers.
L’archive ouverte pluridisciplinaire HAL, est destinée au dépôt et à la diffusion de documents scientifiques de niveau recherche, publiés ou non, émanant des établissements d’enseignement et de recherche français ou étrangers, des laboratoires publics ou privés.
In-water reflectance spectra measured on-board a jet-ski
across a complex nearshore zone of case-2 waters during
the ECORS experiment
Aurélie Dehouck, Nadège Martiny, Jean-Marie Froidefond, Nadia Sénéchal,
Virginie Lafon, Stéphane Bujan
To cite this version:
Aurélie Dehouck, Nadège Martiny, Jean-Marie Froidefond, Nadia Sénéchal, Virginie Lafon, et al.. In-water reflectance spectra measured on-board a jet-ski across a complex nearshore zone of case-2 In-waters during the ECORS experiment. Ocean Optics XIX, Oct 2008, Barga, Italy. 8 p. �hal-00359795�
In-Water Reflectance Spectra Measured On Board a Jet-Ski Across a Complex
Nearshore Zone of Case-2 Waters during the ECORS Experiment
Aurélie Dehouck , Nadège Martiny, Jean-Marie Froidefond, Nadia Sénéchal
OASU-EPOC, UMR 5805 CNRS, Université de Bordeaux, avenue des facultés, F-33405 Talence, France
1. INTRODUCTION
The ECORS experiment occurred in spring 2008 at Truc Vert Beach along the south-western Atlantic coast of France involving more than an hundred of international oceanographers and plethora of instruments (several arrays of wave sensors and flow meters, sediment sensors, daily topographic surveys of the intertidal beach, nearshore bathymetric surveys, video and satellite imagery). The objective of the experiment is to obtain an exhaustive field dataset that will be used to improve the knowledge of sandy coast behaviour based on wave models and morphodynamic models. High resolution optical satellite images are used to investigate nearshore sand bar dynamics over several kilometres that is not easily feasible, expensive and time-consuming by means of bathymetric surveys or video imagery. Although the temporal resolution is low, Earth observational satellite sensors with a daily revisit frequency (Formosat-2) have proven during this experiment to be efficient to get images despite very bad meteorological conditions.
While qualitative aspects of sand bar mobility (change in shape and cross-shore position relative to the shoreline) could be retrieved through orthorectified images, the bathymetry itself is required to
quantitatively analyze sand bar dynamics (assessment of sand bar location relative to water depth, computation of the volumetric sediment budget, ...).
Empirical and optical models have shown to be relatively accurate methods to retrieve bathymetry but both need in situ optical data to be calibrated (Lee et al., 1998; Lafon et al., 2002) and then applied to satellite images. To that purpose, an exclusive dataset has been obtained composed of synchronous near-surface irradiance and radiance measurements, bathymetric soundings and a Formosat-2 satellite image. The main aims of this paper are to analyze reflectance spectra collected in a complex coastal zone of moderately turbid waters and to test inversion algorithms for mapping bathymetry.
2. FIELD SITE
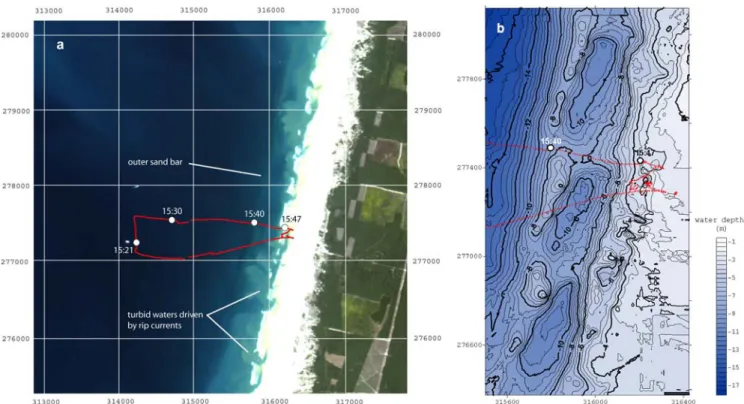
The Truc Vert Beach is a wide and high-energy sandy beach (figure 1a) with a meso-macrotidal range, located a few kilometers north of the Cap Ferret peninsula and of the inlet of the Arcachon Lagoon and 50 kms south the inlet of the Gironde estuary (SW France). The beach is characterized by a double sand bar system which morphodynamics is driven by wave-induced flow motions and feedbacks between the topography and hydrodynamics (Castelle et al., 2007).While the inner sandbar is often emerged at low tide and may be studied with traditional topographic means, the outer sandbar develop an interesting rhythmic (crescentic) pattern in shallow waters at depths of 2-6 m below the Lowest Astronomical Tidal Level. In addition to this complex bathymetry owing to shallow submerged sand banks, the shoaling and breaking of waves as well as the activity of strong rip currents in the surf zone are redhibitory to allow the access of coastal vessels in the area of interest so close to the beach.
Figure 1. (a) Formosat-2 satellite image of Truc Vert Beach on April 5, 2008 (@Kalideos Littoral – CNES), coordinates relative to the Lambert 3 national datum, the jet-ski trajectory during the field hyperspectral experiment is in red and location of the water samples are symbolized by the white circles; (b) bathymetric chart with water depth in meter relative to a reference level (+4.1 m above
the Lowest Astronomical Tidal Level during the hyperspectral survey).
3. DATA AND METHODS
3.1. BATHYMETRIC DATA
Extensive nearshore bathymetric surveys were performed twice during the experiment by the
hydrographic vessels of the SHOM (Hydrographic and Oceanographic Department of the French Navy) and several times by the jet-ski but with a lesser coverage (University of Bordeaux and Delft
University). The survey of April 4-5, 2008 concerns the nearshore zone from water depths of -25 m to +2 m relative to the lowest astronomical tidal level and a shoreline section of about 3 km long. The upper part of the beach from +2 m to +6 m was surveyed using a quad. In this paper, only the jet-ski bathymetric data are used until a depth of -12 m (figure 1b) as the extensive nearshore survey was not available yet.
3.2. SATELLITE DATA SET
During the experiment that lasted 6 weeks, 4 high-resolution satellite scenes were obtained by SPOT-4 and FORMOSAT-2 optical sensors and were integrated into the « Kalideos Littoral » database of the French Space Center (CNES). The FORMOSAT-2 scene of April 5, 2008 was downloaded at the 1A level for free on the web at http://kalideos.cnes.fr (provided research work to be done with it). The acquisition time was 10h38 UT that is nearly one hour after the spring low tide level (+0.66 m above the lowest astronomical tidal level). The image was georectified using ENVI software (figure 1a) and a
high-resolution aerial orthophoto of the Arcachon region (Ortholittorale 2000, IGN) as a reference for ground control points.
3.3. IN SITU REFLECTANCE MEASUREMENTS
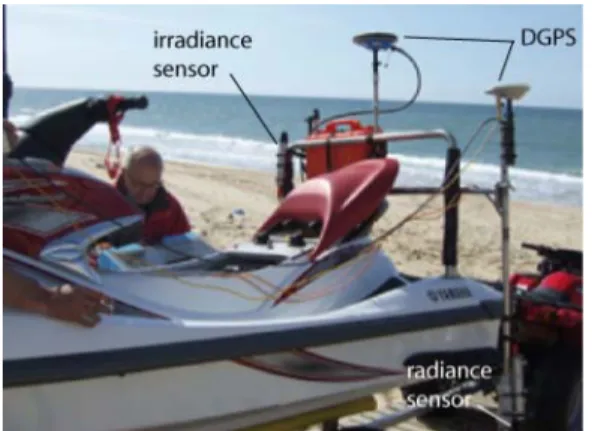
Hyperspectral measurements of the above-water downwelling irradiance (Ed+) and underwater
upwelling radiance (Lu’,z) in the visible and near infrared range (350-950 nm) were performed together
on-board a jet-ski with 2 TriOS Ramses sensors moored on a vertical pole at the rear (figure 2). The survey took place under low-energy swell conditions (Hs=0.5 m) and after several weeks of very
energetic swells (Hs > 7 m). The jet-ski is a valuable mean to collect near-surface hyperspectral data in
shallow waters and in an oceanic environment rough enough to do not allow the deployment of traditional platforms from coastal vessels. The downward-looking radiance sensor was submerged 10 to 50 cm below the water surface depending upon the deformation of the water surface due to wind and waves. Optical data were collected at a continuous sampling frequency of 2 Hz on April 5 during one hour (15-16h UT, zenithal sun angle θs=54°) at high tide level (+4 m) and during permanent blue sky
conditions. The jet-ski trajectory (figure 1a) was recorded every 5 s using a Garmin GPS (positioning accurate at ± 5 m). The survey extended over 2 kms offshore and 600 m alongshore covering water depths of 3-25 m. This area encompasses a section of the outer crescentic sandbar with crest and horns located in water depth of 6-8 m (shown on figure 1b by light colors) and the runnel located shoreward in water depth of 10.5 m.
Figure 2. Sensor deployment on board the jet-ski during the hyperspectral field experiment on April 5, 2008
Raw data gather more than 2000 radiance and irradiance spectra that were pre-processed using IDL to remove spectra collected while radiance sensor was out of water (at the departure and arrival of the jet-ski on the beach) and those where above-water irradiance was affected by shadow effects (people getting up on the jet-ski during water samples). From the remaining 1350 Lu’,z and Ed+ spectra, only the
560 spectra collected with a low inclination angle (<20°) were selected and computed as reflectance spectra as the ratio of the measured radiance at depth z over the downwelling irradiance (ris= Lu’,z/Ed+).
Note that remote sensing reflectances (Rrs=Lw/Ed+) need to be computed according to expressions [1],
[2] and [3] to be properly compared to other reflectance measurements collected in the inlets of the Arcachon Lagoon and of the Gironde estuary (Lafon et al., 2002; Doxaran et al., 2002). Based on these former observations, the quality and representativeness of the present dataset are discussed in a
The measured upwelling radiances (Lu’(z)) were corrected by applying the immersion factors (Fi) found
in the literature for the TriOS Ramses sensors (Ohde and Siegel, 2003) (equation [1]) and then related to the water surface (Lu(0-)) using the relationship [2] (Fargion and Mueller, 2000). The immersion
depth of the radiance sensor z is known as it is automatically recorded during the survey. As it was not measured on the field, the vertically averaged diffuse attenuation coefficient for upwelling radiance (Ku) was set at 0.2 m-1 , value taken by Lafon et al. (2002) to compute realistic bathymetric maps of the
inlet of the Arcachon Lagoon in an environment very similar to the oceanic beaches (sandy seabed, same range of SPM concentrations).
) z (' u i ) z ( u F .L L = [1] ) z K ( exp L Lu(0−) = u(z) u [2] ) 0 ( u w 0.544L L = − [3]
In order to investigate the influence of bottom on reflectance, water depth was associated to each measured reflectance spectrum. This was done in 2 steps: (1) searching for the bathymetric sounding related to each point of the trajectory thus transforming the initial trajectory file (time, x, y coordinates) into a bathymetric-trajectory file (time, x, y coordinates, water depth z); (2) searching for the water depth related to each reflectance spectrum through the time variable common to both files (linear interpolation of water depth as a function of time between consecutive positions).
Water samples were collected at four different locations along the cross-shore transects (figure 1a) to assess the optically-significant constituents of seawater (Suspended Particulate Matter, Chlorophyll-a). The samples were analyzed using Whatman GF/F filters which were then either weighted to determine SPM concentration or processed to extract the phytoplankton and measure chlorophyll-a concentration with a fluorimeter.
3.4. INVERSION ALGORITHMS FOR MAPPING BATHYMETRY
The water leaving radiance and henceforth the water reflectance varies with depth, bottom colour and water content (Morel and Prieur, 1977; Lyzenga, 1978). This triple dependence is summarized by the following relationship (Lee et al., 1998):
[
]
(
1 A exp (K K )z)
AR exp[
(K K )z]
r r B u d B 1 D u d 0 D rs rs = − − + + − + [4]where rrs is the subsurface (just below the water surface) remote sensing reflectance (Lu-/Ed-), subscript
D is for optically deep waters, z is the water depth, RB is the bottom irradiance reflectance (Eu/Ed just
above the bottom), Kd and Ku are respectively the vertically averaged diffuse attenuation coefficients
for downwelling irradiance and upwelling radiance. KuD and KuB are respectively for deep and shallow
waters. According to the quasi-simple scattering theory, A0 and A1 are assumed to be 1 and 1/π for a
Lambertian bottom.
The subsurface remote sensing reflectance rrs is computed as
) z K ( exp L E 04 . 1 r u(z) u ) 0 ( d rs + = [5]
where Ed(0+)=1.04 Ed(0-) to account with refraction and reflection effects at the water-air interface. We
remind that no in situ measurements of Ku and Kd were realized during this experiment. But an
0.5 m below the water surface. Otherwise, Ku and Kd values collected at the inlet of Arcachon lagoon
will be used (Lafon et al., 2002).
Considering an effective attenuation coefficient K (=Ku+Kd), these authors have shown mean values of
K measured in a similar environment (i.e. moderately turbid waters, sandy seabed) in deep waters to be relatively close to the values obtained in shallow waters near the sand banks. From this approximation, equation [4] is simplified to the following relation:
) z K ( exp r R 1 r r D rs B D rs rs ⎥⎦ − ⎤ ⎢⎣ ⎡ − π = − [6]
The water depth is finally determined by the equation below :
K ) r r ( ln K ) r R ( ln z D rs rs D rs B 1 − − − = π [7]
Empirical algorithms are also an alternative method to retrieve water depth from the remote sensing reflectance in optically shallow waters. Lafon et al. (2002) found a relatively accurate relationship [8] using a field dataset that was then applied to a set of SPOT satellite images. For XS1 band (500-590 nm) and for depths lower than 6 m,
) R (-0.3688 exp 16.707 z= XS1 [8] 4. RESULTS
4.1. NEARSHORE WATER TYPES
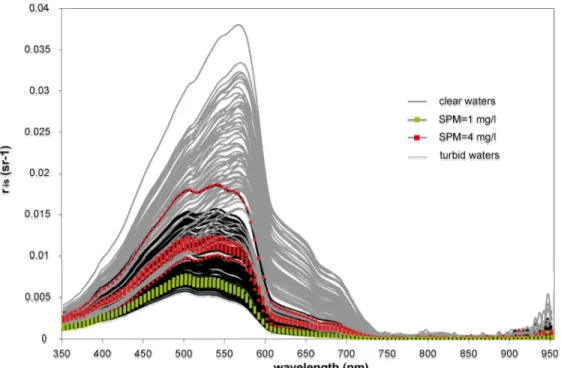
In situ reflectance spectra computed as Lu(z)/Ed(0+) and collected in water depth of 3-16 m are shown in figure 3. From a qualitative point of view, the spectra shape is representative of the water types with a wide reflectance peak over the whole green band for low turbidity “clear” waters (SPM concentration lower than 5 mg/l) and a more pronounced one in the yellow band (570-580 nm) characteristic of moderately turbid waters ([SPM]=5-10 mg/l). The threshold for water type separation is set according to reflectance values at 500 and 570 nm so that ris (570 nm) - ris (500 nm) = 0.00025 sr-1 is the lower
limit for moderately turbid waters. The progressive increase of the reflectance maxima around 540 nm first and then 570 nm is correlated to the increase in the particulate sediment load from very low SPM concentrations (<1 mg/l, green curves) to moderate concentrations (SPM=4 mg/l for red curves and likely higher for grey curves). Actually, three of the four water samples collected (table 1) are characterized by a very low particulate load (both sediment and phytoplankton) while the shoreward sample collected in brownish waters in 3 m depth gives a discrete estimation of the content of SPM and Chl-a in shallow waters a few tens of meters off the shoreline. Simple tests using WASI software (Gege, 2004) to inverse reflectance spectra with a large peak at 570 nm (setting water depth as known) show SPM reaching concentrations up to 10 mg/l. This spatial gradient in SPM and Chl-a
concentrations is explained by strong rip currents that drive sediments offshore, from the runnel of the inner sandbar to outside the surf zone. Turbid water plumes are a common feature along the coastline extending rhythmically over tens to hundreds of meters alongshore and across the surf zone, disabling the retrieval of the bottom signal and of the shape of the outer sandbar in some locations despite shallow waters (figure 1a).
Figure 3. In situ reflectance spectra ris (defined as Lu(z) /Ed+) measured in 3-16 m water depth (area
showed by figure 2b), black and grey curves are respectively spectra collected in low turbidity waters (SPM<5 mg/l; n=172) and in moderately turbid waters (5<SPM<10 mg/l; n=77).
sample collected at water depth (m) [SPM] (mg/l) [Chl-a] (µg/l)
15h21 (25) 0.78 0.17 15h30 (15-20) 0.96 0.29 15h40 8.5-9 0.78 0.17 15h47 3.4 3.93 0.68
Table 1. Seawater constituents at the four sampled locations during the hyperspectral experiment, water depth (in m), suspended particulate matter concentration (in mg/l) and chlorophyll-a
concentration (in µg/l).
4.2. INFLUENCE OF BOTTOM DEPTH ON WATER REFLECTANCE
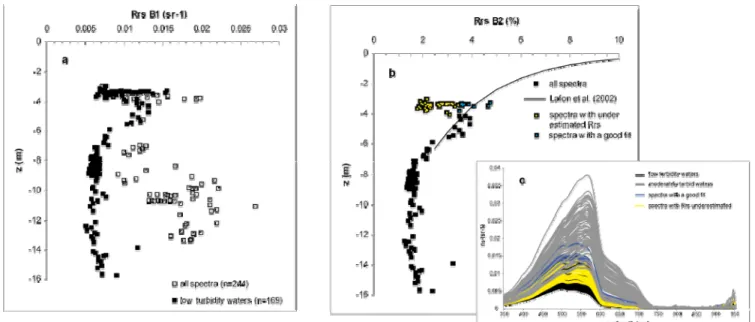
The influence of bottom depth on the reflectance signal is investigated by plotting computed remote sensing reflectances in Formosat-2 band 1 (450-520 nm) and band 2 (520-600 nm) over the water depth (figure 4a). Considering the whole dataset, the plot is much scattered because in waters with a
significant load of particles, backscattering is higher in both bands enhancing the reflectance at all depths. Selecting only spectra collected in low [SPM] waters reduce considerably data scattering excepting in water depth of 3-4 m where a large pool of spectra stands out the Lafon et al. (2002) relationship (figure 4b). Although they were recorded in relatively clear waters, 46 of these 55
reflectance spectra seem to be underestimated (Rrs lower than 3.5% in band 2 and 0.012 sr-1 in band 1)
in regards to the 9 remaining spectra which exhibit a rather good fit and a higher reflectance in the entire 500-600 nm band (figure 4c). We would expect these Rrs values to be associated with water
depth of 4.5-7 m rather than 3-4 m. As measured radiance spectra were filtered from excessive inclination angles, these observed underestimated reflectance values cannot be allocated to a bias in water depth determination that might have been induced by wave shoaling.
Figure 4. Remote sensing reflectance in Formosat-2 band 1 (in sr-1, fig. 4a) and band 2 (in %, fig. 4b) as a function of water depth, all data (squares), data collected in low turbidity waters (black squares), data in 3-4 m depth fitting or not Lafon et al. (2002) relationship are respectively figured
by blue and yellow squares. Corresponding reflectance spectra are shown in fig. 4c.
Discarding these values apart which remains misunderstood at that time, Rrs increases with decreasing
water depth between 3-7 m. Unfortunately, no data are available at shallower depths preventing a comprehensive validation of the field parameterization of Lafon et al. (2002) for oceanic beaches. Beyond a depth of 7 m, the influence of water depth on reflectance in B1 and B2 bands is not significant any longer. Thus, optically deep waters include both moderately turbid waters in shallow water depths and low turbidity waters at depths deeper than 7 m.
4.3. WATER DEPTH INVERSION
Before applying such algorithm, care should be given to the reflectance data that are expected to be inversed (either field- or image-based) so that only optically-shallow water data are dealt with. Ongoing attempts for retrieving water depth from theory [4] do not lead to conclusive results yet. We hope to present our new findings at the conference.
CONCLUSION
An original data set composed of synchronous reflectance measurements, bathymetric data and a high-resolution satellite image has been collected along the French Atlantic coast at Truc Vert Beach. Its analysis reveals a spatio-temporal variability of nearshore waters (from a very low to medium particulate load) which is inferred by wave-induced currents flowing across the complex sandbar system. Reflectance spectra collected in relatively “clear” waters (sediment concentrations lower than 5 mg/l) are used to discriminate the influence of bottom depth onto the water-leaving signal which agrees reasonably well with former observations. Optically-deep waters are found beneath water depths of 7 m and in shallow moderately turbid waters ([SPM] > 5 mg/l) disabling the inversion of optical models.
The bathymetric and optical data were collected in the frame of the ECORS project (SHOM-DGA) and the satellite image with the support of the French National Space Center (CNES) through the Kalideos-Littoral program. This work benefited of a postdoctoral research grant from the French National Space Center (CNES).
REFERENCES
Castelle, B., Bonneton, P., Dupuis, H. and Sénéchal, N., 2007. Double bar beach dynamics on the high-energy meso-macrotidal French Aquitanian Coast: a review. Marine Geology, 245: 141-159.
Doxaran, D., Froidefond, J.M., Lavender, S.J. and Castaing, P., 2002. Spectral signature of highly turbid waters.
Application with SPOT data to quantify suspended particulate matter concentrations. Remote sensing of Environment, 81: 149-161.
Fargion, G.S. and Mueller, J.L., 2000. Ocean optics protocols for satellite ocean colour sensor validation. Revision 2. NASA Tech. Memo. 209966. SeaWIFS Tech. Rep. Ser., NASA Goddard Space Flight Center.
Gege, P., 2004. The water color simulator WASI: an integrating software tool for analysis and simulation of optical in situ spectra. Computers and Geosciences, 30: 523-532.
Lafon, V., Froidefond, J.M., Lahet, F. and Castaing, P., 2002. SPOT shallow water bathymetry of a moderately turbid tidal inlet based on field measurements. Remote sensing of Environment, 81: 136-148.
Lee, Z., Carder, K.L., Mobley, C.D., Steward, R.G. and Patch, J.S., 1998. Hyperspectral remote sensing for shallow waters. I. a semianalytical model. Applied optics, 37(27): 6329-6338.
Lyzenga, D.R., 1978. Passive remote sensing techniques for mapping water depth and bottom features. Applied optics, 17(3): 379-383.
Martiny N., Dehouck A., Froidefond J.-M., Sénéchal N., 2008. Validation of high-resolution ocean color remote sensing in complex case-2 waters by use of reflectance spectra measured on board a jet-ski during the ECORS experiment. SPIE Asia-Pacific Remote Sensing, November 17-21, Noumea (New Caledonia).
Morel, A. and Prieur, L., 1977. Analysis of variations in ocean color. Limnology and Oceanography, 22: 709-722. Ohde, T. and Siegel, H., 2003. Derivation of immersion factors for the hyperspectral TriOS radiance sensor. Journal of optics A: pure and applied optics, 5: L12-L14.