HAL Id: hal-00304270
https://hal.archives-ouvertes.fr/hal-00304270
Submitted on 16 Jun 2008HAL is a multi-disciplinary open access
archive for the deposit and dissemination of sci-entific research documents, whether they are pub-lished or not. The documents may come from teaching and research institutions in France or abroad, or from public or private research centers.
L’archive ouverte pluridisciplinaire HAL, est destinée au dépôt et à la diffusion de documents scientifiques de niveau recherche, publiés ou non, émanant des établissements d’enseignement et de recherche français ou étrangers, des laboratoires publics ou privés.
Saharan dust levels in Greece and received inhalation
doses
C. Mitsakou, G. Kallos, N. Papantoniou, C. Spyrou, S. Solomos, M. Astitha,
C. Housiadas
To cite this version:
C. Mitsakou, G. Kallos, N. Papantoniou, C. Spyrou, S. Solomos, et al.. Saharan dust levels in Greece and received inhalation doses. Atmospheric Chemistry and Physics Discussions, European Geosciences Union, 2008, 8 (3), pp.11967-11996. �hal-00304270�
ACPD
8, 11967–11996, 2008
Saharan dust levels in Greece and received inhalation doses C. Mitsakou et al. Title Page Abstract Introduction Conclusions References Tables Figures ◭ ◮ ◭ ◮ Back Close Full Screen / Esc
Printer-friendly Version Interactive Discussion Atmos. Chem. Phys. Discuss., 8, 11967–11996, 2008
www.atmos-chem-phys-discuss.net/8/11967/2008/ © Author(s) 2008. This work is distributed under the Creative Commons Attribution 3.0 License.
Atmospheric Chemistry and Physics Discussions
Saharan dust levels in Greece and
received inhalation doses
C. Mitsakou1, G. Kallos1, N. Papantoniou1, C. Spyrou1, S. Solomos1, M. Astitha1, and C. Housiadas2
1
National and Kapodistrian University of Athens, Department of Physics, Athens, Greece
2
National Centre for Scientific Research “Demokritos”, Institute of Nuclear Technology and Radiation Protection, Athens, Greece
Received: 7 March 2008 – Accepted: 6 June 2008 – Published: 16 June 2008 Correspondence to: G. Kallos ([email protected])
ACPD
8, 11967–11996, 2008
Saharan dust levels in Greece and received inhalation doses C. Mitsakou et al. Title Page Abstract Introduction Conclusions References Tables Figures ◭ ◮ ◭ ◮ Back Close Full Screen / Esc
Printer-friendly Version Interactive Discussion
Abstract
The desert of Sahara is one of the major sources of mineral dust on Earth, producing around 2×10⁸tons/yr. Under certain weather conditions, dust particles from Saharan desert get transported over the Mediterranean Sea and most of Europe. The limiting values set by the directive EC/30/1999 of European Union can easily be exceeded by
5
the transport of desert dust particles in all south European areas and especially ur-ban. In this study, the effects of dust transport on air quality in several Greek urban areas are quantified. PM10 concentration values from stationary monitoring stations
are compared to dust concentrations for the 4-year period 2003–2006. The dust con-centration values in the Greek areas were estimated by the SKIRON modelling system
10
coupled with embedded algorithms describing the dust cycle. The mean annual dust contribution to daily-averaged PM10 concentration values was found to be around or
even greater than 10% in the urban areas throughout the years examined. Natural dust transport may contribute by much more than 20% to the annual number of ex-ceedances – PM10 values greater than EU limits – depending on the specific
moni-15
toring location. In a second stage of the study, the inhaled lung dose received by the residents in various Greek locations is calculated. The particle deposition efficiency of mineral dust at the different parts of the human respiratory tract is determined by applying a lung dosimetry numerical model, which incorporates inhalation dynamics and aerosol physical processes. The inhalation dose from mineral dust particles was
20
greater in the upper respiratory system (extrathoracic region) and less significant in the lungs, especially in the sensitive alveolar region. However, in cases of dust episodes, the amounts of mineral dust deposited along the human lung are comparable to those received during exposure in heavily polluted urban or smoking areas.
ACPD
8, 11967–11996, 2008
Saharan dust levels in Greece and received inhalation doses C. Mitsakou et al. Title Page Abstract Introduction Conclusions References Tables Figures ◭ ◮ ◭ ◮ Back Close Full Screen / Esc
Printer-friendly Version Interactive Discussion
1 Introduction
Mineral dust, produced by wind erosion, over arid and semi-arid areas of North Africa, get transported over the Mediterranean Sea and most of Europe, under certain weather conditions. Desert dust particles affect the atmosphere and climate. By scattering and absorbing solar radiation they modify the planetary albedo and reduce the amount of
5
radiation reaching the Earth’s surface (Yu et al., 2001). Aerosols act as cloud con-densation nuclei (CCN), thus modifying the microphysical, micro-chemical and, hence, optical and radiative properties of clouds (Charlson et al., 1991). They can also influ-ence the nutrient dynamics and biogeochemical cycling of both terrestrial and oceanic ecosystems (Herut et al., 2001).
10
In the past decades, a clear connection between suspended particulate matter and health effects has been found (Dockery and Pope, 1994). Therefore, the European Community has established the Air Quality Directive 1999/30/EC limiting the concen-tration levels of PM10; mean annual PM10concentrations should not exceed 40 µg m−3,
and the daily limit value of 50 µg m−3 should not be exceeded more than 35 days/year.
15
The above standards should have been accomplished by the year 2005. These limiting values can easily be exceeded by naturally produced aerosols (desert dust) for many days during the year in all southern European areas and especially urban. Therefore, recent studies have focused on the estimation of the influence of the African dust on air quality in Mediterranean urban areas (Rodr´ıguez et al., 2003; Escudero et al., 2007).
20
In a recent study in Greece, it was found that for about 50% of the daily exceedances observed in ambient air monitoring stations there was a contribution from Saharan dust transport (Kallos et al., 2007a).
The first objective of this study is to quantify the effects of dust transport on air quality in several Greek urban areas using a large number of data from PM monitoring stations
25
and air quality model outputs. The model used is the SKIRON weather forecasting sys-tem with the desert dust module (Kallos et al., 1997; Nickovic et al., 2001). The second objective is to investigate the inhaled doses of dust received by the residents in the
ACPD
8, 11967–11996, 2008
Saharan dust levels in Greece and received inhalation doses C. Mitsakou et al. Title Page Abstract Introduction Conclusions References Tables Figures ◭ ◮ ◭ ◮ Back Close Full Screen / Esc
Printer-friendly Version Interactive Discussion Greek urban areas during various exposure conditions. Inhaled dust particles may be
deposited at different parts of the human respiratory tract (nasopharyngeal, tracheo-bronchial, alveolar region). The determination of the particle deposition at different parts of the respiratory system is an essential step in investigating possible risks from exposure to desert dust. To this end, a recently developed dosimetry model (Mitsakou
5
et al., 2005) is applied. The model calculates deposited inhaled aerosols in the various regions of the human respiratory tract, taking into account the aerosol properties (e.g. size distribution, hygroscopicity) and the physiological conditions of the individual.
The methodology adopted for the air quality and dosimetry analyses is described in Sect. 2, while Sect. 3 provides discussion of the results. Finally, the concluding remarks
10
of the study are summarized in Sect. 4.
2 Methodology
2.1 Air quality analysis
For the purpose of this study, the operational runs of the SKIRON system and the daily-averaged PM10mass concentration measurements from air quality monitoring stations
15
of the Greek Ministry of Environment City Planning and Public Works (MECPPW) have been analyzed. Correlations between the model outputs and the PM10 measurements
from the monitoring stations can help identifying the dust contribution to the air quality in the Greek urban areas. The model predictions and the experimental measurements cover the four-year time period 2003–2006. A brief description of the implemented
20
tools is given below.
2.1.1 SKIRON modelling system
In this study, the SKIRON atmospheric modelling system was used (Kallos et al., 1997; Papadopoulos et al., 2002). SKIRON is a modified version of the Eta/NCEP regional
ACPD
8, 11967–11996, 2008
Saharan dust levels in Greece and received inhalation doses C. Mitsakou et al. Title Page Abstract Introduction Conclusions References Tables Figures ◭ ◮ ◭ ◮ Back Close Full Screen / Esc
Printer-friendly Version Interactive Discussion atmospheric model, fully coupled with a module for describing the desert dust cycle
in the atmosphere. The Eta model is well-documented and detailed descriptions of its dynamics and physics components can be found in several studies (e.g. Mesinger et al., 1988; Janjic, 1994, and references therein). This initial version has been further improved by incorporating high resolution sea surface temperature SST fields,
spa-5
tial distributions of clay amounts, non-hydrostatic corrections, as suggested in Janjic et al. (2001), in-cloud deposition efficiency, etc. During the SKIRON and POSEIDON projects, the atmospheric radiation and surface processes have been tested and up-dated (Papadopoulos et al., 2002).
The first dust cycle module was developed at the University of Athens in the
frame-10
work of the MEDUSE project and further tested and developed during the ADIOS project. In Nickovic et al. (2001), it was given the name DREAM (Dust REgional At-mospheric Model). The present version incorporates several state-of-the-art param-eterizations for the description of the production, transport and removal processes of the desert dust cycle, while several inconsistencies in the initial version described in
15
Nickovic et al. (2001) have been corrected. For the definition of the areas that are po-tentially active, global datasets are used for the vegetation (Olson World Ecosystems with 30” × 30” resolution) and soil texture (FAO/UNESCO with 2′
× 2′resolution). The soil texture dataset has been enhanced by using the concept of rocky soil. Also, the soil moisture and turbulent state of the atmosphere play a critical role in the amount of dust
20
uplifted and injected into the air. Since the dust cycle module is dynamically coupled to the atmospheric model, the prognostic atmospheric and hydrological conditions are used to calculate the effective rates of the injected dust at each time step.
The initial version was using a single particle size (1997–2003). The model version used in the present study had four size bins with centered diameters of 1.5, 12, 36, and
25
76 µm (Tegen and Fung, 1994). For the present analysis, the model outputs that cor-respond to the two smaller-diameter (1.5 and 12 µm) size bins are taken into account in order to approach the PM10African dust. The ability of the model to predict the dust
ACPD
8, 11967–11996, 2008
Saharan dust levels in Greece and received inhalation doses C. Mitsakou et al. Title Page Abstract Introduction Conclusions References Tables Figures ◭ ◮ ◭ ◮ Back Close Full Screen / Esc
Printer-friendly Version Interactive Discussion dust across the Atlantic Ocean (Kallos et al., 2006). The simulated dust concentration
values appeared to agree satisfactorily with the available observations. Moreover, the dust transport simulations of the SKIRON system have been validated with the aim of ground dust concentration measurements in Haifa, Israel (measurements provided by B. Herut-personal communication) and by comparing with LIDAR measurements that
5
were performed from 2001 to 2003 in Rome, Italy. More details on the evaluation of the system can be found in the works of Kishcha et al. (2007) and Kallos et al. (2007b).
The SKIRON system with the dust component has been in operational use at the University of Athens since 1998, providing 72-h weather and dust transport and de-position forecasts for the Mediterranean region. These forecasts are available from
10
the Internet sitehttp://forecast.uoa.gr/, while the systematic backup is executed since the beginning of 2000. After 2003, the four-size distribution version with the correc-tions mentioned above is set up in operational use. Recently, the operational version has been replaced by a newest one with eight size bins, as proposed by Zender et al. (2003), together with several other improvements. In the present work, this long
15
time series of desert dust data with four size bins is used to quantify the effects of naturally produced aerosols in PM10monitoring stations in Greece.
2.1.2 Experimental data
The MECPPW has a relatively dense monitoring network in Athens and in major Greek urban areas. However, in many of them there are long gaps in monitoring. Thus, four
20
monitoring sites were selected for the present analysis based on the data availability and geographical location. The selection criteria were related to the length of the time series, the location of the stations and the representativeness of the greater urban conglomerate. Each monitoring station is situated in one of the most populated Greek urban areas, namely, Athens, Patra, Volos, Heraklion. The locations of the monitoring
25
stations are displayed in Fig. 1. According to the criteria proposed by the European Environment Agency, the monitoring station of Athens located northwest of the city center (Thrakomakedones) is a suburban-background station; thus, the contribution of
ACPD
8, 11967–11996, 2008
Saharan dust levels in Greece and received inhalation doses C. Mitsakou et al. Title Page Abstract Introduction Conclusions References Tables Figures ◭ ◮ ◭ ◮ Back Close Full Screen / Esc
Printer-friendly Version Interactive Discussion local PM sources (traffic, construction works and other anthropogenic activities) to air
quality at the specific area is limited and the contribution of the natural sources can be detected more easily. However, no suburban monitoring stations have been placed in the other urban areas (Patra, Volos, Heraklion), but these cities are relatively small (150 000–300 000 inhabitants). Therefore, the collected data from the urban monitoring
5
stations of the three areas were analyzed. The concentration of PM10aerosol particles
is monitored at the above-mentioned sites by using β-attenuation systems. 2.1.3 SKIRON output processing
The forecast model generates hourly dust concentrations. Thus, the daily-averaged values of dust concentration had to be calculated based on the hourly values for the
10
comparison with the experimental ones from the monitoring stations. The horizontal grid increment of the model domain is 0.24◦ (approximately 25 km). In the vertical
32 levels were used stretching from the ground to the model top (20 km). The deter-mination of the simulated dust concentration at the specific measuring points of the MECPPW stations was achieved by applying linear interpolation to the model outputs.
15
More specifically, the aerosol concentration at the measuring points was approximated by the relative contribution of the closest grid points of SKIRON domain introducing a weight function (inverse distance weighting) for the contribution of the grid points to the actual location of the MECPPW station.
2.2 Dosimetry analysis
20
For the dosimetric calculations a mechanistic inhalation dosimetry model is used, which includes both inhalation and aerosol dynamics (Mitsakou et al., 2005). The model solves the aerosol general dynamic equation (GDE) along the flow direction (in one dimension). The size distribution is described with a sectional representation, which allows for arbitrary functional forms of the size distribution. The description of the
res-25
incorpo-ACPD
8, 11967–11996, 2008
Saharan dust levels in Greece and received inhalation doses C. Mitsakou et al. Title Page Abstract Introduction Conclusions References Tables Figures ◭ ◮ ◭ ◮ Back Close Full Screen / Esc
Printer-friendly Version Interactive Discussion rating time-varying alveolar region during breathing (expanding and contracting
rhyth-mically during respiration). The particle deposition is assumed to be the result of the mechanisms of gravitational settling, Brownian diffusion and inertial impaction, acting simultaneously. The air velocity in the airways is determined by solving the equation of continuity.
5
The deposition rate of inhaled particles in the respiratory tract is calculated by sum-ming up the calculated rate for each size bin, taking into account the tidal volume (volume of air inspired and expired during each respiratory cycle) and the breathing frequency (number of breaths per time), as follows
Deposition rate=X
i
DFi· ni · VT · f (1)
10
where DF is the calculated deposited fraction, ni the particle number concentration of
the i th size section at the entrance of the respiratory tract, VT the tidal volume and f
the breathing frequency. The physiological parameters VT and f depend on the level of physical exertion. The values utilized in our calculations are taken from ICRP (1994), as recommended for an adult Caucasian male under the typified conditions of light
15
exercise (VT=1250 ml, f =20 min−1).
3 Results and discussions
3.1 Natural dust transport
A first approach for the origin of the urban particulate matter is attempted via a sta-tistical analysis of the PM10 concentration values from the monitoring stations. The
20
histograms in Fig. 2a–d illustrate the monthly averaged concentration of PM10 mea-surements for each monitoring station. These values were calculated by averaging the measured concentration values obtained during the respective months of the 4-year database (3-year database for Heraklion, measurements for 2006 are missing).
ACPD
8, 11967–11996, 2008
Saharan dust levels in Greece and received inhalation doses C. Mitsakou et al. Title Page Abstract Introduction Conclusions References Tables Figures ◭ ◮ ◭ ◮ Back Close Full Screen / Esc
Printer-friendly Version Interactive Discussion Peak PM10 values can be identified mostly during the transition seasons (spring and
autumn) and secondarily in winter in almost all monitoring sites, while minimum values are usually noticed during the summer period due to prevailing northerly wind patterns (etesian winds, see Kallos et al., 1993). For example, the monthly averaged PM10
concentration for the Athens suburban station is maximum in April, when African dust
5
concentration is also high (see Figs. 2, 3). The most significant sources of PM10could
be natural (Saharan dust, sea salt, pollen from pine and olive trees during spring), but also anthropogenic (central heating, traffic, industry), as mentioned in previous studies (e.g. Querol et al., 2004). The maximum sea salt concentration occurs during the winter period due to the high sea spray production (Koc¸ak et al., 2007). Moreover, the use of
10
central heating is maximum in winter. Increased dust transport takes place in the tran-sition seasons (spring and autumn, Gerasopoulos et al., 2006; Kallos et al., 2007b). According to the above analysis, PM10 maximum values in spring or autumn months
could be attributed mainly to mineral dust transport. Thus, the analysis based on the measured PM10 values indicates a noticeable contribution of mineral dust to urban air
15
quality. On the other hand, PM10values in a town of approximately 150 000 inhabitants
in central Greece (Volos) show maximum aerosol concentrations in the winter period (December). Volos monitoring site is the more northern site comparing to the other examined sites, the distance from Heraklion is approximately 4◦
(∼400 km). The influ-ence of dust transport decreases towards higher geographical latitudes. The effect of
20
dust transport is reduced with increasing distance from the dust source, as dust parti-cles are deposited via wet and dry mechanisms. Furthermore, there are two extended industrial areas at the outskirts of the town, where high PM amounts are released. The first industrial area is northwest of the town and the second one (concrete production) is at the southeast part.
25
The time periods of increased dust transport are also pointed by the simulated dust concentration values. In Fig. 3, the time series of Saharan dust levels for the four urban areas, as simulated by the SKIRON modelling system, are illustrated for the time period 2003–2006. The most severe dust transport episodes usually appear during the period
ACPD
8, 11967–11996, 2008
Saharan dust levels in Greece and received inhalation doses C. Mitsakou et al. Title Page Abstract Introduction Conclusions References Tables Figures ◭ ◮ ◭ ◮ Back Close Full Screen / Esc
Printer-friendly Version Interactive Discussion from the beginning of spring till the first days of June. Maximum values are noticed
in May; high levels of dust concentration dominate in March and April. Secondary maxima of dust concentration can be identified during September and October. The above results appear to agree with the fact of increased dust concentrations during the transition periods.
5
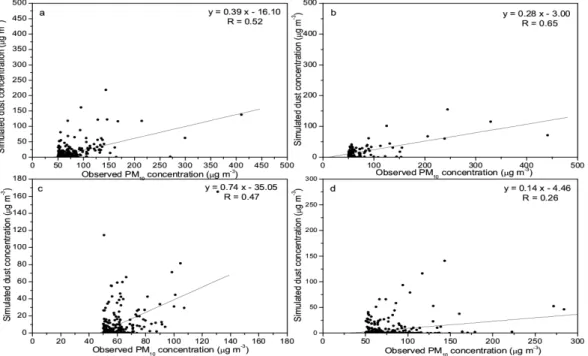
Model estimates of near ground dust concentrations have been compared with PM10
observations. More specifically, in Fig. 4a–d scatter plots between predicted dust con-centrations and measured PM10 concentrations for the cases of daily exceedances (observed PM10 values greater than the daily EU limit of 50 µg m−3) are presented for
each monitoring station. The trend lines have been derived for each dataset and the
10
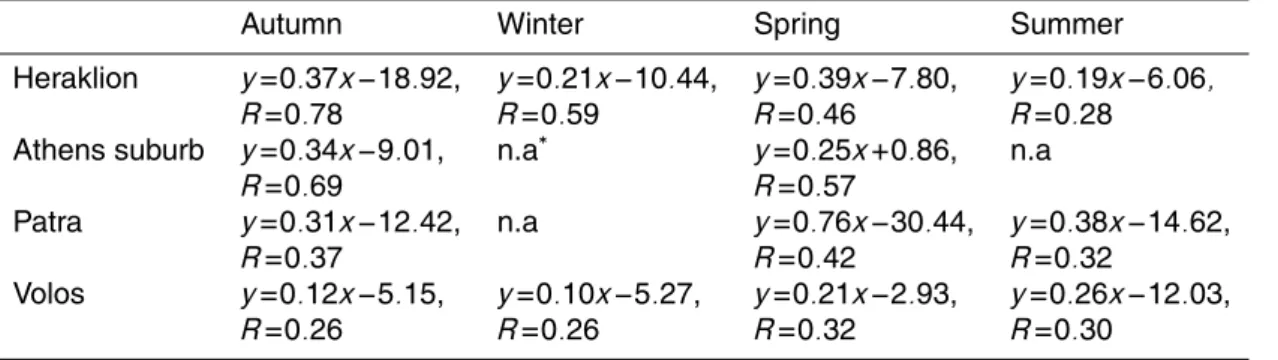
correlation coefficients have been calculated. The seasonal trend lines of the scatter plots and the correlation coefficients for each season of the year separately and for each monitoring site are presented in Table 1, where x is the observed PM10
concen-tration and y is the simulated dust concenconcen-tration (for cases of daily exceedances). The correlation coefficients appear to fluctuate between 0.78 (Heraklion, autumn period)
15
and 0.26 (Volos). The low coefficient value between PM10 and dust concentrations
found for Volos station during all seasons of the year limits the statistical confidence of the estimation of dust contribution to the urban air quality for the specific area. This low correlation could be attributed to the geomorphological characteristics of the area, more specifically, the town is adjacent to a steep mountain that receives considerable
20
amounts of precipitation and, thus, the washout effect becomes important. On the other hand, higher correlation values have been calculated for the southern town of Herak-lion, especially during the transition autumn period. In general, the correlation between measured and simulated particle concentrations appears significantly weaker during the summer period in all sites, when dust transport from Saharan desert is limited due
25
to the northerly etesian winds.
The slope of the trend line in Fig. 4a–d is indicative of the percentage of mineral dust in PM10concentration, when exceedances occur, while the intercept is related to
ACPD
8, 11967–11996, 2008
Saharan dust levels in Greece and received inhalation doses C. Mitsakou et al. Title Page Abstract Introduction Conclusions References Tables Figures ◭ ◮ ◭ ◮ Back Close Full Screen / Esc
Printer-friendly Version Interactive Discussion slope of the trend line is 0.39 (Fig. 4a) that denotes a dust contribution to urban
aerosol approaching 40%. Gerasopoulos et al. (2006) performed a chemical analy-sis of PM10 in combination with back-trajectories analysis for Heraklion during dust
episodes. The analyses showed a participation of mineral dust at about 40% in PM10
daily exceedances throughout the year. Thus, the dust contribution calculated in the
5
present analysis seems to be verified by the analysis of Gerasopoulos et al. (2006). The fraction of dust transported particles to PM10 exhibits the lowest value during the
summer period (the slope of the trend line is 0.19), which is in agreement with the findings of the latter work. The high intercept values for the site of Patra demonstrates the remarkable influence of local pollution, while the slope of 0.76 during the spring
10
period reveals that dust transport also plays a significant role in the urban air quality. Dust transport seems to affect PM10values in cases of daily exceedances in Athens by
25 and 34% during the spring and autumn periods respectively. However, a compari-son with the other seacompari-sonal periods is not feasible due to very limited number of PM10 observations during the winter and summer periods. It should be noted, though, that
15
air quality in the Greek urban areas examined here is influenced by the introduction of sea-salt particles, as all the studied areas are seaside. Moreover, southwestern flows that enhance dust transport from the African continent, could also lead to severe air pollution episodes as they are combined with an abrupt temperature change (Kallos et al., 1993). Therefore, PM10 concentration data could not distinguish the dust
trans-20
ported mass from the other suspended materials. Note that the different correlations between simulated and observed values for the various urban areas should be also attributed to the different PM sources. More accurate predictions of dust contribution are obtained for the monitoring site of Athens suburb, as the monitoring station there is characterized as suburban-background.
25
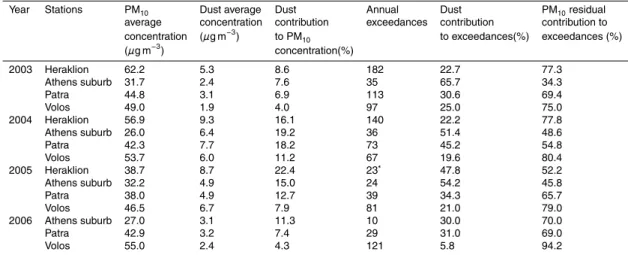
A more explicit statistical analysis of the observed and simulated data for the four years that we examined has been performed. Some of these results are summarized in Table 2. In this table, the averaged observed and simulated values, the dust contri-bution to averaged PM10 concentrations, the number of annual exceedances and the
ACPD
8, 11967–11996, 2008
Saharan dust levels in Greece and received inhalation doses C. Mitsakou et al. Title Page Abstract Introduction Conclusions References Tables Figures ◭ ◮ ◭ ◮ Back Close Full Screen / Esc
Printer-friendly Version Interactive Discussion dust and the residual PM10 contribution to daily exceedances are shown. The residual
PM10 contribution was determined by re-calculating the number of exceedances after subtraction of dust simulated concentration values from the PM10 measured values
and estimating the ratio of the new (after dust elimination) to the total number of ex-ceedances. Thus, the dust contribution to exceedances is the supplementary fraction
5
(100 – residual PM10 contribution). The monitoring site of Athens suburb shows the
lower aerosol concentration and number of exceedances comparing to the other sites; mass concentration for the suburban-background stations presents significantly lower values, since anthropogenic sources are less active in these areas. The annual aver-aged dust concentration decreases from the southern (Heraklion) towards the northern
10
Greek site that we examined (Volos), according to SKIRON model predictions. In par-ticular, the mineral dust concentration values at Volos appear about 30% lower than the dust concentration values predicted for the town of Heraklion for 2004 and 2005 (about 6 and 9 µg m−3 for Volos and Heraklion respectively). The decreasing number of daily
exceedances for the areas of Patra, Athens suburb and Heraklion1 during the 4-year
15
period can be attributed to a possible reduction of dust episodes, since mineral dust transport performs a significant inter-annual variation (e.g. Sunnu et al., 2008), while no particular reduction in anthropogenic PM emissions in Greece has been reported during the period analyzed. The dust contribution to PM10 concentrations – annual
average of daily ratios of dust to PM10 concentrations – approaches and exceeds 10%
20
for the areas of Patra, Athens suburb and Heraklion. In terms of daily exceedances the dust contribution is very high at the suburban station of Athens (e.g. 54.2% for 2005) and noticeable for the other Greek urban areas (>20%).
3.2 Inhaled dose
The human exposure to Saharan dust particles under various dust concentration levels
25
is approached by calculating the different percentiles of aerosol concentration derived
1
ACPD
8, 11967–11996, 2008
Saharan dust levels in Greece and received inhalation doses C. Mitsakou et al. Title Page Abstract Introduction Conclusions References Tables Figures ◭ ◮ ◭ ◮ Back Close Full Screen / Esc
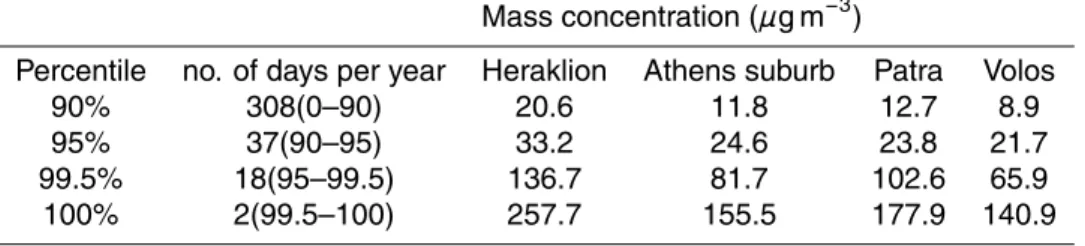
Printer-friendly Version Interactive Discussion by SKIRON modelling system (Table 3). By determining the percentiles (90th, 95th,
99.5th, 100th), four exposure categories are distinguished for dust concentration values between the percentile intervals (0–90, 90–95, 95–9.5, 99.5–100). For each exposure category, the dust mass concentration is assumed to take the maximum value. By that approach, the upper limits of human exposure and received lung dose to Saharan
5
dust particles can be derived. In Table 3, the number of days that correspond to each exposure category is presented (the boundaries of each exposure level, as defined by the percentiles, are shown in the parentheses). As expected, the percentiles of dust concentration exhibit their highest values at Heraklion, while the lowest percentiles are noticed for the town of Volos.
10
Based on the different exposure categories, we assess the lung dose for residents of the Greek urban sites due to Saharan dust transport throughout a year. However, the four-size SKIRON version used in the present analysis could not provide a detailed particle size distribution, as required by the dosimetry model. Thus, for the description of the size distribution of the dust transported cloud in the Greek area, we employed
15
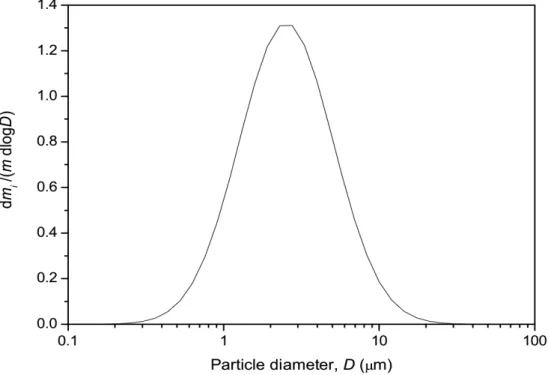
the long-range transport mode proposed by Schulz et al. (1998) and tested by Zender et al. (2003). More specifically, the dust particle size distribution follows a lognormal form with mass median diameter (MMD) equal to 2.524 µm and geometric standard deviation equal to σ=2. For the mineral aerosol, the particle density ρpis taken equal
to 2.65 g cm−3. Note that, a lognormal distribution is fully described by the parameters
20
MMD, σ and mass concentration m. The long-range transport mode that was used for the present calculations appears to coincide with the “coarse 2” mode derived from the analysis of Gerasopoulos et al. (2007). The latter authors studied the seasonal mass size distributions at a coastal site situated 70 km east-northeast of Heraklion (Finokalia). For the spring period, enhanced concentration for particles with
aerody-25
namic diameters 3–7 µm (physical diameters 1.8–4.3 µm) was obtained, attributed to dust transport from Northern Africa. The normalized particle mass distribution (parti-cle mass distribution divided to mass concentration) with the physical characteristics (MMD, σ) used for the dosimetric calculations are illustrated in Fig. 5, as a function of
ACPD
8, 11967–11996, 2008
Saharan dust levels in Greece and received inhalation doses C. Mitsakou et al. Title Page Abstract Introduction Conclusions References Tables Figures ◭ ◮ ◭ ◮ Back Close Full Screen / Esc
Printer-friendly Version Interactive Discussion particle diameter D. However, it should be noted that long-range transported particle
sizes measured away from source regions may depend significantly on the distance from the source regions (Park and Kim, 2006). Larger particles can be detected at re-gions near the source points. The mode of the particle size distribution appears shifted towards smaller particle diameters, as the distance from the dust sources increases.
5
Therefore, the aerosol size distribution used for the depiction of suspended particles at the more distant sites (Athens suburb, Patra, Volos) may be distorted. Aerosol de-position at the various regions of the respiratory tract is strongly dependent on particle size distribution of the inhaled aerosols (Lippmann et al., 1980). Thus, the incorpora-tion of a more detailed bin method in SKIRON modelling system would lead to more
10
accurate dosimetric calculations. However, the use of the current model is considered as efficient for a generic dose assessment.
In SKIRON modelling system, the atmospheric dust behaves as an inert chemi-cal substance. Therefore, in the present study, mineral dust is considered as non-hygroscopic as is at its native state. However, dust particles may become non-hygroscopic
15
through the “aging” process – chemical alterations at the particle surface (Zhang et al., 1994; Levin et al., 1996). Moreover, the presence of hygroscopic biological aerosols (i.e. bacteria, pollen) in the atmosphere (M ¨ohler et al., 2007) is often linked to dust transport (Shinn et al., 2003). Particle deposition pattern along the human lung is highly dependent on aerosol hygroscopicity; thus, the forecast model would be
sig-20
nificantly improved by taking into account the physicochemical properties of the dust particles in a forthcoming study. Nevertheless, the assumption of inert dust particles, as commonly adopted by the models that deal with dust transport (e.g. Nickovic et al., 2001, and references therein), is applied for the current dosimetric calculations.
The ratio of the deposited mass over the total inhaled mass is presented in Table 4
25
for the different regions of the human respiratory tract (extrathoracic – ET, tracheo-bronchial – TB, alveolar – AI) and for one breathing cycle. The calculated values of the deposited fraction show that most of the PM mass stays in the upper respiratory system, namely the ET region. The deeper lung regions (AI) have a lower
concentra-ACPD
8, 11967–11996, 2008
Saharan dust levels in Greece and received inhalation doses C. Mitsakou et al. Title Page Abstract Introduction Conclusions References Tables Figures ◭ ◮ ◭ ◮ Back Close Full Screen / Esc
Printer-friendly Version Interactive Discussion tion of the larger inhaled particles as a result of the deposition made at the entrance
of the respiratory tract (ET region). The great amount of PM mass is accumulated at the larger particle sizes, thus the airborne particle mass decreases while traversing the lung. As a consequence, only 10% of the inhaled particle mass is deposited in the pulmonary lung (AI region).
5
In order to obtain an integrated assessment of the received inhaled dose from Sa-haran dust to the residents of the Greek urban areas, the daily mass deposition rates in the lung (TB and AI regions) were calculated for the different exposure conditions throughout a year (Fig. 6), assuming a typical daily exposure of 6 h. Extremely high mass deposited values during a day are performed for the days of severe dust episodes
10
(99.5th–100th percentile), reaching up to 600 µg day−1for a resident at Heraklion. On
the other hand, the dust mass deposited in the lung for a resident at Volos is only half under all exposure conditions examined here. It must be noted, that the relationship between inhaled dose and dust concentration is linear, since identical physical activity (light exercise) was assumed for all exposure conditions and at the various sites (see
15
Eq. 1). The calculated mass deposition rates are compared to the respective deposition rates presented in the work of Venkataraman and Raymond (1998), so as to interpret the present results. The latter authors reported that the lung dose resulting from the typical daily exposure in the polluted Los Angeles basin equals to 294 µg day−1, while
16-h exposure to environmental tobacco smoke (ETS) leads to dose ranging from 135
20
to 187 µg day−1 for adult males and from 76 to 106 µg day−1 for females. Thus, the
received lung dose for a resident in Patra or Heraklion town during a moderate dust episode (95th–99.5th percentile) is similar to the dose received after exposure in the polluted urban air basin of Los Angeles. Under low dust exposure conditions (90th– 95th percentile), the equivalent doses may approach the particle respiratory deposition
25
in a smoking area.
We have not addressed the toxicological significance of this inhaled dose resulting from the exposure in mineral dust particles, if any. The current calculations showed, however, that the respiratory dose resulting from dust exposure could be significant,
ACPD
8, 11967–11996, 2008
Saharan dust levels in Greece and received inhalation doses C. Mitsakou et al. Title Page Abstract Introduction Conclusions References Tables Figures ◭ ◮ ◭ ◮ Back Close Full Screen / Esc
Printer-friendly Version Interactive Discussion generating further studies in this direction.
4 Conclusions
In the present study, the determination of the mineral dust levels in Greek urban areas and the received inhaled dose was attempted. The quantification of the dust transport effects in urban air quality was accomplished by analyzing a large database of PM10
5
daily measurements and SKIRON model predictions. The analysis confirmed that the dust transport effect is maximized during the transition spring and autumn periods, as has already been noticed in previous studies. The concentration of mineral dust particles decreases from South to North, due to particle deposition mechanisms, thus, the fraction of dust to PM10 concentration appeared to vary significantly depending on
10
the location. Natural dust transport may contribute by much more than 20% to the annual number of exceedances. The mean annual dust contribution to daily-averaged PM10 concentrations was often found to be greater than 10% throughout the years
examined, while the contribution of mineral dust transport to the annual number of exceedances exceeded 20% in most of the studied areas.
15
The determination of the received inhaled doses by the residents in the Greek urban areas showed that the inhaled dose was greater in the upper respiratory system (ex-trathoracic region), since the major amount of PM mass is accumulated at the larger particle sizes that are mostly deposited before reaching the lung. Higher lung deposi-tion rates were calculated for the citizens of the southern part of the country (Heraklion),
20
while the doses are reduced by half for an individual living 400 km far to the North. The calculated lung doses during severe and moderate dust episodes were found to be comparable to those received during exposure in polluted urban and smoking areas.
These concluding remarks are also applicable to most South European urban ar-eas, since dust episodes and local weather conditions are similar to the Greek ones.
25
However, the above results cannot be extrapolated to North African areas, where the situation is expected to be even worst due to the higher dust concentrations there and
ACPD
8, 11967–11996, 2008
Saharan dust levels in Greece and received inhalation doses C. Mitsakou et al. Title Page Abstract Introduction Conclusions References Tables Figures ◭ ◮ ◭ ◮ Back Close Full Screen / Esc
Printer-friendly Version Interactive Discussion the greater frequency of dust events.
Acknowledgements. This work has been supported by the European Union 6th Framework
Program CIRCE IP, contract #036961. The authors also acknowledge the Greek Ministry of
Environment City Planning and Public Works for providing the data on PM10mass concentration
from their monitoring network.
5
References
Charlson, R. J., Langner, J., Rodhe, H., Leovy, C. B., and Warren, S. G.: Perturbation of the Northern Hemisphere radiative balance by backscattering from anthropogenic sulfate aerosols, Tellus A–B, 43, 152–163, 1991.
Dockery, D. W. and Pope, C. A.: Acute respiratory effects of particulate air pollution, Annu. Rev.
10
Publ. Health, 15, 107–132, 1994.
Escudero, M., Querol, X., Pey, J., Alastuey, A., P ´erez, N., Ferreira, F., Alonso, S., Rodr´ıguez, S., and Cuevas, E.: A methodology fort he quantification of the net African dust load in air quality monitoring networks, Atmos. Environ., 41, 5516–5524, 2007.
Gerasopoulos, E., Kouvarakis, G., Babasakalis, P., Vrekoussis, M., Putaud, J. P., and
Mi-15
halopoulos, N.: Origin and variability of particulate matter (PM10) mass concentrations over
the Eastern Mediterranean, Atmos. Environ., 40, 4679–4690, 2006.
Gerasopoulos, E., Koulouri, E., Kalivitis, N., Kouvarakis, G., Saarikoski, S., M ¨akel ¨a, T., Hillamo, R., and Mihalopoulos, N.: Size-segregated mass distributions of aerosols over Eastern Mediterranean: seasonal variability and comparison with AERONET columnar
size-20
distributions, Atmos. Chem. Phys., 7, 2551–2561, 2007,
http://www.atmos-chem-phys.net/7/2551/2007/.
Herut, B., Nimmo, M., Medway, A., Chester, R., and Krom, M. D.: Dry atmospheric inputs of trace metals at the Mediterranean coast of Israel (SE Mediterranean): Sources and fluxes, Atmos. Environ., 35, 803–813, 2001.
25
International Commission on Radiological Protection (ICRP): Human Respiratory Tract Model for Radiological Protection, Technical report, ICRP publication 66, 1994.
Janjic, Z.: The step-mountain eta coordinate model: Further developments of the convection, viscous sublayer and turbulence closure schemes, Mon. Weather Rev., 122, 927–945, 1994.
ACPD
8, 11967–11996, 2008
Saharan dust levels in Greece and received inhalation doses C. Mitsakou et al. Title Page Abstract Introduction Conclusions References Tables Figures ◭ ◮ ◭ ◮ Back Close Full Screen / Esc
Printer-friendly Version Interactive Discussion
Janjic, Z. I., Gerrity, J. P., and Nickovic, S.: An alternative approach to nonhydrostatic modelling, Mon. Weather Rev., 129, 1164–1178, 2001.
Kallos, G., Kassomenos, P., and Pielke, R. A.: Synoptic and mesoscale weather conditions during air pollution episodes in Athens, Greece, Bound.-Lay. Meteor., 62, 163–184, 1993. Kallos, G., Nickovic, S., Papadopoulos, A., Jovic, D., Kakaliagou, O., Misirlis, N., Boukas, L.,
5
Mimikou, N., Sakellaridis, G., Papageorgiou, J., Anadranistakis, E., and Manousakis, M.: The regional weather forecasting system SKIRON: An overview, International Symposium on Regional Weather Prediction on Parallel Computer Environments, Athens, Greece, 15– 17 October, 1997.
Kallos, G., Papadopoulos, A., Katsafados, P., and Nickovic, S.: Transatlantic
Saha-10
ran dust transport: Model simulation and results, J. Geophys. Res., 111, D09204,
doi:10.1029/2005JD006207, 2006.
Kallos, G., Spyrou, C., Papantoniou, N., Mitsakou, C., Astitha, M., Solomos, S., and Katsafa-dos, P.: Analysis of the Particulate Matter Exceedances in Greece, Period 2001–2004. Final Report Prepared for the Ministry of Environment City Planning and Public Work, June 2007a.
15
Kallos, G., Astitha, M., Katsafados, P., and Spyrou, C.: Long-range transport of anthropogeni-cally and naturally produced particulate matter in the Mediterranean and North Atlantic: cur-rent state of knowledge, J. Appl. Meteorol. Clim., 46, 1230–1251, 2007b.
Kishcha, P., Alpert, P., Shtivelman, A., Krichak, S. O., Joseph, J. H., Kallos, G., Katsafados, P., Spyrou, C., Gobbi, G. P., Barnaba, F., Nickovic, S., P ´erez, C., and Baldasano, J. M.: Forecast
20
errors in dust vertical distributions over Rome (Italy): Multiple particle size representation and cloud contributions, J. Geophys. Res., 112, D15205, doi:10.1029/2006JD007427, 2007.
Koc¸ak, M., Mihalopoulos, N., and Kubilay, N.: Contributions of natural sources to high PM10
and PM2.5events in the eastern Mediterranean, Atmos. Environ., 41, 3806–3818, 2007.
Levin, Z., Ganor, E., and Gladstein, V.: The effects of desert particles coated with sulfate on
25
rain formation in the eastern Mediterranean, J. Appl. Meteorol., 35, 1511–1523, 1996. Lippmann, M., Yeates, D. B., and Albert, R. E.: Deposition, retention and clearance of inhaled
particles, Brit. J. Ind. Med., 37, 337–362, 1980.
Mesinger, F., Janjic, Z. I., Nickovic, S., Gavrilov, D., and Deaven, D. G.: The step-mountain coordinate: Model description and performance for cases of Alpine lee cyclogenesis and for
30
a case of an Appalachian redevelopment, Mon. Weather Rev., 116, 1493–1518, 1988. Mitsakou, C., Helmis, C., and Housiadas, C.: Eulerian modelling of lung deposition with
ACPD
8, 11967–11996, 2008
Saharan dust levels in Greece and received inhalation doses C. Mitsakou et al. Title Page Abstract Introduction Conclusions References Tables Figures ◭ ◮ ◭ ◮ Back Close Full Screen / Esc
Printer-friendly Version Interactive Discussion
M ¨ohler, O., DeMott, P. J., Vali, G., and Levin, Z.: Microbiology and atmospheric processes: the role of biological particles in cloud physics, Biogeosciences, 4, 1059–1071, 2007,
http://www.biogeosciences.net/4/1059/2007/.
Nickovic, S., Kallos, G., Papadopoulos, A., and Kakaliagou, O.: A model for prediction of desert dust cycle in the atmosphere, J. Geophys. Res., 106, 18 113–18 129, 2001.
5
Papadopoulos, A., Katsafados, P., Kallos, G., and Nickovic, S.: The weather forecasting system for Poseidon – an overview, Global Atmosphere and Ocean System, 8, 219–237, 2002. Park, S. U. and Kim, J. W.: Aerosol size distributions observed at the Seoul National University
campus in Korea during the Asian dust and non-Asian dust periods, Atmos. Environ., 40, 1722–1730, 2006.
10
Querol, X., Alastuey, A., Ruiz, C. R., Artinano, B., Hansson, H. C., Harrison, R. M., Buringh, E., Ten Brink, H. M., Lutz, M., Bruckmann, P., Straehl, P., and Schneider, J.: Speciation
and origin of PM10and PM2.5in selected European cities, Atmos. Environ., 38, 6547–6555,
2004.
Rodr´ıguez, S., Querol, X., Alastuey, A., Viana, M. M., and Mantilla, E.: Events affecting levels
15
and seasonal evolution of airborne particulate matter concentrations in the Western Mediter-ranean, Environ. Sci. Technol., 37, 216–222, 2003.
Schulz, M., Balkanski, Y. J., Guelle, W., and Dulac, F.: Role of aerosol size distribution and source location in a three-dimensional simulation of a Saharan dust episode tested against satellite-derived optical thickness, J. Geophys. Res., 103, 10 579–10 592, 1998.
20
Shinn, E. A., Griffin, D. W., and Seba, D. B.: Atmospheric transport of mold spores in clouds of desert dust, Arch. Environ. Health, 58, 498–504, 2003.
Sunnu, A., Afet, G., and Resch, F.: A long-term experimental stydy of the Saharan dust pres-ence in West Africa, Atmos. Environ., 87, 13–26, 2008.
Tegen, I. and Fung, I.: Modelling of mineral dust in the atmosphere: Sources, transport and
25
optical thickness, J. Geophys. Res., 99, 22 897–22 914, 1994.
Zender, C. S., Bian, H., and Newman, D.: Mineral dust entrainment and deposition
(DEAD) model: Description and 1990s dust climatology, J. Geophys. Res., 108, 4416, doi:10.1029/2002JD002775, 2003.
Zhang, Y., Sunwoo, Y., Carmichael, G. R., and Kotamarthi, V.: Photochemical processes in
30
the presence of dust: An evaluation of the effect of dust on particulate nitrate and ozone formation, J. Appl. Meteorol., 33, 813–824, 1994.
ACPD
8, 11967–11996, 2008
Saharan dust levels in Greece and received inhalation doses C. Mitsakou et al. Title Page Abstract Introduction Conclusions References Tables Figures ◭ ◮ ◭ ◮ Back Close Full Screen / Esc
Printer-friendly Version Interactive Discussion
aromatic hydrocarbons associated with multimodal urban aerosols, Inhal. Toxicol., 10, 183– 204, 1998.
Weibel, E. R.: Morphometry of human lungs, Springer Edition, Berlin, Germany, 1963.
Yu, S., Zender, C. S., and Saxena, V. K.: Direct radiative forcing and atmospheric absorption by boundary layer aerosols in the southeastern US: Model estimates on the basis of new
5
ACPD
8, 11967–11996, 2008
Saharan dust levels in Greece and received inhalation doses C. Mitsakou et al. Title Page Abstract Introduction Conclusions References Tables Figures ◭ ◮ ◭ ◮ Back Close Full Screen / Esc
Printer-friendly Version Interactive Discussion Table 1. Seasonal trend lines and correlation coefficients between PM10concentrations and
simulated dust concentrations.
Autumn Winter Spring Summer
Heraklion y=0.37x−18.92, y=0.21x−10.44, y=0.39x−7.80, y=0.19x−6.06,
R=0.78 R=0.59 R=0.46 R=0.28
Athens suburb y=0.34x−9.01, n.a∗
y=0.25x+0.86, n.a
R=0.69 R=0.57
Patra y=0.31x−12.42, n.a y=0.76x−30.44, y=0.38x−14.62,
R=0.37 R=0.42 R=0.32
Volos y=0.12x−5.15, y=0.10x−5.27, y=0.21x−2.93, y=0.26x−12.03,
R=0.26 R=0.26 R=0.32 R=0.30
ACPD
8, 11967–11996, 2008
Saharan dust levels in Greece and received inhalation doses C. Mitsakou et al. Title Page Abstract Introduction Conclusions References Tables Figures ◭ ◮ ◭ ◮ Back Close Full Screen / Esc
Printer-friendly Version Interactive Discussion Table 2. PM10/dust average concentrations, number of annual exceedances and quantification
of dust and PM10residual contribution to urban air quality.
Year Stations PM10 Dust average Dust Annual Dust PM10residual
average concentration contribution exceedances contribution contribution to concentration (µg m−3) to PM 10 to exceedances(%) exceedances (%) (µg m−3) concentration(%) 2003 Heraklion 62.2 5.3 8.6 182 22.7 77.3 Athens suburb 31.7 2.4 7.6 35 65.7 34.3 Patra 44.8 3.1 6.9 113 30.6 69.4 Volos 49.0 1.9 4.0 97 25.0 75.0 2004 Heraklion 56.9 9.3 16.1 140 22.2 77.8 Athens suburb 26.0 6.4 19.2 36 51.4 48.6 Patra 42.3 7.7 18.2 73 45.2 54.8 Volos 53.7 6.0 11.2 67 19.6 80.4 2005 Heraklion 38.7 8.7 22.4 23∗ 47.8 52.2 Athens suburb 32.2 4.9 15.0 24 54.2 45.8 Patra 38.0 4.9 12.7 39 34.3 65.7 Volos 46.5 6.7 7.9 81 21.0 79.0 2006 Athens suburb 27.0 3.1 11.3 10 30.0 70.0 Patra 42.9 3.2 7.4 29 31.0 69.0 Volos 55.0 2.4 4.3 121 5.8 94.2
ACPD
8, 11967–11996, 2008
Saharan dust levels in Greece and received inhalation doses C. Mitsakou et al. Title Page Abstract Introduction Conclusions References Tables Figures ◭ ◮ ◭ ◮ Back Close Full Screen / Esc
Printer-friendly Version Interactive Discussion Table 3. Percentiles of the dust mass concentration for the Greek sites (Heraklion, Athens
suburb, Patra, Volos) and number of days per year that corresponds to each exposure category.
Mass concentration (µg m−3)
Percentile no. of days per year Heraklion Athens suburb Patra Volos
90% 308(0–90) 20.6 11.8 12.7 8.9
95% 37(90–95) 33.2 24.6 23.8 21.7
99.5% 18(95–99.5) 136.7 81.7 102.6 65.9
ACPD
8, 11967–11996, 2008
Saharan dust levels in Greece and received inhalation doses C. Mitsakou et al. Title Page Abstract Introduction Conclusions References Tables Figures ◭ ◮ ◭ ◮ Back Close Full Screen / Esc
Printer-friendly Version Interactive Discussion Table 4. Ratio of the deposited mass over the total inhaled mass.
Respiratory tract regions Mass deposited fraction
ET 0.64
TB 0.16
AI 0.10
ACPD
8, 11967–11996, 2008
Saharan dust levels in Greece and received inhalation doses C. Mitsakou et al. Title Page Abstract Introduction Conclusions References Tables Figures ◭ ◮ ◭ ◮ Back Close Full Screen / Esc
Printer-friendly Version Interactive Discussion Fig. 1. Location of the Greek monitoring stations, 1: Heraklion, 2: Athens suburb, 3: Patra, 4:
ACPD
8, 11967–11996, 2008
Saharan dust levels in Greece and received inhalation doses C. Mitsakou et al. Title Page Abstract Introduction Conclusions References Tables Figures ◭ ◮ ◭ ◮ Back Close Full Screen / Esc
Printer-friendly Version Interactive Discussion
Figure 2
Fig. 2. Monthly-averaged PM10concentration values for the sites of (a) Heraklion, (b) Athens suburb, (c) Patra, (d) Volos, for the period 2003–2006 (for Heraklion 3-year period: 2003–2005).
ACPD
8, 11967–11996, 2008
Saharan dust levels in Greece and received inhalation doses C. Mitsakou et al. Title Page Abstract Introduction Conclusions References Tables Figures ◭ ◮ ◭ ◮ Back Close Full Screen / Esc
Printer-friendly Version Interactive Discussion D u st c o n c e n tr a ti o n ( g m -3) 0 50 100 150 200 250 300 0 50 100 150 200 250 300 01.01.03 02.07.03 01.01.04 01.07.04 31.12.04 01.07.05 31.12.05 01.07.06 31.12.06 0 50 100 150 200 250 300 0 50 100 150 200 250 300 0 5 0 1 0 0 1 5 0 2 0 0 2 5 0 3 0 0 0 5 0 1 0 0 1 5 0 2 0 0 2 5 0 3 0 0 0 5 0 1 0 0 1 5 0 2 0 0 2 5 0 3 0 0
Jan03 Jul03 Jan04 Jul04 Jan05 Jul05 Jan06 Jul06 Jan07
Jan03 Jul03 Jan04 Jul04 Jan05 Jul05 Jan06 Jul06 Jan07
Jan03 Jul03 Jan04 Jul04 Jan05 Jul05 Jan06 Jul06 Jan07
Jan03 Jul03 Jan04 Jul04 Jan05 Jul05 Jan06 Jul06 Jan07
Fig. 3. Time-series of simulated dust concentrations for (a) Heraklion, (b) Athens suburb, (c)
ACPD
8, 11967–11996, 2008
Saharan dust levels in Greece and received inhalation doses C. Mitsakou et al. Title Page Abstract Introduction Conclusions References Tables Figures ◭ ◮ ◭ ◮ Back Close Full Screen / Esc
Printer-friendly Version Interactive Discussion
Figure 4
Fig. 4. Correlations between observed PM10concentrations and simulated dust concentrations for the sites of (a) Heraklion, (b) Athens suburb, (c) Patra, (d) Volos, for the period 2003–2006 (for Heraklion 3-year period: 2003–2005).
ACPD
8, 11967–11996, 2008
Saharan dust levels in Greece and received inhalation doses C. Mitsakou et al. Title Page Abstract Introduction Conclusions References Tables Figures ◭ ◮ ◭ ◮ Back Close Full Screen / Esc
Printer-friendly Version Interactive Discussion Fig. 5. Normalized mass distribution as a function of particle diameter for the Greek sites.
ACPD
8, 11967–11996, 2008
Saharan dust levels in Greece and received inhalation doses C. Mitsakou et al. Title Page Abstract Introduction Conclusions References Tables Figures ◭ ◮ ◭ ◮ Back Close Full Screen / Esc
Printer-friendly Version Interactive Discussion
Figure 6
Fig. 6. Mass deposition rates in the human lung as a function of number of days per year for a