HAL Id: hal-00578529
https://hal.archives-ouvertes.fr/hal-00578529v2
Submitted on 4 Apr 2011
HAL is a multi-disciplinary open access
archive for the deposit and dissemination of
sci-entific research documents, whether they are
pub-lished or not. The documents may come from
teaching and research institutions in France or
abroad, or from public or private research centers.
L’archive ouverte pluridisciplinaire HAL, est
destinée au dépôt et à la diffusion de documents
scientifiques de niveau recherche, publiés ou non,
émanant des établissements d’enseignement et de
recherche français ou étrangers, des laboratoires
publics ou privés.
The multiple planets transiting Kepler-9 I. Inferring
stellar properties and planetary compositions
Mathieu Havel, Tristan Guillot, Diana Valencia, Aurélien Crida
To cite this version:
Mathieu Havel, Tristan Guillot, Diana Valencia, Aurélien Crida. The multiple planets transiting
Kepler9 I. Inferring stellar properties and planetary compositions. Astronomy and Astrophysics
-A&A, EDP Sciences, 2011, Kepler-9 paper I. �hal-00578529v2�
April 4, 2011
The multiple planets transiting Kepler-9
I. Inferring stellar properties and planetary compositions
Mathieu Havel
1
, Tristan Guillot
1
, Diana Valencia
1
,2
, and Aur´elien Crida
1
1 Universit´e de Nice-Sophia Antipolis, CNRS UMR 6202, Observatoire de la Cˆote d’Azur, B.P.
4229, 06304 Nice Cedex 4, France
2 Earth, Atmospheric and Planetary Sciences, MIT, 77 Massachusetts Ave, Cambridge, MA,
02139, USA
Revised article submitted to A&A and accepted, updated on April 4, 2011
ABSTRACT
The discovery of multiple transiting planetary systems offers new possibilities for characterising exoplanets and understanding their formation. The Kepler-9 system contains two Saturn-mass planets, Kepler-9b and 9c. Using evolution models of gas giants that reproduce the sizes of known transiting planets and accounting for all sources of uncertainties, we show that Kepler-9b (re-spectively 9c) contains 45+17
−12M⊕ (resp. 31
+13
−10M⊕) of hydrogen and helium and 35
+10
−15M⊕(resp.
24+10
−12M⊕) of heavy elements. More accurate constraints are obtained when comparing planets
9b and 9c: the ratio of the total mass fractions of heavy elements are Zb/Zc= 1.02 ± 0.14,
indi-cating that, although the masses of the planets differ, their global composition is very similar, an unexpected result for formation models. Using evolution models for super-Earths, we find that Kepler-9d must contain less than 0.1% of its mass in hydrogen and helium and predict a mostly rocky structure with a total mass between 4 and 16 M⊕.
Key words.Star: individual: Kepler-9; (Stars:) planetary systems; Planets and satellites: physical evolution
1. Introduction
Although much progress has been made since the discovery of the first transiting exoplanet, under-standing their composition, evolution, and formation has remained elusive. One longunder-standing prob-lem has been that a significant fraction of close-in exoplanets are inflated compared to what the-oretical models predict (Bodenheimer et al. 2001;Guillot & Showman 2002;Baraffe et al. 2003;
Guillot et al. 2006;Burrows et al. 2007;Guillot 2008;Miller et al. 2009). As a consequence, the global composition that may be derived from size and mass measurements of a given planet is in-trinsically model-dependent. This implies that, thus far, constraints from the compositions and their consequences in terms of planet formation models have only been grasped in a statistical way (e.g.
Ida & Lin 2008;Mordasini et al. 2009), not from any analysis of individual planetary systems. The discovery of the multiple system of transiting planets around Kepler-9 (Holman et al. 2010) opens a new window characterisation of exoplanets and on understanding their formation. The
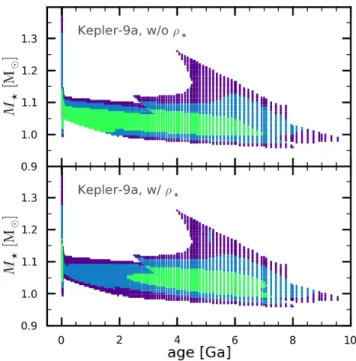
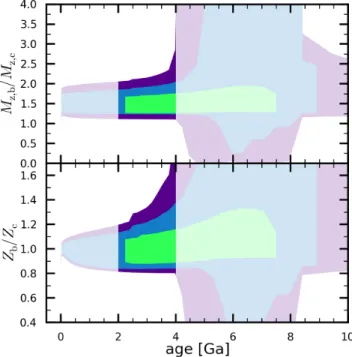
Fig. 1. Constraints derived from stellar evolution models on the mass of Kepler-9a as a function of its age. The dots correspond to solutions that fit the input constraints at the 68.3%, 95.4% (blue), and 99.7% levels (purple). The upper panel uses Teff and log g as inputs constraints. The lower
panel in addition uses the constraint on the stellar mean density.
system consists of two Saturn-size planets with 19.2 and 38.9 day orbital periods and a likely super-Earth candidate with a 1.6 day orbit (Torres et al. 2010). The advantage of this system is that the planets and the star share the same age within a few million years, therefore we can constrain the composition of one giant planet much more accurately relative to the other. These two planets are also in a 2:1 mean motion resonance which means that their dynamical history is strongly constrained. Altogether, this implies that a detailed scenario of the formation and the dynamical and physical evolution of the complete system may be obtained. In this first article, we focus on the compositional constraints obtained for the three planets in the system.
Given that the largest uncertainties in the parameters of transiting planets arise from the uncer-tainties in the star (eg.Sozzetti et al. 2007;Torres et al. 2008), we first derive the stellar properties (section 2). We subsequently infer the compositions of the two confirmed giant planets (section 3) and model the possible composition for the small planet candidate, Kepler-9d in section 4. We finish by discussing the implications of our results.
2. Kepler-9a, a solar-like star
According toHolman et al.(2010), Kepler-9a, the host star of the system is a solar-like star, with an estimated mass of 1.0 ± 0.1 M⊙and radius of 1.1 ± 0.09 R⊙. Spectroscopic measurements give a Teff of 5777 ± 61 K and a super-solar metallicity [Fe/H] of 0.12 ± 0.04 dex. The star is slightly
more active than our Sun, with a rotation period of 16.7 days, implying an age of 2 to 4 Ga from gyrochronology (Barnes 2007;Holman et al. 2010).
We chose to re-examine the constraints on the stellar parameters with the approach described in Guillot & Havel(2010). We used the measured effective temperature and surface gravity as
constraints for the evolution models. Alone, these constraints are relatively weak compared to what is achieved for other stars with transiting systems, because the stellar density obtained from photometric measurement is not provided directly byHolman et al.(2010), probably because the analysis is complex. However, it may be obtained from the estimate of the planetary semi-major axis, orbital period, and the inferred stellar radius (eg. seeBeatty et al. 2007). Our adopted final value for the density of Kepler-9a, ρ⋆= 0.79 ± 0.19ρ⊙was obtained from the constraints provided by the two giant planets, with the error estimated as the quadratic mean of the two values.
Using a grid of stellar evolution models calculated with CESAM (Morel & Lebreton 2008), we determined all combinations of stellar mass, age, and metallicity that match the constraints. We first calculated solutions using only the constraints obtained from effective temperature and gravity. Assuming Gaussian errors for both quantities, we derived three ellipses corresponding to probabilities of occurrence of 68.3% (1σ), 95.4% (2σ), and 99.7% (3σ), respectively. The ensem-ble of solutions that fall within these values is represented with colour-coded dots inFigure 1(top panel). After restricting ourselves to the “2σ” solutions, we see that the stellar mass is constrained to lie within 1.0 and 1.1M⊙, but that the age constraint is extremely weak (only ages > 8 Ga are excluded). Adding the stellar density constraints (Figure 1bottom panel) yields a tighter constraint on the stellar age, but very similar results in mass. The corresponding stellar parameters of this case are summarised as a function of age inTable 1. With the 2-4 Ga age range obtained from gy-rochronology, we obtain a stellar mass M⋆ = 1.05 ± 0.03 M⊙and radius R⋆ = 1.05 ± 0.06 R⊙, in good agreement withHolman et al.(2010).
3. Modelling the giant planets Kepler-9b and Kepler-9c
3.1. Methodology
The characteristics of the two giant planets derived byHolman et al. (2010) are Mp = 80.1 ±
4.1 M⊕, Rp = 9.44 ± 0.77 R⊕for Kepler-9b, and Mp = 54.7 ± 4.1 M⊕, Rp = 9.22 ± 0.75 R⊕ for Kepler-9c. We derived zero-albedo equilibrium temperatures (seeSaumon et al. 1996) of Teq= 780
K and Teq= 620 K for the two planets, respectively1.
Since the semi-amplitude of the radial velocity measurements is not provided byHolman et al.
(2010), and the eccentricity of the planet’s orbits is not well constrained, we choose to not derive the planetary mass again and use the above-mentioned values. We note that a 10-15% change in the total mass (equivalent to ∼ 2σ of the quoted error) of the planet induces an uncertainty on the modelled radius of 3-4%, a relatively significant value. Further analysis of photometric and radial-velocity measurements should therefore allow the derivation of tighter constraints on the planetary mass and therefore planetary composition than possible with the data at our disposal.
On the other hand, we do use the known radii ratios provided by transit light curves (kb =
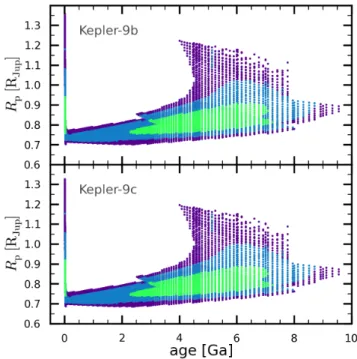
Rp, b/R⋆= 0.07885 ± 0.00081 and kc= Rp, c/R⋆= 0.07708 ± 0.00080, respectively for Kepler-9b and Kepler-9c) and our results for the stellar radius (with the constraint on the stellar density) to compute the radius of each planet as a function of the age, propagating all sources of uncertainties. In the 2-4 Ga age range, we find that the two planets have radii Rp, b= 56800+3900−2500km and Rp, c=
55800+3600−2900km, respectively (seeFigure 2).
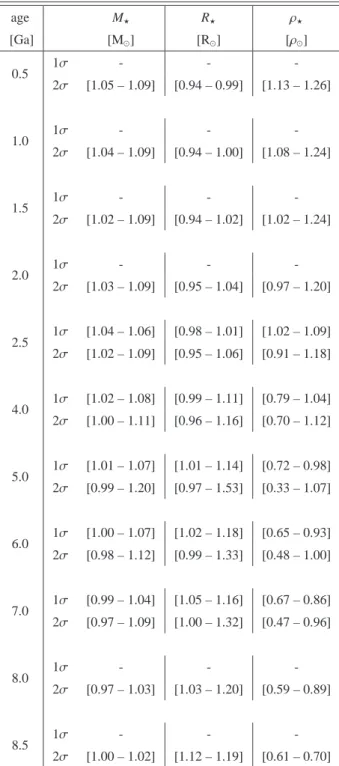
age M⋆ R⋆ ρ⋆ [Ga] [M⊙] [R⊙] [ρ⊙] 0.5 1σ - - -2σ [1.05 – 1.09] [0.94 – 0.99] [1.13 – 1.26] 1.0 1σ - - -2σ [1.04 – 1.09] [0.94 – 1.00] [1.08 – 1.24] 1.5 1σ - - -2σ [1.02 – 1.09] [0.94 – 1.02] [1.02 – 1.24] 2.0 1σ - - -2σ [1.03 – 1.09] [0.95 – 1.04] [0.97 – 1.20] 2.5 1σ [1.04 – 1.06] [0.98 – 1.01] [1.02 – 1.09] 2σ [1.02 – 1.09] [0.95 – 1.06] [0.91 – 1.18] 4.0 1σ [1.02 – 1.08] [0.99 – 1.11] [0.79 – 1.04] 2σ [1.00 – 1.11] [0.96 – 1.16] [0.70 – 1.12] 5.0 1σ [1.01 – 1.07] [1.01 – 1.14] [0.72 – 0.98] 2σ [0.99 – 1.20] [0.97 – 1.53] [0.33 – 1.07] 6.0 1σ [1.00 – 1.07] [1.02 – 1.18] [0.65 – 0.93] 2σ [0.98 – 1.12] [0.99 – 1.33] [0.48 – 1.00] 7.0 1σ [0.99 – 1.04] [1.05 – 1.16] [0.67 – 0.86] 2σ [0.97 – 1.09] [1.00 – 1.32] [0.47 – 0.96] 8.0 1σ - - -2σ [0.97 – 1.03] [1.03 – 1.20] [0.59 – 0.89] 8.5 1σ - - -2σ [1.00 – 1.02] [1.12 – 1.19] [0.61 – 0.70]
Table 1. Derived stellar parameters at 68.3% and 95.4% level of confidence (green and blue regions respectively, inFigure 1).
In principle, the knowledge of both mass and size should allow a direct determination of the planetary compositions. However, several additional uncertainties have to be taken into ac-count. A first uncertainty in the modelling concerns the atmospheric boundary condition to be used. In particular, the temperature of the deep atmosphere that is used as a boundary condi-tion for the interior models depends on the greenhouse factor γ−1, i.e. the ratio between
in-frared and visible mean opacities that will depend on unknown factors such as precise com-position, cloud coverage and atmospheric dynamics (Hansen 2008; Guillot 2010). On the
ba-Fig. 2. Constraints derived from stellar evolution models on the radius of Kepler-9b (upper panel) and Kepler-9c (lower panel) as a function of its age. We use 1 Rjup = 71, 492 km. See Figure 1
for colour coding. These results use solutions presented in lower panel ofFigure 1, ie. with the constraint on the stellar density.
sis of detailed radiative transfer calculations (Fortney et al. 2008;Spiegel et al. 2009), we adopt two extreme possibilities that are scaled as a function of Teq, the zero-albedo equilibrium
tem-perature of the planet: either a low value γ−1 = 1.7(T
eq /2000 K)−1/2 or a much higher one
γ−1 = 2.5(Teq /2000 K)−2. Another significant source of uncertainty is related to the inflation
of close-in exoplanets over what standard models predict, for which several explanations have been put forward (e.g. Bodenheimer et al. 2001;Guillot & Showman 2002;Guillot et al. 2006;
Chabrier & Baraffe 2007;Burrows et al. 2007;Guillot 2008;Laine et al. 2008;Miller et al. 2009;
Ibgui et al. 2009; Batygin & Stevenson 2010; Perna et al. 2010). On the basis of both attempts to fit the ensemble of known transiting planets (Guillot et al. 2006; Guillot 2008) and models for the generation and dissipation of atmospheric kinetic energy generated by the stellar heat-ing (Guillot & Showman 2002;Showman & Guillot 2002;Batygin & Stevenson 2010;Perna et al. 2010), we assume that heat is dissipated in the planet proportionally to its irradiation level. We choose two models: either no heat is dissipated or a fraction (0.25%) of the incoming stellar heat is dissipated at the centre of the planet, as required to reproduce the sizes of known transiting exo-planets (Guillot et al. 2006;Guillot 2008). When doing so, we assume equilibrium temperatures are fixed, and thus do not propagate the uncertainties on the stellar parameters to the irradiation levels of the planets, but this is clearly a weaker effect compared to uncertainties e.g. on the atmospheric models. Then, using the same approach as inGuillot & Havel(2010), we calculate grids of evo-lution models for Kepler-9b and 9c using CEPAM Guillot & Morel(1995) for hydrogen-helium planets with various core masses for all relevant total masses, atmospheric boundary conditions and assumptions regarding heat dissipation. Although the core hypothesis is used for simplicity, we cannot distinguish between heavy elements embedded in a central core or mixed throughout
the envelope. The difference is expected to be smaller than other sources of uncertainty considered here (Baraffe et al. 2008).
The ensemble of possible compositions is obtained from a comparison between model results and constraints on inferred planetary sizes and ages (Guillot & Havel 2010): with a given set of assumptions for the Mb, Mc, atmospheric model and dissipation value, we obtain values of MZ,b and MZ,cmatching the age and Rb, Rcvalues (when a solution exists). Overall, we associate values
of MZ,b, MZ,c, Zb, Zc, MZ,b/MZ,c, Zb/Zcto each solution of the stellar evolution (given observational
constraints), for the given choices of kb, kc, Mb, Mc, atmospheric model, or dissipation value.
To assess the quality of the solutions, we first identify which stellar models match the stellar constraints within 1, 2, and 3σ by assuming independent Gaussian errors for the stellar density and effective temperature. We calculate planetary solutions for the different extreme atmospheric boundary conditions and dissipation rates using fiducial values for the planetary masses and pho-tometric k values. We then account for the uncertainty on the planetary masses and phopho-tometric k values by adding models in which these quantities have been modified by 1, 2, and 3σ from their mean value, respectively. Therefore, to estimate the uncertainties, we consider that 1σ solutions are obtained from the ensemble of points including 1σ stellar evolution solutions with mean val-ues of (kb, kc, Mb, Mc) and 1σ stellar evolution solutions, which in turn (kb, kc, Mb, Mc) has been
changed by ±1σ. Solutions at 2σ (resp. 3σ) are obtained from the ensemble of points including 2σ (resp. 3σ) stellar evolution solutions with mean values of (kb, kc, Mb, Mc) and 1σ stellar evolution
solutions in which (kb, kc, Mb, Mc) have been changed by ±2σ (resp. ±3σ). We always consider
the two possibilities for the atmospheric models and for the dissipation value.
To assess the magnitude of the different contributions to the global uncertainty in the solutions, we compared the range of solutions ∆YXnσ(τ) obtained for each given age τ when only one given parameter X (stellar parameters, kb, kc, Mb, Mc, atmospheric model, dissipation value) is changed
by ±nσ to the total nσ uncertainty ∆Ynσ(τ). We note
fXnσ(Y, τ) = ∆YXnσ(τ)/∆Ynσ(τ),
where Y is any of MZ,b, MZ,c, Zb, Zc, MZ,b/MZ,c, Zb/Zc.
3.2. Results
The overall results are presented for representative age values and for each of MZ,b, MZ,c, Zb, Zc,
MZ,b/MZ,c, Zb/Zc, in Tables2to7(online material). The fraction (in percent) of the uncertainty on
the stellar parameters is denoted f⋆. The uncertainties on both kband kchave been combined into a
value fkand similarly for those on MZ,band MZ,c, denoted fMtot. The two atmospheric models and two dissipation models are treated like the other errors ( fatmand fdiss, respectively), but of course
their contribution ∆Ynσ
X (τ) is always the same regardless of nσ. The values of fatmand fdissin Tables
2-7thus become progressively lower from 1σ, to 2σ, and to 3σ solutions.
Tables 2 to7show that, in the 2-4 Ga age range, the solutions are generally well behaved. When adding the f values linearly, we obtain on average 77% of the total error. When summing them quadratically, this mean value is 44%. This indicates that our method probably overestimates the errors, but we believe that the treatment is adequate given the intrinsic difficulty in combining observational uncertainties to model uncertainties.
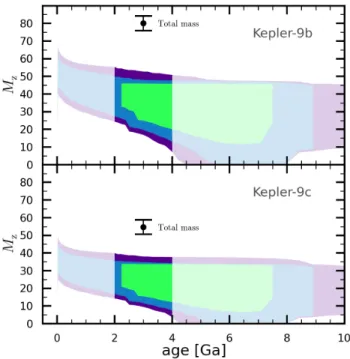
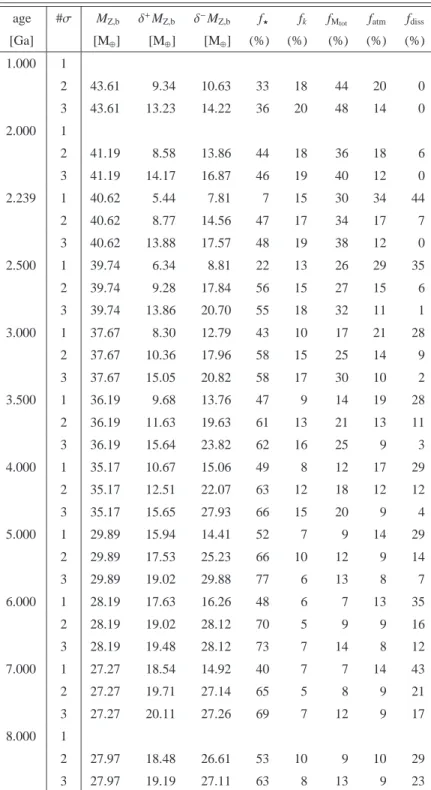
Fig. 3. Constraints derived from stellar and planetary evolution models on the mass of heavy el-ements present in planets Kepler-9b (top) and Kepler-9c (bottom) as a function of their age. The areas correspond to the ensemble of models that fit the constraints within 1σ (green), 2σ (blue), and 3σ (purple). The 2-4 Ga age range is highlighted because it is strongly favoured by gyrochronol-ogy. The error bar on each panel represents the total mass of the corresponding planet and its 1σ uncertainty.
One can note that, for ages beyond 4 Ga, the solutions for the planet parameters become less constrained. This is due both to the increased number of solutions for the stellar parameters and to the existence of solutions matching the planetary constraints with very low MZvalues, particularly when considering the ratios MZ,b/MZ,cand Zb/Zc.
Figure 3shows the resulting heavy elements content in Kepler-9b and 9c as a function of age. The two planets are found to be made of hydrogen and helium and heavy elements in relatively similar proportions. The total masses of heavy elements needed to reproduce the observed plane-tary sizes depend on the assumed age: higher masses are required in younger systems, while pure hydrogen-helium solutions are possible for older ages and no heat dissipation assumed. Given the 2-4 Ga age constraint, however, the ensemble of possibilities is limited to values of MZ,b= 35+10−15M⊕ and MZ,c = 24+10−12M⊕ when considering 1σ solutions. The constraints must be taken with care because the ensemble of solutions has a non-Gaussian behaviour. The values provided here over-estimate slightly the ensemble of solutions at 3σ (see Online Material for complete solutions).
When considering the planets independently, the ratio of heavy elements to total mass of the planets are loosely bounded (Zb/Zc= 0.67 to 1.81 for 1σ solutions). However, much tighter
con-straints are obtained when comparing the two planets because the solutions are less sensitive to errors on the stellar radius and mass. Given the similarity in mass, irradiation level, and composi-tion of the two planets, we also assume that the same class of model holds and that the two planets are affected in the same way by heat dissipation mechanisms. As shown inFigure 4, we thus find that Kepler-9b contains 1.50 ± 0.24 times more heavy elements in mass than Kepler-9c. Strikingly,
Fig. 4. Constraints on the ratios of the masses of heavy elements MZ,b/MZ,c(top) and of the total mass fractions of heavy elements Zb/Zc(bottom) in Kepler-9b versus Kepler-9c. The colours have
the same meaning as inFigure 3.
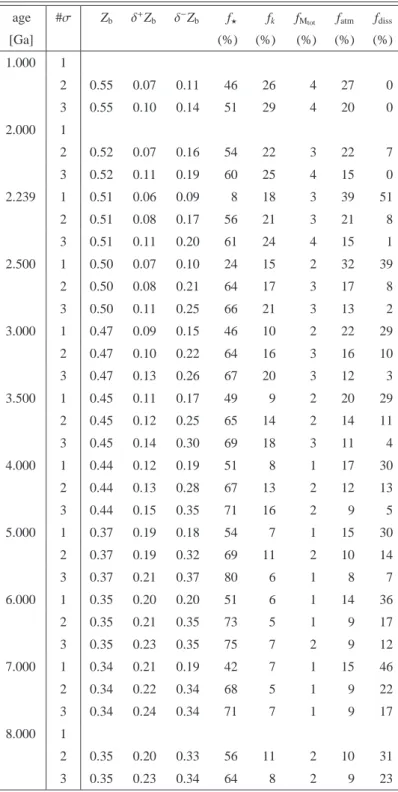
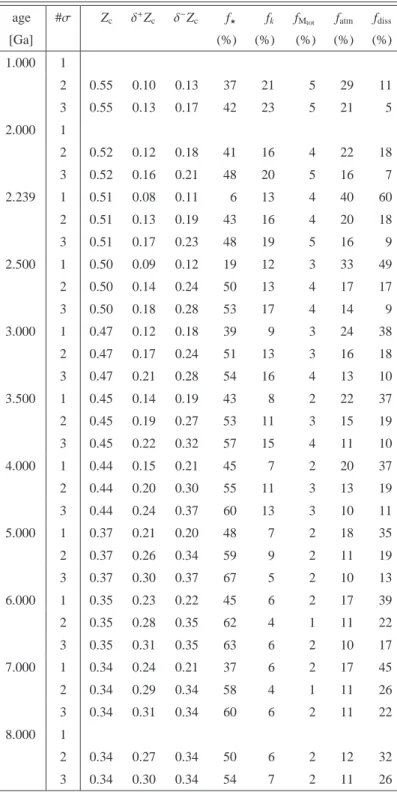
the two planets appear to have the same global composition as indicated by a similar ratio of mass of heavy elements to total planetary mass Zb/Zc= 1.02 ± 0.14.
To assess the importance of the different measurements/modelling hypotheses, we compare results obtained by assuming only one source of uncertainty at a time to the global results. We find that the present uncertainties on MZ and Z for both planets mostly stem from uncertainties on the stellar parameters (∼50% of the total error) and assumed dissipation rates (∼30%). When considering the ratios of these quantities, i.e. MZ,b/MZ,cand Zb/Zc, the contribution by the stellar
parameters’ uncertainties is strongly suppressed (to less than ∼10%). In the case of MZ,b/MZ,c, the dominant uncertainties are then those on the planetary masses (∼60%), on the k values (∼30%), and on dissipation (∼30%). In the case of Zb/Zc, the dominant uncertainties are due to the k
val-ues (∼40%), dissipation (∼30%), with less of an effect on the planetary masses (∼10%). Further measurements from Kepler and from ground-based radial velocimetry will be extremely valuable in reducing the uncertainties on the stellar density, planetary masses, and k values.
4. Modelling the possible super-Earth Kepler-9d (KOI-377)
Kepler-9d cannot be compared with the same method as its sister planets b and c, both because of its different nature and because of its undetermined mass. For this planet, we combined internal structure models developed for solid planets to models of gaseous models (Valencia et al. 2010). We considered two types of planets: rocky planets with different amounts of iron and volatile planets. For the latter we assumed the planets to be differentiated into a solid nucleus of terrestrial composition (a silicate mantle above an iron core), overlaid by a gaseous envelope composed of either hydrogen and helium, or water. Because the equilibrium temperature we estimate for
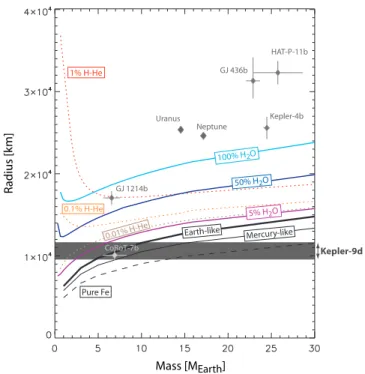
Kepler-Ra d ius [k m ] 100% H2O Earth-like Uranus Neptune GJ 1214b CoRoT-7b GJ 436b Kepler-4b HAT-P-11b Kepler-9d Mass [MEarth] 0.01% H-H e 0.1% H-He 1% H-He 5% H2O 50% H2O Mercury-like Pure Fe
Fig. 5. Mass-radius relations for different compositions of Kepler-9d. For the rocky scenarios: a pure iron planet (dashed black), a mercury-like planet – 35% silicate mantle above a 65% iron core (thin black), an earth-like planet – 63% silicate mantle above a 33% iron core (thick black). For the gaseous compositions: an earth-like nucleus covered by an H-He envelope of 0.01% (dotted brown), 0.1% (dotted orange), and 1% (dotted red) by mass; or covered by a water envelope of 5% (solid purple) and 50% (solid dark blue) by mass, or a pure 100% water-vapor planet (solid light blue). The radius range for Kepler-9d (grey band) suggests the planet has no considerable H-He. A physically plausible upper limit for the mass is 16 M⊕. Transiting exoplanets in a similar mass-radius range, as well as Uranus and Neptune, are shown for reference.
9d (Teq ∼1800 − 2200 K) is well above the critical temperature of water, the water in the envelope
is in a fluid form.
Figure 5shows the results. Given the size of Kepler-9d, the amount of hydrogen and helium present would be less than 0.1% by mass. Owing to the proximity to the star, this atmosphere would be very vulnerable to escape, thus yielding a scenario for only hydrogen and helium that is practically unfeasible, as obtained for CoRoT-7b (Valencia et al. 2010). On the other hand, this can be a water-vapour planet with volatiles making up less than 50% by mass.
Alternatively, the composition may be rocky, for which the mass range corresponding to the radius will depend on the amount of iron. The values are 4 − 7M⊕ for a planet with little or no iron (i.e. a super-Moon), 5 − 11M⊕ for a terrestrial composition (iron core is 33% by mass), 7 − 16M⊕ for a super-Mercury composition (iron core is 65% by mass), and up to 30M⊕ if made of pure iron. While it is quite unlikely for a planet to be composed only of iron, the precise amount is unknown. If Mercury’s high iron content is used as a proxy, a reasonable upper limit to the mass of Kepler-9d is 16M⊕.
5. Conclusion
In this paper, we combined stellar and planetary evolution models to constrain the star and planets in the Kepler-9 system in a homogeneous way. We showed that the two Saturn-like gas giants contain a relatively significant fraction of heavy elements in their interior (MZ,b = 35+10−15M⊕ and MZ,c = 24+10−12M⊕ ) and that the close-in super-Earth most probably contains no hydrogen and helium, because the low allowed mass fraction (< 0.01%) would have been rapidly blown away.
Comparing the two planets Kepler-9b and 9c led us to derive tight constraints on the ratios of heavy elements in these planets, i.e. Zb/Zc= 1.02 ± 0.14. This is surprising because accretion
mod-els predict a faster accretion of hydrogen and helium and thus a lower Z value for the first formed, most massive planet (e.g.Hori & Ikoma 2010). These two planets are also highly interesting be-cause they are in a 2:1 mean motion resonance, as are several other known exoplanetary planets. Their orbital properties generally imply an early migration in the presence of an inner-gas disc to damp any eccentricities (Crida et al. 2008).
Detailed studies of the formation and migration of the entire Kepler-9 planetary system thus should shed light on the mechanisms responsible for planetary formation.
Acknowledgements. We acknowledge the support of the Programme National de Plan´etologie and of CNES. Computations
have been done on the Mesocentre SIGAMM machine, hosted by the Observatoire de la Cˆote d’Azur.
References
Baraffe, I., Chabrier, G., & Barman, T. 2008, Astron. & Astrophys, 482, 315
Baraffe, I., Chabrier, G., Barman, T. S., Allard, F., & Hauschildt, P. H. 2003, Astron. & Astrophys, 402, 701 Barnes, S. A. 2007, ApJ, 669, 1167
Batygin, K. & Stevenson, D. J. 2010, ApJ, 714, L238
Beatty, T. G., Fernandez, J. M., Latham, D. W., et al. 2007, ApJ, 663, 573 Bodenheimer, P., Lin, D. N. C., & Mardling, R. A. 2001, ApJ, 548, 466
Burrows, a., Hubeny, I., Budaj, J., & Hubbard, W. B. 2007, The Astrophysical Journal, 661, 502 Chabrier, G. & Baraffe, I. 2007, ApJ, 661, L81
Crida, A., S´andor, Z., & Kley, W. 2008, Astron. & Astrophys, 483, 325
Fortney, J. J., Lodders, K., Marley, M. S., & Freedman, R. S. 2008, ApJ, 678, 1419 Guillot, T. 2008, Physica Scripta Volume T, 130, 014023
Guillot, T. 2010, Astron. & Astrophys, 520, A27+ Guillot, T. & Havel, M. 2010, ArXiv e-prints Guillot, T. & Morel, P. 1995, A&AS, 109, 109
Guillot, T., Santos, N. C., Pont, F., et al. 2006, Astronomy and Astrophysics, 453, L21 Guillot, T. & Showman, A. P. 2002, Astron. & Astrophys, 385, 156
Hansen, B. M. S. 2008, ApJS, 179, 484
Holman, M. J., Fabrycky, D. C., Ragozzine, D., et al. 2010, Science, 330, 51 Hori, Y. & Ikoma, M. 2010, ApJ, 714, 1343
Ibgui, L., Burrows, A., & Spiegel, D. S. 2009, Astrophysical Journal Ida, S. & Lin, D. N. C. 2008, ApJ, 673, 487
Laine, R. O., Lin, D. N. C., & Dong, S. 2008, ApJ, 685, 521
Miller, N., Fortney, J., & Jackson, B. 2009, The Astrophysical Journal, 702, 1413 Mordasini, C., Alibert, Y., Benz, W., & Naef, D. 2009, Astron. & Astrophys, 501, 1161 Morel, P. & Lebreton, Y. 2008, Ap&SS, 316, 61
Perna, R., Menou, K., & Rauscher, E. 2010, ApJ, 724, 313
Saumon, D., Hubbard, W. B., Burrows, A., et al. 1996, ApJ, 460, 993 Showman, A. P. & Guillot, T. 2002, Astron. & Astrophys, 385, 166
Sozzetti, A., Torres, G., Charbonneau, D., et al. 2007, ApJ, 664, 1190 Spiegel, D. S., Silverio, K., & Burrows, A. 2009, ApJ, 699, 1487 Torres, G., Fressin, F., Batalha, N. M., et al. 2010, ArXiv e-prints Torres, G., Winn, J. N., & Holman, M. J. 2008, ApJ, 677, 1324
Appendix A: Planetary parameters and main uncertainties for Kepler-9b and 9c
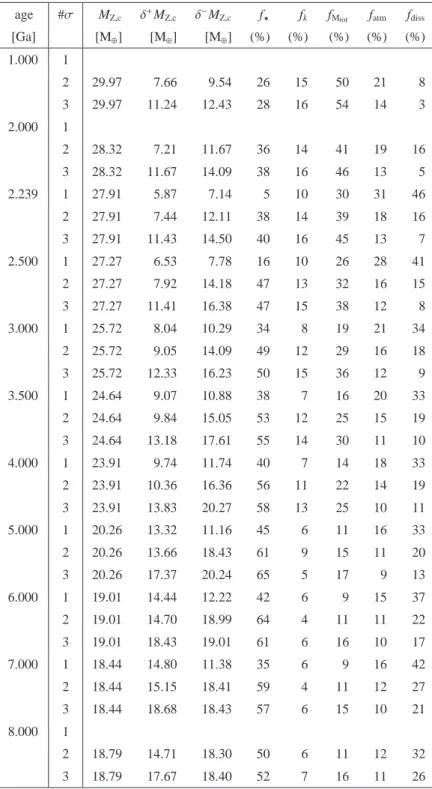
age #σ MZ,b δ+MZ,b δ−MZ,b f⋆ fk fMtot fatm fdiss
[Ga] [M⊕] [M⊕] [M⊕] (%) (%) (%) (%) (%) 1.000 1 2 43.61 9.34 10.63 33 18 44 20 0 3 43.61 13.23 14.22 36 20 48 14 0 2.000 1 2 41.19 8.58 13.86 44 18 36 18 6 3 41.19 14.17 16.87 46 19 40 12 0 2.239 1 40.62 5.44 7.81 7 15 30 34 44 2 40.62 8.77 14.56 47 17 34 17 7 3 40.62 13.88 17.57 48 19 38 12 0 2.500 1 39.74 6.34 8.81 22 13 26 29 35 2 39.74 9.28 17.84 56 15 27 15 6 3 39.74 13.86 20.70 55 18 32 11 1 3.000 1 37.67 8.30 12.79 43 10 17 21 28 2 37.67 10.36 17.96 58 15 25 14 9 3 37.67 15.05 20.82 58 17 30 10 2 3.500 1 36.19 9.68 13.76 47 9 14 19 28 2 36.19 11.63 19.63 61 13 21 13 11 3 36.19 15.64 23.82 62 16 25 9 3 4.000 1 35.17 10.67 15.06 49 8 12 17 29 2 35.17 12.51 22.07 63 12 18 12 12 3 35.17 15.65 27.93 66 15 20 9 4 5.000 1 29.89 15.94 14.41 52 7 9 14 29 2 29.89 17.53 25.23 66 10 12 9 14 3 29.89 19.02 29.88 77 6 13 8 7 6.000 1 28.19 17.63 16.26 48 6 7 13 35 2 28.19 19.02 28.12 70 5 9 9 16 3 28.19 19.48 28.12 73 7 14 8 12 7.000 1 27.27 18.54 14.92 40 7 7 14 43 2 27.27 19.71 27.14 65 5 8 9 21 3 27.27 20.11 27.26 69 7 12 9 17 8.000 1 2 27.97 18.48 26.61 53 10 9 10 29 3 27.97 19.19 27.11 63 8 13 9 23
age #σ MZ,c δ+MZ,c δ−MZ,c f⋆ fk fMtot fatm fdiss [Ga] [M⊕] [M⊕] [M⊕] (%) (%) (%) (%) (%) 1.000 1 2 29.97 7.66 9.54 26 15 50 21 8 3 29.97 11.24 12.43 28 16 54 14 3 2.000 1 2 28.32 7.21 11.67 36 14 41 19 16 3 28.32 11.67 14.09 38 16 46 13 5 2.239 1 27.91 5.87 7.14 5 10 30 31 46 2 27.91 7.44 12.11 38 14 39 18 16 3 27.91 11.43 14.50 40 16 45 13 7 2.500 1 27.27 6.53 7.78 16 10 26 28 41 2 27.27 7.92 14.18 47 13 32 16 15 3 27.27 11.41 16.38 47 15 38 12 8 3.000 1 25.72 8.04 10.29 34 8 19 21 34 2 25.72 9.05 14.09 49 12 29 16 18 3 25.72 12.33 16.23 50 15 36 12 9 3.500 1 24.64 9.07 10.88 38 7 16 20 33 2 24.64 9.84 15.05 53 12 25 15 19 3 24.64 13.18 17.61 55 14 30 11 10 4.000 1 23.91 9.74 11.74 40 7 14 18 33 2 23.91 10.36 16.36 56 11 22 14 19 3 23.91 13.83 20.27 58 13 25 10 11 5.000 1 20.26 13.32 11.16 45 6 11 16 33 2 20.26 13.66 18.43 61 9 15 11 20 3 20.26 17.37 20.24 65 5 17 9 13 6.000 1 19.01 14.44 12.22 42 6 9 15 37 2 19.01 14.70 18.99 64 4 11 11 22 3 19.01 18.43 19.01 61 6 16 10 17 7.000 1 18.44 14.80 11.38 35 6 9 16 42 2 18.44 15.15 18.41 59 4 11 12 27 3 18.44 18.68 18.43 57 6 15 10 21 8.000 1 2 18.79 14.71 18.30 50 6 11 12 32 3 18.79 17.67 18.40 52 7 16 11 26
age #σ Zb δ+Zb δ−Zb f⋆ fk fMtot fatm fdiss [Ga] (%) (%) (%) (%) (%) 1.000 1 2 0.55 0.07 0.11 46 26 4 27 0 3 0.55 0.10 0.14 51 29 4 20 0 2.000 1 2 0.52 0.07 0.16 54 22 3 22 7 3 0.52 0.11 0.19 60 25 4 15 0 2.239 1 0.51 0.06 0.09 8 18 3 39 51 2 0.51 0.08 0.17 56 21 3 21 8 3 0.51 0.11 0.20 61 24 4 15 1 2.500 1 0.50 0.07 0.10 24 15 2 32 39 2 0.50 0.08 0.21 64 17 3 17 8 3 0.50 0.11 0.25 66 21 3 13 2 3.000 1 0.47 0.09 0.15 46 10 2 22 29 2 0.47 0.10 0.22 64 16 3 16 10 3 0.47 0.13 0.26 67 20 3 12 3 3.500 1 0.45 0.11 0.17 49 9 2 20 29 2 0.45 0.12 0.25 65 14 2 14 11 3 0.45 0.14 0.30 69 18 3 11 4 4.000 1 0.44 0.12 0.19 51 8 1 17 30 2 0.44 0.13 0.28 67 13 2 12 13 3 0.44 0.15 0.35 71 16 2 9 5 5.000 1 0.37 0.19 0.18 54 7 1 15 30 2 0.37 0.19 0.32 69 11 2 10 14 3 0.37 0.21 0.37 80 6 1 8 7 6.000 1 0.35 0.20 0.20 51 6 1 14 36 2 0.35 0.21 0.35 73 5 1 9 17 3 0.35 0.23 0.35 75 7 2 9 12 7.000 1 0.34 0.21 0.19 42 7 1 15 46 2 0.34 0.22 0.34 68 5 1 9 22 3 0.34 0.24 0.34 71 7 1 9 17 8.000 1 2 0.35 0.20 0.33 56 11 2 10 31 3 0.35 0.23 0.34 64 8 2 9 23
age #σ Zc δ+Zc δ−Zc f⋆ fk fMtot fatm fdiss [Ga] (%) (%) (%) (%) (%) 1.000 1 2 0.55 0.10 0.13 37 21 5 29 11 3 0.55 0.13 0.17 42 23 5 21 5 2.000 1 2 0.52 0.12 0.18 41 16 4 22 18 3 0.52 0.16 0.21 48 20 5 16 7 2.239 1 0.51 0.08 0.11 6 13 4 40 60 2 0.51 0.13 0.19 43 16 4 20 18 3 0.51 0.17 0.23 48 19 5 16 9 2.500 1 0.50 0.09 0.12 19 12 3 33 49 2 0.50 0.14 0.24 50 13 4 17 17 3 0.50 0.18 0.28 53 17 4 14 9 3.000 1 0.47 0.12 0.18 39 9 3 24 38 2 0.47 0.17 0.24 51 13 3 16 18 3 0.47 0.21 0.28 54 16 4 13 10 3.500 1 0.45 0.14 0.19 43 8 2 22 37 2 0.45 0.19 0.27 53 11 3 15 19 3 0.45 0.22 0.32 57 15 4 11 10 4.000 1 0.44 0.15 0.21 45 7 2 20 37 2 0.44 0.20 0.30 55 11 3 13 19 3 0.44 0.24 0.37 60 13 3 10 11 5.000 1 0.37 0.21 0.20 48 7 2 18 35 2 0.37 0.26 0.34 59 9 2 11 19 3 0.37 0.30 0.37 67 5 2 10 13 6.000 1 0.35 0.23 0.22 45 6 2 17 39 2 0.35 0.28 0.35 62 4 1 11 22 3 0.35 0.31 0.35 63 6 2 10 17 7.000 1 0.34 0.24 0.21 37 6 2 17 45 2 0.34 0.29 0.34 58 4 1 11 26 3 0.34 0.31 0.34 60 6 2 11 22 8.000 1 2 0.34 0.27 0.34 50 6 2 12 32 3 0.34 0.30 0.34 54 7 2 11 26
age #σ MZ,b/MZ,c δ+MZ,b/MZ,c δ−MZ,b/MZ,c f⋆ fk fMtot fatm fdiss [Ga] (%) (%) (%) (%) (%) 1.000 1 2 1.47 0.34 0.23 1 27 88 8 17 3 1.47 0.53 0.35 1 30 88 5 11 2.000 1 2 1.47 0.38 0.24 3 33 86 9 18 3 1.47 0.58 0.36 3 36 86 5 11 2.239 1 1.48 0.20 0.21 0 23 64 15 29 2 1.48 0.39 0.24 4 34 85 9 18 3 1.48 0.60 0.36 3 38 86 5 11 2.500 1 1.48 0.21 0.22 1 23 62 14 28 2 1.48 0.42 0.24 6 40 82 9 18 3 1.48 0.64 0.37 5 47 84 6 11 3.000 1 1.49 0.23 0.23 6 26 59 14 27 2 1.49 0.43 0.26 8 43 81 9 18 3 1.49 0.67 0.38 7 52 82 5 11 3.500 1 1.50 0.24 0.24 9 28 58 15 26 2 1.50 0.48 0.26 11 50 78 9 17 3 1.50 0.77 0.39 10 69 80 6 10 4.000 1 1.50 0.26 0.24 11 30 57 15 26 2 1.50 0.55 0.27 15 58 75 9 16 3 1.50 2.08 0.41 10 86 42 3 5 5.000 1 1.58 0.25 0.31 18 35 54 15 23 2 1.58 2.34 0.39 18 76 33 3 5 3 1.58 158.46 1.58 21 78 22 0 0 6.000 1 1.60 0.34 0.31 25 42 51 15 18 2 1.60 191.56 1.34 8 73 54 0 0 3 1.60 191.56 1.55 8 73 54 0 0 7.000 1 1.69 0.24 0.40 22 43 53 17 17 2 1.69 110.30 1.08 10 14 88 0 0 3 1.69 302.37 1.68 31 55 21 0 0 8.000 1 2 1.65 197.99 0.69 1 15 97 0 0 3 1.65 198.07 1.46 9 79 89 0 0
age #σ Zb/Zc δ+Zb/Zc δ−Zb/Zc f⋆ fk fMtot fatm fdiss [Ga] (%) (%) (%) (%) (%) 1.000 1 2 1.00 0.10 0.14 2 45 10 14 27 3 1.00 0.14 0.16 3 58 11 11 21 2.000 1 2 1.00 0.14 0.16 5 47 12 13 26 3 1.00 0.20 0.19 5 61 13 9 19 2.239 1 1.00 0.08 0.11 0 34 11 22 42 2 1.00 0.15 0.16 6 48 12 12 25 3 1.00 0.21 0.19 6 62 14 9 19 2.500 1 1.00 0.09 0.12 2 32 10 20 40 2 1.00 0.19 0.17 9 51 12 11 23 3 1.00 0.28 0.20 8 68 13 8 16 3.000 1 1.01 0.11 0.13 8 34 10 19 36 2 1.01 0.21 0.17 10 54 13 11 22 3 1.01 0.33 0.21 9 70 13 8 15 3.500 1 1.01 0.12 0.13 11 36 10 19 34 2 1.01 0.27 0.18 13 57 13 10 20 3 1.01 0.50 0.21 12 77 13 6 12 4.000 1 1.02 0.14 0.13 14 38 11 19 32 2 1.02 0.36 0.18 16 61 13 9 17 3 1.02 1.43 0.23 10 88 8 3 5 5.000 1 1.07 0.15 0.17 22 42 12 17 27 2 1.07 1.60 0.26 18 76 10 3 5 3 1.07 108.16 1.07 21 78 15 0 0 6.000 1 1.08 0.24 0.16 28 47 13 17 21 2 1.08 119.62 0.91 9 80 48 0 0 3 1.08 119.62 1.05 9 80 48 0 0 7.000 1 1.14 0.17 0.22 25 48 14 19 19 2 1.14 63.74 0.73 12 16 86 0 0 3 1.14 206.39 1.14 31 55 14 0 0 8.000 1 2 1.11 114.58 0.46 2 18 97 0 0 3 1.11 120.91 0.98 10 89 83 0 0