The Development of Visualized Risk-Informed Tradespace
Exploration (vRITE) for R&D Investment Decision-Making
by
Samuel Adam Mahle United States Army Aviation
Bachelor of Science in Systems Engineering The United States Military Academy, 2017
Submitted to the Institute for Data, Systems, and Society in Partial Fulfillment of the Requirements for the Degree of
Master of Science in Technology and Policy at the
Massachusetts Institute of Technology June 2019
2019 Samuel A. Mahle All rights reserved
Signature redacted
S ignature o f A uthor.. ... ... .... ...Technology and Policy Program W
14AMav 2019
Certified by...Signature
redacted
-Donna H. Rhodes Principal Research Scientist, Sociotechnical Systems Research Center Director, Systems Engineering Advancement Research InitiativeThesisSlpervisor Certified by... Accepted by ... .. ... Associat Dep
JUN
10 2019
LIBRARIES
Siqinature redacted
Brenagl. McCarragher Director, Strategic Systems Charles Stark Draper Laboratory Thesis AdvisorSignature redacted
Noelle E. Selin Director, Technology and Policy Program Professor, Institute for Data, Systems and Society and artment of Earth, Atmospheric, and Planetary Sciences
THE DEVELOPMENT OF VISUALIZED RISK-INFORMED TRADESPACE EXPLORATION (vRITE) FOR R&D INVESTMENT DECISION-MAKING
by
Samuel Adam Mahle
Submitted to the Institute for Data, Systems, and Society in Partial Fulfillment of the Requirements for the Degree of Master of Science in Technology and Policy
Abstract
Uncertainty and risk are endemic in research and development (R&D) programs. Managing risks is a pivotal step at all phases of system design, but is particularly important at the beginning phases where system designers attempt to assess many design alternatives before the systems is developed and deployed. Designing systems that mitigate risks or are flexible enough to withstand them can lead to more reliable and valuable systems. If decision-makers believe the risks are too high, they may not invest in a technology that would provide the capabilities they need. Alternatively, if they underestimate the risks of a technology, investment may lead to costly and embarrassing overruns. Unfortunately, the existing approaches that decision-makers use to help them understand their options are often inadequate and do not tell the full story. In practice, overly simplistic methods can lead to arbitrary analysis, while more complex techniques such as NASA's probabilistic risk assessment procedure can be too costly and time-consuming for the fast-moving R&D context. These shortfalls can lead to results that decision-makers do not trust and ultimately ignore, leading to decisions based on gut-feelings or hunches.
In addition to these shortfalls, there exist gaps between the theory upon which many decision methods and their results are based; several researchers have pointed out computational weaknesses in risk matrices, one of the most widely-employed risk assessment tools. Simply put, the decision-making tools that exist today may not be adequate. Moreover, many risk assessments are conducted secondary to initial tradeoff analysis, resulting in suboptimal design decisions that do not account for risks from the beginning.
In R&D programs, decision-makers require a human-centric method of modeling and communicating the benefits, costs, and risks associated with various technologies. This research develops a framework for conducting Visualized Risk-Informed Tradespace Exploration (vRITE) based on insights gained from practicing R&D program managers. vRITE provides decision-makers an interactive, human-centric analysis of the cost, schedule, performance, and risk associated with multiple technologies. Two example vRITE analyses are used illustrate how the framework addresses the real-world objective and subjective considerations that decision-makers care about most and allows them to explore the data, helping them identify which technology warrants investment. The information provided in a vRITE analysis can reduce the barriers to R&D investment and ultimately lead to more risk-informed decision-making.
Thesis Supervisor: Donna H. Rhodes
Acknowledgements
I would like to thank Dr. Donna Rhodes for her seemingly endless amount of patience and reassurance, as well as valuable guidance throughout the process of writing this thesis, as well as Dr. Brenan McCarragher for pushing me to think beyond the literature and theory and challenging me to consider why my research mattered, something I told him was important to me from the beginning. I owe both of them a great deal of gratitude not only for providing me the opportunity to conduct research with them in the first place, but also for sharing their vast amount of real-world experience with me along the way. I probably got more out of our conversations than I did my actual thesis, so thank you for helping me grow and learn these past two years.
I also want to thank everyone at MIT who supported me each day, including my TPP family for making MIT enjoyable, as well as Ray and Arthur for their willingness to answer my many questions about my research, the Army, and life.
Finally, I would like to thank my friends and family who helped me get here in the first place. I would not have had the opportunity to study at MIT if it were not for the patience and support of my two roommates at West Point, Shawn and Angel, who put up with my endless complaining and encourage me to apply. My parents and sister have always been there to support me no matter what, and instilled in me from a young age the belief that I am capable of doing big things. MIT was one of those. Most importantly, I would be hopelessly lost without the astonishing support of my best friend, confidant, and wife, Kate. Thank you for being willing to move here to be with me, for your patience in this first year of marriage, and for letting me vent when I needed it. Your work ethic is an incredible source of pride for me, and you push me to be better every single day. I can only attempt to support in your MSW program as much as you have supported me over the past two years, but I promise that I will do my best.
Table of Contents
ABSTRACT ... 3
ACKNOW LEDGEM ENTS ... 4
TABLE O F CONTENTS ... 5 LIST OF FIGURES ... 8 LIST OF TABLES... 10 S INTRODUCTION... 11 1.1 M O T IV A TIO N ... 1 1 1.2 RESEARCH QUESTIONS ... 12 1.3 S C O P E ... 12 1.4 RESEARCH APPROACH ... 13 1.5 RESEARCH CONTRIBUTION ... 14 1.6 STRUCTURE OF THESIS... 14
2 DECISION-MAKING IN THE R&D PROGRAMS... 17
2.1 THE R&D ENTERPRISE ... 17
2.1.1 The Importance of R&D ... 18
2.1.2 Impacts of a New Technology ... 20
2.1.3 Decreasing Barriers to R&D Investment... 22
2.1.4 M easuring Progress of an R&D project... 22
2.2 DESIGNING FOR SENIOR-LEVEL DECISION-MAKERS ... 23
2.3 M AKING VALUE-BASED DECISIONS ... 25
2.4 UTILITY THEORY ... 26
2.4.1 Subjectivity in Utility Theory ... 27
2.4.2 M ulti-Attribute Utility Theory ... 27
2.5 TRADEOFF ANALYSIS... 29
2.5.1 M ulti-Attribute Tradespace Exploration... 30
2.5.2 Epoch-Era Analysis ... 33
2.6 RISK AND UNCERTAINTY ... 34
2.6.1 M easuring the Effects of Risk and Uncertainty ... 35
2.6.2 The Distinction Between Risk and Uncertainty ... 36
2.7 EXISTING RISK ASSESSMENT M ETHODS ... 37
2 .7.1 R isk M a trices ... 3 7 2.7.2 Decision Analysis Trees ... 40
2.7.2.1 A method of incorporating risk into decision analysis ... 41
2.7.3 NASA Probabilistic Risk Assessment (PRA)... 43
2.7.4 RAND Corporation Risk-Informed Trade Analysis Model... 44
2.7.5 Other Risk Assessment M ethods ... 47
2.8 VISUALIZATION OF DECISIONS... 49
2 .9 S U M M A R Y ... 5 1 3 PERSPECTIVES FROM PRACTICING SENIOR LEVEL DECISION-MAKERS.. 53
3.1 DESCRIPTION OF SENIOR-LEVEL DECISION-MAKERS... 54
3.2 INSIGHTS G AINED FROM D ISCUSSIONS... 55
3.2.1 M easuring B enefit... 56
3.2.2 R isk and U ncertainty... 58
3.2.2.1 Risk matrices- practical shortfalls of the most common risk assessment tool.. 61
3.2.2.2 Characterizing R isk Events... 62
3.2.2.3 R isk Preferences... 63
3.2.2.4 Using "Confidence" as an indicator of risk preference ... 65
3.2.2.5 Identifying an appropriate method for risk assessment in R&D... 65
3.3 CONCLUSIONS RELATED TO THE vRITE FRAMEWORK ... 66
4 ELEMENTS OF VISUALIZED RISK-INFORMED TRADESPACE EXPLORATION (V R IT E)... 69
4.1 DESCRIPTION OF DEMONSTRATION CASE -SPACE TUG ... 70
4.1.1 Constructing the Baseline Tradespace ... 71
4.1.1.1 Performance Attributes of Space Tug... 71
4.1.1.2 Single-A ttribute U tility Curves... 74
4.1.1.3 M ulti-A ttribute Utility Function ... 75
4.1.1.4 Analysis with the baseline tradespace... 76
4.2 INTRODUCING A NEW TECHNOLOGY INTO THE SYSTEM... 78
4.2.1 Determining the SA U Scores of New Technologies ... 78
4.2.2 Updating the MA U Function to Reflect the Value of New Technology ... 80
4.3 ACCOUNTING FOR UNCERTAINTY IN THE DEVELOPMENT PROCESS ... 80
4.3.1 U ncertainty in C ost... . 8 1 4.3.2 U ncertainty in Schedule ... 85
4.3.2.1 The Relationship Between Cost and Schedule ... 86
4.3.3 Uncertainty in Perform ance ... 86
4.4 ACCOUNTING FOR UNCERTAINTY IN CONTEXT ... 87
4.4.1 Characterization and Weighting of Varying Missions... 88
4.4.2 Measuring System Value Given Uncertain Contexts ... 90
4.5 COMMUNICATING AND INTERPRETING RESULTS... 91
5 CONDUCTING A VRITE ANALYSIS... 97
5.1 STEPS IN A vR ITE A NALYSIS... 97
5.2 EXAM PLE SCEN ARIO ... 97
5.2.1 Step 1: Set Initial Parameters and Thresholds ... 98
5.2.2 S tep 2 : S et F ilters... 100
5.2.3 Step 3: E xp lore R esults ... 102
5.3 MAKING AN INVESTMENT DECISION BASED ON THE vRITE ANALYSIS... 106
6 VRITE ANALYSIS OF THE MULTI-OBJECT KILL VEHICLE (MOKV) BALLISTIC MISSILE DEFENSE SYSTEM ... 109
6.1 DESCRIPTION OF UNITED STATES BALLISTIC MISSILE DEFENSE... 109
6.1.1 Advancem ents in M issile D efense... 110
6.1.2 Requirements of Missile Defense Systems ... 1]I 6.2 D ESCRIPTION OF THE M O K V ... 114
6.2.2 M OK V Performance Attributes... 116
6.2.2.1 M O K V M ulti-Attribute Utility Function... 117
6.2.3 M OK V D esign Variables ... 118
6.2.4 Proposed Technologies for the M OK V... 124
6.2.5 Initial Param eters and Constraints ... 125
6.3 vRITE A NALYSIS OF M O K V ... 127
6.3.1 Step 1-Set Initial Param eters ... 128
6.3.2 Step 2- Set Filters... 131
6.3.3 Step 3-Explore the Results ... 132
6.3.4 M OK VAnalysis Results and D iscussion... 136
7 C O N C LU SIO N ... 139
7.1 BENEFITS OF VRITE ... 139
7.2 LIM ITATIONS... 140
7.3 FUTURE W ORK ... 141
7.3.1 Conduct a Validation Study ... 141
7.3.2 Determine Realistic Probabilistic Distribution Functions for Cost and Schedule M onte Carlo Sim ulations ... 142
7.3.3 Integrate Construction of SA Ufunctions into Interface ... 142
7.3.4 Expand the Type of SA U Variables Used ... 142
7.3.5 Apply vRITE to Larger, Socio-Technical Systems ... 143
7.4 FINAL THOUGHTS ... 1 43 R E FER EN C ES... 145
A C R O N Y M S A N D A BBR EV IA TIO NS... 152
A PPEN D IX A ... 153
List of Figures
F igure 1: R esearch App roach... 14
Figure 2: Private Sector R&D Expenditure [5] ... 18
Figure 3: Breakdown of United States Federal R&D Expenditure by Year [6] ... 19
Figure 4: Origins of the Technologies in the iPhone [7] ... 20
Figure 5: Potential Impacts of a New Technology ... 21
Figure 2.6. Process for calculation of Multi-Attribute Utility Score for tradespace exploration 28 Figure 7: Creation of a Tradespace [39] ... 30
F igure 8: Example Tradespace... 31
Figure 9: Description of Epoch Era A nalys is... 33
Figure 10: Illustrated description of a risk-based decision-making model [45]... 35
Figure 11: Example Risk Matrix from the "DoD Risk, Issue, and Opportunity Management Guidefor Defense Acquisition Programs " [51]... 38
F igure 12: Example D ecision Tree... 41
Figure 13: M ajor steps to perform PRA [55]... 44
F igure 14: R TRAM Tradespace [48]... 46
Figure 15: Example of a Generic Multi-objective Decision Tree (MODT) [62] ... 48
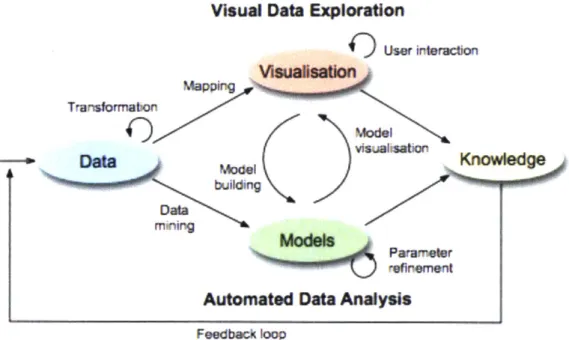
Figure 16: The Visual Analytics Process as described by Keim et al. [63] ... 50
Figure 17: Sources of Benefit for R&D projects identified by industry experts... 57
Figure 18: Sources of Uncertainty in R&D projects according to discussion with experts... 59
Figure 19: Comparison of risk matrices with different scales ... 62
Figure 20: Characteristics of R&D investment analysis and corresponding elements of vRITE 69 Figure 21: Renderings of possible space tug design concepts [74] ... 70
Figure 22: Tradespace of baseline space tug design alternatives... 73
Figure 23: SA U curve of Capability adaptedfrom Curry [78]... 74
Figure 24: SA U curve of Delta-V adapted from Curry [78] ... 74
Figure 25: SA U Curve of Speed adaptedfrom Curry [78] ... 75
Figure 26: Baseline tradespace with a fuzzy pareto front depicted in red and the "knee" of the p areto front circled in blue. ... 77
Figure 27: SA U curve ofImaging Resolution... 79
Figure 28: The Normal D istribution [85] ... 82
Figure 29: Pareto Trace illustratedfor 7 epochs [93]... 91
Figure 30: Tradespace for Mission 2 when TRL is set to 8 (FPN=30)... 92
Figure 31: Tradespace for Mission 6 when TRL is set to 8 (FPN=30)... 93
Figure 32:Example of a vRITE Results Table ... 94
Figure 33: Example histogram ofAverage FPNfor each acceptable design ... 94
Figure 34: Bar Graph of Average Robustness (fNPT) ... 95
Figure 35: Example floating bar graph for expected R&D cost ... 96
Figure 36: Example CDFfor expected R&D cost... 96
Figure 37: Initial Parameters of Technology 1 (Example Scenario) ... 98
Figure 38: Initial Parameters of Technology 2 (Example Scenario) ... 99
Figure 39: Initial Parameters of Technology 3 (Example Scenario) ... 99
Figure 40: Attribute Thresholds (Example Scenario) ... 100
Figure 41: Mission I Tradespace (Example Scenario) ... 101
Figure 42: Mission 4 Tradespace (Example Scenario) ... 101
Cost, Schedule, and Performance graphs (Example Scenario)... Likelihood of Successful Development for Each Technology (Example Scenario).. Empirical CDFs (Example Scenario)...
Conceptual illustration of the MOKV[106]... Discrimination/Terminal Guidance SA U Curve... R adiation Shielding SA U C urve ... L eth a lity SA U C urve ... Raid Capability SA U Curves for Each Context (Hypothetical)...
104 105 106 114 119 121 121 123
Figure 52: MOKV Analysis Technology 1 Initial Parameters Tab ... 128
MOKV Analysis MOKV Analysis MOKVAnalysis MOKV Analysis MOKVAnalysis MOKVAnalysis MOKV Analysis MOKV Analysis MOKV Analysis MOKV Analysis
Technology 2 Initial Parameters Tab ... Technology 3 Initial Parameters Tab ... Attribute Thresholds Tab...
R&D Process Constraint Settings... Context Tradespace Tab ... Tradespacefor Each Context ... Results Table... Cost, Schedule, and Performance Data Tab... Cross-Context Performance Tab ... Likelihood of Successful Development Graph...
Figure 63: M OK V Analysis Empirical CDFs... 136
Figure 64: Government and DoD Definitions of Research and Development [47]... 153
Figure Figure Figure Figure Figure Figure Figure Figure 44: 45: 46: 47: 48: 49: 50: 51: Figure 53: Figure 54: Figure 55: Figure 56: Figure 57: Figure 58: Figure 59: Figure 60: Figure 61: Figure 62: 129 129 130 130 131 132 133 134 135 135
List of Tables
Table 1: TRL D escriptions [23]... 23
Table 2: Description of Senior Level Decision-makers... 55
Table 3: Possible Values for Capability of Equipment for Space Tug Architecture ... 72
Table 4: Possible Propulsion Types for Space Tug Architecture... 72
Table 5: Possible Fuel Masses for Space Tug Architecture... 72
Table 6: TRL 8 Resolution Estimates for Proposed Technologies for Space Tug Case... 79
Table 7: Levels of Uncertainty for SA U Associated with each TRL for proposed LIDAR Technology for Space Tug Case ... 83
Table 8: Levels of Uncertainty for SA U Associated with each TRL for proposed RADAR Technology for Space Tug Case ... 84
Table 9: Levels of Uncertainty for SAU Associated with each TRL for proposed High-Definition Camera Technology for Space Tug Case... 84
Table 1 0:Mission descriptions and associated weights used in the MA Ufunction... 89
Table 11: MOKV Operating Context Descriptions ... 116
Table 12: Performance Attributes of the MOKV... 117
Table 13: MOKV MA U Function Attribute Weights... 118
Table 14: Levels for On-Board Sensor Type ... 119
Table 15: L evels for P rop ellant22 ... ... ... ... ... .. .... 119
Table 16: Levels for Propellant Am ount22... ... ... ... .. .... 120
Table 17: Levels for Command & Control Method22 ... . . . .. . .. . . 120
Table 18: Levels for Radiation Shielding22... . . . .. . .. . . 120
Table 19: L evels for K ill M ethod22 ... . ... ... ... ... ... 121
Table 20: Levels for Number of Objects2 2 ... ... ... ... ... ... 122
Table 21: Raid Defense Capability SA U scores (V) ... 122
Table 22: Proposed Technologiesfor MOKV ... 125
Table 23: Initial Parameters of Doppler Technology... 126
Table 24: Initial Parameters of VacFET Technology... 126
Table 25: Initial Parameters of Directed Energy Technology ... 127
1 Introduction
1.1 Motivation
Research and development (R&D) plays an important role in society, providing important new technologies and capabilities for a wide range of applications. Organizations that conduct R&D take on a unique role by acting as the catalyst for technological progress, but accepting high levels of risk in the process. The exploratory nature of R&D programs makes them highly susceptible to uncertainty and risk. For every successful new technology developed, there are likely several failed ones, and the costs of these failures can lead to bankrupt companies. In 2011, Nokia spent nearly $8 billion on R&D with relatively poor results, and now the once-powerhouse in the telecommunications industry risks bankruptcy [1]. At the same time, however, companies who do not take risks and push the limits of technologies and capabilities are likely to be left behind in highly competitive markets. Look no further than the Kodaks and Blockbusters of the world whose stagnation made them case studies in the dangers of complacency.
Despite the need for progress, one thing remains certain: deciding into which technology to invest R&D resources is difficult. Whereas many business decisions can be made on the basis of historical cost and performance data that provides the decision-maker with some level of certainty, technology that is in the initial phases of R&D is new and yet untested, so historical data does not exist. Therefore, the cost, schedule, and feasibility of the technology in question are largely uncertain. Decision-makers must weigh these uncertainties and the resultant risks with the uncertain benefits that the technology may provide when making investment decisions.
While most organizations conduct risk assessments and cost-benefit analysis, current methods often do not adequately address the challenges and considerations unique to decision-makers who are making R&D investment decisions. Providing decision-makers with the appropriate information in a user-friendly, interactive format to help them make such decisions is the focus of this thesis. By developing a framework that can be used to help others provide such information, this thesis intends to reduce the ambiguities of R&D risks and benefits in order to encourage continued investment into new and important technologies and capabilities.
1.2 Research questions
The research presented herein was motivated by the following research questions:
1. What are the main challenges of R&D investment decision-making? 2. What are the primary sources of risk and benefits for R&D programs?
3. What are the strengths and weaknesses of current R&D investment decision-making aids? 4. How can the pertinent risks and benefits be communicated to the decision-makers in order
to help them make R&D investment decisions?
1.3 Scope
This research focuses primarily on organizations that make value-based investment decisions. Methods for economic and profit-driven cost-benefit analysis are well established but assume that decisions are made on the basis of money. Here, benefit is not limited to the monetary value of a given technology, but rather a system's ability to complete a given objective.
A single decision-maker is assumed for the framework developed in this thesis. Focusing on a single decision-maker eliminates that potential for discrepancies in perceived value and is a good starting point upon which multi-decision-maker frameworks can be developed. While this research discusses and acknowledges the influence of risk in decision-making, it does not attempt to define or constrict how a decision-maker thinks about risk. That is, this research is not a psychological study of risk. Rather, it uses feedback from real-world decision-makers to identify common risk considerations and incorporates these into the decision-making analysis.
Additionally, this research focuses only on known or predictable sources of uncertainty. So called "unknown unknowns" are not addressed in this technique because, by definition, it is difficult to anticipate and therefore model the impacts of these risks.
Critically, the framework developed here is not meant as a standalone decision-making aid, but rather augments the already large library of decision-making tools that other research and industry practice has already established. Attempting to make system design decisions with a single chart or graphic neglects the complex interactions that exists and does not adequately address the other considerations, be them financial or programmatic, that are important to the analysis. Similarly, the framework presented here is only an example, as there is no cookie cutter solution to an R&D investment decision-making aid. Each organization may require a unique set of metrics or information pertinent to their needs. Finally, the results of the analyses presented in
Chapters 5 and 6 are not meant to serve as recommendations for a real-world system, but rather as hypothetical examples of conclusions that a decision-maker might reach based on the information provided by the analysis.
1.4 Research Approach
This research describes the development of an interactive decision-making aid called Visualized Risk-Informed Tradespace Exploration (vRITE) that decision-makers can use to augment their decision-making process. It builds upon well-established research in multi-attribute tradespace exploration (MATE), value-based decision-making, and risk assessment to develop a tool that encourages decision-makers to consider risk in the initial phases of system design.
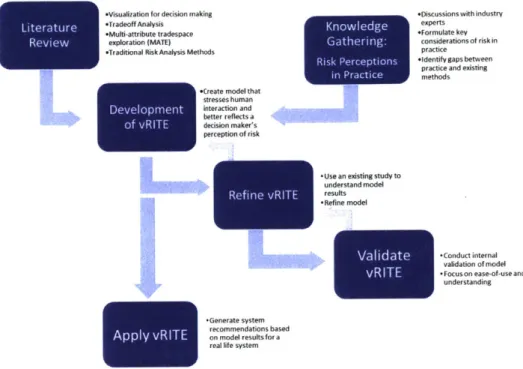
The first step of this research requires becoming familiar with the wide body of previous work on tradeoff analysis, multi-attribute tradespace exploration, and visualization for decision-making that will act as the foundations for the design of vRITE. Additional research is conducted on existing risk analysis theories, methodologies, and tools. Separately, discussions with practicing senior-level decision-makers in industry provide insights into perceptions of risk and shortfalls of currently employed methods. This background research informs the development of a vRITE interface. After the interface is developed, it is used analyze a well-established case to ensure the results are meaningful and make sense. The framework is adjusted based on internal validation with MIT's Systems Engineering Advancement Research Institute lab group to ensure the interface is intuitive and the outputs are easy to understand. Finally, vRITE is used to analyze a real-world ballistic missile defense system and provide technology investment recommendations based on the results. Figure 1 visually illustrates this process.
-Visualization for decision making -Discussions with industry *Tradeoff Analysis K o ld e experts
*Multi-attribute tradespace KFormulate key
R exploration (MATE) Gathering: considerations of risk in
-Traditional Risk Analysis Methods practice
Ris Pecpin -identify gaps between
in Practi practice and existing
*Create model that stresses human
Development ion and better refet a C.
of vRITE decision maker's
perception of risk
Use an existing study to * understand model
RefinevRITE results Refine model
Validate -Cdc validation of modeltieal
understanding
vRITE -Focus on ease-of-use and
* -Generate system recommendations based
Applyon model resultsfor a
real life system
Figure 1: Research Approach
1.5 Research Contribution
While tradespace exploration, investment decision-making, and risk assessments are all areas of research which have been explored in great depth, the use of multi-attribute tradespace exploration for the purposes of evaluating research and development investment decisions has not yet been fully developed. This research synthesizes areas of previously established knowledge to demonstrate how using tradespace exploration to visualize considerations about cost, schedule, technology performance, and risk can aid R&D investment decision-making. The user interfaces presented are not intended to act as the answer, but rather as examples of what should be included in a similar product used for other programs. The underlying notion of visualizing the complex considerations of a decision-maker, and the recommendations for how to do so, are the most important aspects of this research.
1.6 Structure of Thesis
The structure of this thesis closely follows the flow of the research approach laid out above. The first chapter provides a brief introduction, the motivation, research questions and scope of the research. The second chapter provides a literature review of the existing research that is the foundation for this thesis and informs the development of the vRITE framework. The third chapter
addresses risk perceptions and focuses on the differences between risk analysis methods and decision-makers' perceptions of risk. This chapter highlights important gaps and weaknesses in the current methods that the decision-making framework introduced in this thesis hopes to address. The fourth chapter discusses the development of the framework. A well-established case study that has been analyzed at length is used as a demonstration case for a vRITE analysis. Finally, vRITE is applied to a real-world ballistic missile defense system and recommendations are provided based on the results.
2 Decision-Making in the R&D Programs
This chapter serves an important role in laying the foundations for developing a framework for Visualized Risk-Informed Tradespace Exploration (vRITE). First, it describes the context in which visualized risk-informed tradespace exploration may be useful. R&D is a crucial process in advancing technology and society, but its uncertain nature is often a source of apprehension and discourages investment. Decision-making aids that incorporate considerations of risk into their calculus to better reflect the considerations of decision-makers have the potential to mitigate these barriers to investment and, possibly, lead to better decisions.
Second, it discusses some of the strengths and weaknesses of existing multi-objective decision-making and risk analysis methods. For instance, Multi-Attribute Tradespace Exploration (MATE) is presented as an effective method for supporting value-driven decision-making, while risk matrices often provide poor information when little data is available, so they may not always be appropriate. This discussion reveals why the existing methods are not always sufficient for this particular context and helps to inform which elements should and should not be included in a new decision-making framework.
2.1 The R&D Enterprise
The framework presented here is intended for use in Research and Development (R&D) domains. Understanding the unique context of R&D informs the need for decision-making tools that incorporate considerations of risk. It is first necessary to clarify the what is meant by R&D in order to avoid confusion that may be caused by the many varying definitions available. Merriam-Webster defines research and development simply as "studies and tests that are done in order to design new or improved products" [2] while the Business Dictionary defines it as "systemic activity combining both basic and applied research, aimed at discovering solutions to problems or creating new goods and knowledge" [3]. The RAND Corporation compiled a list of definitions used by the United States government which can be found in Appendix A.
Meanwhile, the National Science Foundation (NSF) provides four varying definitions of research and development depending on to whom it pertains. The description of an R&D activity that best characterizes where this framework is most useful is found in the NSF's definition of
R&D as it pertains to business enterprises, which states that R&D includes the "conceptual formulation and design of possible product or process alternatives" [4]. Particularly, the
framework presented here is intended for the analysis of conceptual designs of new technologies and systems.
2.1.1
The Importance of R&D
The important role R&D plays in society can be viewed through two lenses. The first is the amount of resources dedicated to R&D every year. Figure 2 below illustrates the how much money large private firms spent on R&D in 2018 alone.
Ranking of the 20 companies with the highest spending on research and development In 2018 (in billion U.S. dollars)
Amazon 22.6 Alphabet 16.2 Volkswagen 15.8 Samsung 15.3 Intel Co 13.1 Microsoft 12.3 Apple 11.6 Roche 10.8
Johnson & Johnson 10.6
Merck 10.2 Toyota 10 Novartis 8.5 Ford 8 Facebook 7.8 Pfizer 7.7 General Motors 7.3 Honda 7.1 Daimler 7 1 Sanofi 6.5 Siemens 6.1 0 2.5 5 7.5 10 12.5 15 17.5 20 22.5 25
Expenditure in bilion U.S. dollars)
Sources Additional Information:
aloor'berg, Capital IQ Thomson trs Worldmde; nloomeberg C Ital Q Thomism R ters
Stata 2019
Figure 2: Private Sector R&D Expenditure [51
R&D expenditure is not limited to the private sector. Federal governments also dedicate large amounts of resources to fund R&D of new technologies. In the United States, the majority
of R&D funds are allocated to defense. Figure 3 below shows a breakdown of the United States' federal funding for R&D throughout the last 40 years.
Federal R&D Funding by Agency Fiscal Years (budget authority, millions of dollars) 1976 to 2018
Select R&D Character
$180,000 Total R&D Constant 2018 Dollars Yes $160,000 Agency Recovery Act $140,000 All Other DOD DOE $120,000 NASA NSF USDA $100,000 NIH NIST NOAA $80,000 USGS Select Agency All $60,000
"All Other" includes the Depts. of Transportation, Veterans
$40,000 Affairs, Homeland Security, and
State, the Environmental Protection Agency, and others.
$20,000 Based on agency budget
documents and data,
supplemented with NSF survey
data. Last updated May 2018. FY 2018 data are estimates.
$0 (c)AAAS
1978 1983 1988 1993 1998 2003 2008 2013 2018 Fiscal Year
Figure 3: Breakdown of United States Federal R&D Expenditure by Year [61
The fact that companies like Amazon spend nearly $30 billion in a single year, or that $140 billion of taxpayer money goes towards R&D efforts speaks to the significant role R&D plays in
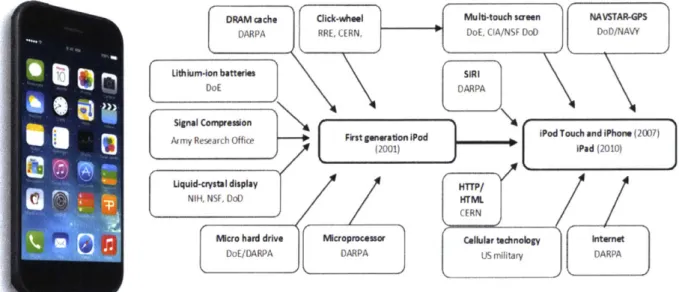
society. However, the importance of R&D is also made apparent by recognizing the advances in technology that have resulted from these investments. For example, the federal funds dedicated to R&D not only lead to new tanks, planes, and missiles, but also many important technologies that are prevalent in everyday life. below shows how many of the technologies developed by the DoD and other federal agencies are vital to the standard iPhone.
DRAM cache Click-wheel Multi-touch saen NAVSTAR-GPS
DARPA RRE, CERN, DoE, CIA/NSF DoD DoD/NAW
Lithium-Ion batteries S~
WE D ARPA
Signal Compression%
Army Research Office Frst generation lPod Wod Touch and Phone (2007)
(2001) Wad (2010)
Uquid-crystal display HTTP/
NIH, NSF, DoD HTML CERN
Micro hard drive Mcroprocessor Cellular technology internet
DoE/DARPA DARPA US military DARPA
Figure 4: Origins of the Technologies in the iPhone [71
It is clear that R&D can lead to important advancements and technologies even beyond those that are intended and, at the very least, that organizations recognize the importance of R&D enough to invest billions of dollars every year into making it possible. The next section describes some of the ways in which the technologies that result from R&D can impact systems and the context in which they operate.
2.1.2
Impacts of a New Technology
Prior to investment, decision-makers seek to understand the potential effects of a new technology in order to fully appreciate the benefit that it might provide. Some technologies may offer incremental advances, while others lead to revolutionary change. Successful R&D programs have generated some of the greatest advances in technology in history, from DARPA's development of the internet to Bell Labs' transistor that is considered the building block of all contemporary digital products. Sometime R&D efforts lead to disruptive, innovative technologies that drastically change not only systems and their concepts of operations, but also the contexts in which they operate. Christensen [8] describes how some innovations are disruptive and suggests that "disruptive technologies typically enable new markets to emerge." For example, the internet,
which is considered one of DARPA's greatest innovations, can be called disruptive because it continues to create and enable new markets while making other markets obsolete.'
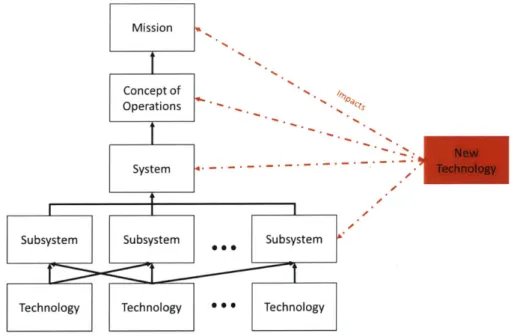
The effects of new technologies do not always have to be so disruptive. Some technologies may have smaller, incremental impacts, affecting only a specific subsystem or system (e.g. a new, lighter material may replace an older, heavier material), or perhaps the concept of operations of a given system or mission (i.e. new guidance technology allows a soldier to operate without GPS). While disruptive innovations are often desirable for their potential to drastically advance capabilities and even open new markets, most R&D expenditures are aimed at incremental innovation [9]. The diagram below illustrates how a new technology can impact the hierarchical structure of a system. Mission Conceptof Operations New System - - - -. - Technology
Subsystem Subsystem Subsystem
Technology Technology * * [Technology
Figure 5: Potential Impacts of a New Technology
A clear understanding of the potential impacts of a new technology can greatly influence how decision-makers value the system. Understanding these impacts is especially important when trying to compare multiple technologies within a portfolio of proposed R&D projects. For
instance, a proposed technology that is expected to enable new capabilities at the mission level may be more valuable than another proposed technology that is only expected to directly
1 Consider, for instance, the effect online marketplaces like Amazon have had on traditional brick and mortar stores
like Sears, who filed for bankruptcy in 2018.
influence a subsystem. Finally, properly communicating the impacts of a technology can also lead to investment despite risk. If a given technology is risky but promises to improve the concept of operations for a major system, the decision-maker may decide that the risk is worth the payoff.
2.1.3 Decreasing Barriers to R&D Investment
The types of decisions made at the conceptual design phase are inherently risky because researchers have very little, if any, information about the required costs and schedule, not to mention feasibility, of a novel technology. This framework seeks to increase the willingness to invest in R&D by providing decision-makers with the information they require. Ashford and Hall [10] explain that willingness to invest in R&D is partly determined by a firm's understanding of a problem, their knowledge of possible options, and their ability to evaluate alternatives. Ashford [11] asserts that skepticism about the performance of a technology, high financial costs of research and development, costs related to risk, uncertainty in cost-evaluations, and a reluctance to initiate change on principle (a tendency to do things the way the way they have always been done) can all discourage R&D investments. Virlics [12] explains that "good information, which helps in the better understanding of the investment's risks, and processing that information even, helps reduce the risks" but that "in a risky investment, where the outcome of the project can be more than one, there is no perfect information, or enough information to make the investment riskless". Indeed, it is not the goal of this framework to eliminate risk, but rather ensure that more useful, realistic information is available to decision-makers to reduce the apprehension caused by risk. Later sections discuss why existing decision-making tools may not be adequate. This framework is intended to inform the development an approach that more clearly communicates the evaluation of alternative options and makes the effects of risk and uncertainty on a given alternative less ambiguous.
2.1.4 Measuring Progress of an R&D project
Due to the uncertainty associated with the feasibility of R&D projects, executives often desire information about a project's progress. Estimates about how quickly a project may progress, for instance, can help a decision-maker decide whether a technology is likely to be developed under certain time constraints. Technology readiness levels (TRLs) are used to measure the progression of a project from idea to deployment. While many TRL scales vary
slightly, the table below describes the TRL scale used in this research. While TRL scales are not perfect or exact measurements of progress, they are simple, easily understood, widely adopted metrics throughout the science and engineering communities [13] [14] [15]. Although nine TRLs exist, this research is primarily concerned with TRL 3 through 8. These levels represent the stages between which a project may be proposed (e.g. applied R&D is initiated) and the end of system development before the system is deployed.
Table 1: TRL Descriptions 1231
Technology Readiness Levels in the Department of Defense (DoD) (Source: DoD (2010), Defense Acquisition Guidebook)
Technology Readiness Level
1. Basic principles observed and
reported
2. Technology concept and/or application formulated.
3. Analytical and experimental
critical function and/or characteristic proof of concept.
4. Component and/or breadboard validation in laboratory environment
5. Component and/or breadboard
validation in relevant environment. 6. System/subsystem model or prototype demonstration In a relevant environment. 7. System prototype demonstration in an operational environment.
8. Actual system completed and
qualified through test and demonstration.
9. Actual system proven through
successful mission operations.
Description
Lowest level of technology readiness. Scientific research begins to be translated into applied research and development. Examples might include paper studies of a technology's basic properties.
Invention begins. Once basic principles are observed, practical applications can be invented. Applications are speculative and there may be no proof or detailed analysis to support the assumptions. Examples are limited to analytic studies. Active research and development is initiated. This includes analytical studies and laboratory studies to physically validate analytical predictions of separate elements of the technology. Examples include components that are not yet integrated or representative.
Basic technological components are integrated to establish that they will work together. This is relatively "low fidelity" compared to the eventual system. Examples include integration of "ad hoc" hardware in the laboratory. Fidelity of breadboard technology increases significantly. The basic technological components are integrated with reasonably realistic supporting elements so it can be tested in a simulated environment. Examples Include "high fidelity" laboratory integration of components.
Representative model or prototype system, which is well beyond that of TRL 5, Is tested in a relevant environment. Represents a major step up in a technology's demonstrated readiness. Examples include testing a prototype in a high-fidelity laboratory environment or in simulated operational environment.
Prototype near, or at, planned operational system. Represents a major step up from TRL 6, requiring demonstration of an actual system prototype in an operational environment such as an aircraft, vehicle, or space. Examples include testing the prototype in a test bed aircraft. Technology has been proven to work in its final form and
under expected conditions. In almost all cases, this TRL represents the end of true system development. Examples include developmental test and evaluation of the system in its intended weapon system to determine if it meets design specifications.
Actual application of the technology in its final form and under mission conditions, such as those encountered in operational test and evaluation. Examples Include using the
system under operational mission conditions.
2.2 Designing for Senior-Level Decision-makers
It is also imperative to understand who is making the decisions, and therefore who will be using the decision-making tool. This informs the considerations that will be used to make
decisions. This framework assumes a single, senior-level decision-maker is tasked with making the final investment decision. There are two reasons for this assumption. First, it represents the way investment decisions are made in many organizations. Although they may seek recommendations and counsel from their employees, typically a senior level executive (e.g. program manager, director, etc.) has the final decision authority when allocating funds, as reflected by common top-down organizational charts. The second reason for this assumption is that the conflicting interests of multiple stakeholders have proven challenging in making value-driven decisions [16] [17] [18]. Therefore, for simplicity sake in this initial discussion of a new framework for developing a risk-informed making tool, it is best to focus first on a single decision-maker. This assumption, however, does not limit the results of a vRITE analysis from being used to communicate findings to multiple stakeholders, and the results from multiple stakeholders could be compared in order to gain insight into how preferences vary from one decision-maker to another.
Focusing on senior level decision-makers has several implications. First, it requires that the decision-making tool deliver clear results that help the decision-maker understand. Senior level decision-makers face many high-stakes decisions, often with little time to make them, so the results should be communicated efficiently. Duarte [19] emphasizes the importance delivering clear summaries about the information the decision-makers care about most, while Thompson and Bloom [20] note that senior level decision-makers often face more complex decisions and therefore may require more information. This creates a problematic tension between offering too much information to the point of confusing the decision-maker and not providing the decision-maker with the details they desire in attempt to simplify the analysis. This tension may be handled by effective visualization to communicate important information (see Section 2.8 for a more detailed discussion on the value of visualization).
Communicating information to senior level decision-makers also requires understanding how they process data and information. Bier [21] notes that many decision-makers are not fully trained in certain fields like statistical analysis which can cause challenges when trying to communicate risk assessments that are based on statistics. While this issue may be less pronounced in the R&D context where many senior level decision-makers have a background in technical fields, it may be problematic if new decision-making methods or techniques are introduced. Bier [21] also suggests that illustrative diagrams that clearly communicate underlying assumptions are
more useful to decision-makers than simple numerical summaries. The experience level of the decision-maker may also play a role in how decisions are made, and therefore what information a decision-maker might desire. Empirical evidence suggests that decision-making styles evolve as careers progress, and senior level decision-makers are more deliberate and perhaps cautious when evaluating options [22]. These findings provide support for incorporating factors of risk and uncertainty into a decision-making aid for senior level decision-makers.
It is also important to consider how less obvious factors may play a role in the decision-maker's decision. For example, a study of more than 950 CEOs from around the United States revealed that 71 percent consider the reputations of their executives when making decisions about investment allocation. Studies also found that "approximately half of CEOs listed their 'gut feel' as being important in deciding how to allocate capital across divisions" [23]. This points to the subjective nature of investment and decision-making in general [24], but also suggests that the current decision-making tools that focus on expected values and performance metrics do not accurately represent how decisions are made. Additional elements that better reflect the subjectivity of making and adapt to the varying considerations of senior level decision-makers must also be included. A more detailed discussion of considerations from practicing senior level decision-makers is found in Chapter 3.
2.3 Making Value-Based Decisions
The criteria upon which decisions are based also informs the type of analysis and metrics of benefit that are appropriate for decision-making. The uncertainty and non-monetary value of systems that result from R&D programs warrant the use of value-based decision-making methods. Whereas investment decisions are often based on cost and expected rate of return using cost-benefit analysis, especially in commercial settings, a value-based approach may be more appropriate this context. While traditional cost-centric decision-making approaches are popular because they are quantifiable, they do not always fully incorporate information about the true value of a system to its stakeholders, which may extend beyond profits and be difficult to price [25]. Engineering systems such as those used for national security and space exploration are examples for which a value-based approach is appropriate [26]. In practice, decision-makers do not base their decisions solely on cost. Other preferences and considerations, such as schedule and risk, influence the decisions. It has even been argued that value-based approaches can help avoid cost and schedule overruns [27]. Ross and Roark [28] explain that characteristics such as modularity may add value
to a system. The use of value as a basis for decisions finds its origins in Von Neumann and Morgenstern's theorem of expected utility [27].2 Keeney and Raiffa built upon their work by discussing multi-objective decision-making, which is discussed below [29]. Ross et al. explain that "value models seek to map the resulting resource and performance predictions into decision-friendly perceived benefit and cost metrics," that allow stakeholders to understand how to they value a system [30]. Lee et al. [27] assert that value models still face several issues and require further development, while Ross et al. [30] provide a framework for "model trading" to assess and compare value models.
A brief description of utility theory, the foundation upon which value-driven approaches are built, is found in Section 2.2. Additionally, multi-attribute tradespace exploration (MATE) [31] is discussed as a method for exploring how the value of a system is affected by tradeoffs across attributes.
2.4 Utility Theory
Utility theory provides a method of quantifying the value of a system using metrics other than cost. Utilities measure how much a stakeholder desires the attributes associated with a given system. In this way, utility theory maps the attributes of a system architecture to stakeholder preferences, which allows decision-makers to understand the value of a system in terms of what attributes they care about most, and since the values are quantified and consistent for a given
stakeholder, they can directly compare and rank design solutions [32]. A typical utility function for a single attribute has the form:
Ui = Ui(xi)
for an attribute xi [32]. Using the convention set by von Neumann-Morgenstern [33], utilities are normalized on a scale of 0 to I is used for the utility, where a utility of 0 represents the least desirable solution and a utility of I represents the most ideal solution. For example, when deciding which car to buy, a decision-maker may assign a utility of 0 to a blue car, 0.25 to a red car, 0.5 to
a green car, and 1.0 to a gray car, indicating that their preference is as follows:
Gray > Green > Red > Blue
If a design cannot achieve a utility of 0 for a given attribute, it is typically deemed unacceptable. In the case of a design with "excess" of a given attribute, the design is typically assigned a value of 1 for that particular attribute, as long as that excess attribute is not considered detrimental to the system. It is also important to note that since the utility scale is dimensionless, care must be taken in interpreting the results. While it is true that, relatively a utility of 0.5 is better than a utility of 0.25, the former is not necessarily twice as good as the latter. The underlying metrics used to measure the utility should be consulted [32].
Though utility theory has its weaknesses, it provides a basis of understanding the value of a system given user preferences. Additionally, the ability to quantify these preferences means that it can be used alongside other decision-making models and techniques that rely on quantitative data.
2.4.1 Subjectivity in Utility Theory
One of the main critiques of utility theory is the subjectivity of the utility functions used to determine the utility of designs [34]. Many critics argue that the utility function can be manipulated to produce results consistent with, and that reinforce, a stakeholder's preconceived notion. While this is a real threat to analysis, the ability to adjust the utility function to accurately represent a decision-maker's preference is also a great strength. Though there apparently exists an appeal to make decisions unaffected by subjective judgements, as long as humans are the ones making decisions, subjectivity will always play an inherent role in decision-making. Acknowledging the influence of subjectivity-and the prevalence of "gut" decisions-and using it to help decision-makers understand the problem in terms of what they care about most is a more prudent approach to decision-making than altogether ignoring the role subjective judgements play. If the utility function is created honestly and the existence of bias is acknowledged, it provides more versatile results than fixed requirements or rigid objective functions that are often used in traditional analysis [32]. It also allows the decision-maker to update their preferences and explore the results under changing conditions.
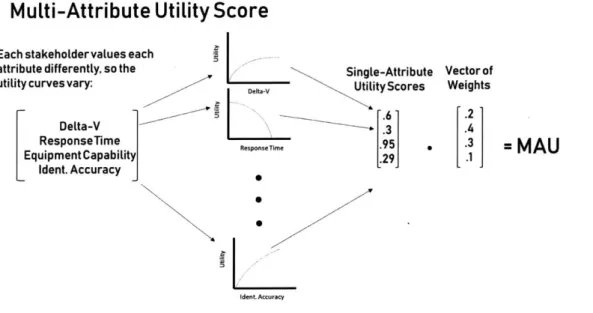
2.4.2 Multi-Attribute Utility Theory
Multi attribute utility theory extends utility theory to several attributes. System designs with a unique set of attributes are generated by combining multiple subsystems. Each attribute has an associated single-attribute utility (SAU) scores which reflect the value that system brings to the
system. Hastings and McManus discuss the process of selecting of attributes and generation of utility functions is discussed in depth [32]. The SAUs are then combined in an overall multi-attribute utility (MAU). There are several types of functions that can be employed for the purposes of calculating a realistic MAU, but the simplest is the Additive Utility, or weighted sum, function, found below.
n
U =LkiUi
Each attribute, i, is assigned a user-determined weight, ki, that reflects its importance in the system's overall utility. An illustration of the process of calculating the MAU is shown in Figure 2.6.
Multi-Attribute Utility Score
Each stakeholder values each
attribute differently, so the Single-Attribute Vector of utility curves vary: ity Scores Weights
Delta-V 3
ResponseTime n .95 . =
MAU
Equipment Capability .29
[
.1LIdent. A ccuracy 0.9
[dent. Accuracy
Figure 2.6: Process for calculation of Multi-Attribute Utility Score for tradespace exploration
Returning to the car example, assume that now the decision-maker is not only concerned with the color of the car, but also the speed and safety of the car. There are now 3 variables that result in 3 SUA scores, each of which are weighted according to what the decision-maker cares about most. Thus, the utility of the car is now a function of these three variables.
While the Additive Utility function is the simplest, it requires several constraining assumptions. The first assumption, preferential independence, holds if the rank order preference of a subset of attributes does not affect the preference of another set of attributes. For example, suppose a design consists of two sets of attributes, X and Y. If attribute Xi is preferred to attribute
X2 when attribute Yi is chosen, and attribute Xi is still preferred to X2 for any choice of Yi, then attribute X is preferentially independent of attribute Y. Furthermore, the attributes must be mutually utility independent, meaning that the utility function of attribute X must not be affected by the utility function of attribute Y [29]. Clearly, care must be taken in choosing which attributes are used for the purposes of representing the utility of the function. For instance, under these assumptions, it would not be appropriate to use an attribute for size and another for weight, since these two attributes are clearly not independent. In general, it is extremely hard in practice to prove that all attributes are independent, but the additive function is very useful if the user believes that the SAUs are independent and simplicity and ease of understanding are important [32].
Indeed, simplicity and ease of use are the main goals of an analysis intended for senior-level decision-makers. See Hastings and McManus [32] or Abbas [35] list of other possible forms of multi-attribute utility functions that are not constrained by these same assumptions and a description about how to construct them. General knowledge of utility theory is required for a complete understanding of this research because it is the foundation of the value-based decision model employed. For a more detailed explanation on constructing both single-attribute and multi-attribute utility functions based on user preferences, readers should see Hastings and McManus [32] "Space Systems Architecture, Final Report of SPPARC: The Space Systems, Policy, and Architecture Research Consortium (Thrust II and III)" and Keeney and Raiffa [29] Decisions with
Multiple Objectives: Preferences and Value Tradeoffs.
With a basic understanding of utility theory, it is now appropriate to discuss how utility can be used to help make decisions. The next section discusses how tradeoff analysis helps decision-makers explore how the utility of a system changes based on the tradeoffs of design decisions.
2.5 Tradeoff Analysis
Tradeoff analysis is a class of methods that allow decision-makers to better understand the many tradeoffs that occur across attributes in complex systems design decisions. While other methods of tradeoff analysis exist (i.e. Analytic Hierarchy Process (AHP) [36]), this research employs multi-attribute tradespace exploration (MATE) because of its ability to help decision-makers visualize tradeoffs and interact with data to better understand how their preferences affect the value of the system in question. A more in-depth description of MATE and its advantages is
found below. Certainly, other methods of value-based modeling of systems may be employed for vRITE if organizations are more familiar with them.
2.5.1 Multi-Attribute Tradespace Exploration
MATE [31] has proven a useful technique for helping decision-makers visualize the various tradeoffs between complex designs that are generated to solve a problem [37] [32] [38] [39]. MATE depends on multi-attribute utility theory to generate a utility score for each design. The general process of MATE is illustrated in Figure 7, below.
A Mdbsf n Den Ve Tradespace database to Constants --. Mo be explored For many Aftdbutes possible
Sng&Attbule UNlIni des"gn LMuNW-ttrbube ~All~)
Keyl-ntermdaeVdb
Figure 7: Creation of a Tradespace [391
The MAU scores are then plotted onto a tradespace (an n-dimensional coordinate axis). A conventional tradespace consists of two axes, one for cost and one for utility. There is no standard convention for the assignment of axes, but in this thesis, cost will be on the x-axis and utility will be on the y-axis. The result is a visualization of all of the designs' expected utilities and costs. The data distribution creates a pareto optimal front (or "pareto front") of data points. The points that lie on the pareto front are non-dominated solutions; that is, for a particular design on the pareto front, no other design has a lower cost given that design's utility score and, conversely, no other design has a higher performance given that design's cost. Theoretically, the "best" design solution lies on the pareto front, but no point on the pareto front is inherently better than any other point on
the pareto front. The pareto front merely identifies those non-dominated designs and helps narrow the decision. The decision-maker can then conduct further analysis, or "exploration," by manipulating the weights in the MAU function to represent certain tolerable tradeoffs. The pareto front will likely change as these levels are lowered or raised, and the decision-maker can better understand which options remain non-dominated with a variety of weight preferences. A simplified tradespace and pareto front are presented below for illustrative purposes.
D0 * 0 0 0 * * 0 0 * 0 0 0 0 * 0 0 Cost
Figure 8: Example Tradespace
While MATE is a useful tool for exploring design options, it prioritizes technical performance metrics and costs as the two driving factors for making decisions. As discussed in Section 1.1, these are important metrics in decision-making, but do not capture the full story in a research and development context where risk and uncertainty are prevalent.
Previous work from Ross et al. [39] explained how decision-makers can use Multi-Attribute Tradespace Exploration (MATE) to better understand the tradeoffs that occur in the design of complex systems or systems of systems. While the framework presented in their research illustrates how tradespace exploration can be applied to inform the design decisions for single architectures, it did not consider the case in which decision-makers constrained by a limited budget must choose between projects within a portfolio of diverse possible research projects. They did however, assert that "since tradespaces are constructed using concept-neutral criteria (perceived benefits and costs), one should be able to compare vastly different concepts on the same tradespace" [39]. This assertion provides support for the use of tradespaces to compare multiple,


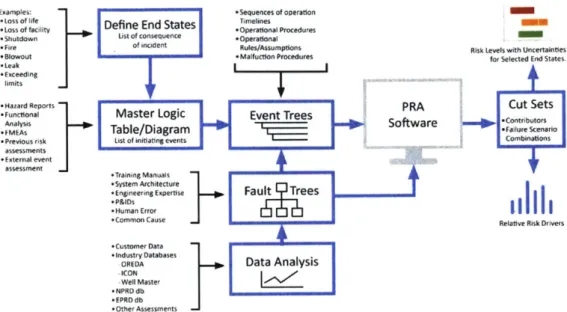
![Figure 15: Example of a Generic Multi-objective Decision Tree (MODT) [62]](https://thumb-eu.123doks.com/thumbv2/123doknet/14744765.577808/48.917.205.673.125.441/figure-example-generic-multi-objective-decision-tree-modt.webp)