HAL Id: hal-00304579
https://hal.archives-ouvertes.fr/hal-00304579
Submitted on 1 Jan 2001HAL is a multi-disciplinary open access archive for the deposit and dissemination of sci-entific research documents, whether they are pub-lished or not. The documents may come from teaching and research institutions in France or abroad, or from public or private research centers.
L’archive ouverte pluridisciplinaire HAL, est destinée au dépôt et à la diffusion de documents scientifiques de niveau recherche, publiés ou non, émanant des établissements d’enseignement et de recherche français ou étrangers, des laboratoires publics ou privés.
Long-term and seasonal variations in CO2: linkages to
catchment alkalinity generation
S.A. Norton, B.J. Cosby, I.J. Fernandez, J.S. Kahl, M. Robbins Church
To cite this version:
S.A. Norton, B.J. Cosby, I.J. Fernandez, J.S. Kahl, M. Robbins Church. Long-term and seasonal variations in CO2: linkages to catchment alkalinity generation. Hydrology and Earth System Sciences Discussions, European Geosciences Union, 2001, 5 (1), pp.83-91. �hal-00304579�
Long-term and seasonal variations in CO
2: linkages to catchment
alkalinity generation
Stephen A. Norton
1, Bernard J. Cosby
2, Ivan J. Fernandez
3, Jeffrey S. Kahl
4and M. Robbins
Church
51Dept. of Geological Sciences, University of Maine, Orono, ME, USA
2Dept. of Environmental Sciences, University of Virginia, Charlottesville, VA, USA 3Dept. of Plant, Soil, and Environmental Sciences, University of Maine, Orono, ME, USA 4George J. Mitchell Center, University of Maine, Orono, ME, USA
5US Environmental Protection Agency, Corvallis, Oregon, USA
e-mail for corresponding author: [email protected]
Abstract
As atmospheric emissions of S have declined in the Northern Hemisphere, there has been an expectation of increased pH and alkalinity in streams believed to have been acidified by excess S and N. Many streams and lakes have not recovered. Evidence from East Bear Brook in Maine, USA and modelling with the groundwater acid-base model MAGIC (Cosby et al. 1985a,b) indicate that seasonal and yearly variations in soil PCO2 are adequate to enhance or even reverse acid-base (alkalinity) changes anticipated from modest decreases of SO4 in surface waters. Alkalinity is generated in the soil by exchange of H+ from dissociation of H
2CO3, which in turn is derived from the dissolving of soil
CO2. The variation in soil PCO2 produces an alkalinity variation of up to 15 meq L-1 in stream water. Detecting and relating increases in
alkalinity to decreases in stream SO4 are significantly more difficult in the short term because of this effect. For example, modelled alkalinity
recovery at Bear Brook due to a decline of 20 meq SO4 L
-1 in soil solution is compensated by a decline from 0.4 to 0.2% for soil air PCO 2. This
compensation ability decays over time as base saturation declines. Variable PCO2 has less effect in more acidic soils. Short-term decreases of
PCO2 below the long-term average value produce short-term decreases in alkalinity, whereas short-term increases in PCO2 produce short-term alkalization. Trend analysis for detecting recovery of streams and lakes from acidification after reduced atmospheric emissions will require a longer monitoring period for statistical significance than previously appreciated.
Keywords: CO2, alkalinity, acidification, recovery, soils, climate change
Introduction
In the last two decades, European and North American countries have adopted various protocols for control of atmospheric emissions of S (e.g. the U. S. Clean Air Act and Amendments of 1970 and 1990). Implementation of these protocols is underway. As a consequence of reduced emissions of S (NADP, 1998; UN ECE, 1994), atmospheric
concentrations and deposition of SO4 have declined
substantially. Surface waters have responded with decreased SO4 (e.g. Kopácek et al., 1998; Stoddard et al., 1999). In the northeastern U.S., the pH of precipitation has increased
concurrently, even as NO3 concentrations in precipitation
have remained essentially constant. Scientists and policy makers expected that the pH of surface waters would increase as SO4 declined and the pH of precipitation rose (Reuss et
al., 1987). Monitoring studies indicate that most streams and
lakes have lower SO4 but many surface waters have not
responded with higher pH. For example, Clair et al. (1995) identified many lakes and streams from Ontario to Newfoundland, Canada, that continued to acidify, even as SO4 declined in precipitation and surface waters. Driscoll et
al. (1989) believed that the lack of response of stream pH to
higher pH and decreased SO4 in precipitation at Hubbard
Brook Experimental Forest, New Hampshire, USA, related to decreases in the concentrations of neutralizing base cations in precipitation. Similarly, in the Catskill Mountains of New York, USA, although some streams had increased pH as stream SO4 declined over the last decade, some streams have continued to acidify (Stoddard et al., 1998a,b). Across the northeastern USA, Clow and Mast (1999) found declining SO4 in precipitation and streams, but not a ubiquitous decline in alkalinity. They suggested that the delayed response of alkalinity may have been caused by recovering soil base-saturation levels. In Maine, USA, Kahl et al. (1993) found
S.A. Nor ton, B.J. Cosby, I.J. Fernandez, J.S. Kahl and M. Robbins Church
that a group of lakes increased in alkalinity through the 1980s in response to decreasing SO4. Some of these lakes, however, have experienced declines in pH and alkalinity since 1990,
in spite of continued decline in atmospheric SO4 and
relatively constant NO3. These declines in pH were
accompanied in many cases by decreases in the concentration of base cations in the lake water.
The enigma is that, on a regional scale, many surface waters have experienced declines in the concentration of SO4, some have had significant declines in NO3 (Mitchell et al., 1996; Stoddard et al., 1999), but not all surface waters have responded with increasing pH and alkalinity. This lack of clear response to air pollution controls is of interest to policy makers, as well as to scientists.
Many studies (e.g. Castelle and Galloway, 1993) demonstrate strong seasonality for stream alkalinity and soil PCO2. Spring and fall alkalinity are low compared to summer alkalinity; these temporal relationships are linked to higher respiration during warmer months, and dilution of groundwater by surface runoff in the spring and fall (e.g. Stoddard, 1987). East Bear Brook in Maine (BBWM) (Norton and Fernandez, 1999) is an intensively studied
system where decreasing SO4 atmospheric deposition has
not produced an increase in stream pH and alkalinity. BBWM is a paired catchment study underway since 1987. From 1987 to 1999, the volume-weighted mean annual alkalinity of East Bear Brook declined from about 8 meq L-1 to 0 meq L-1. We
present empirical data from East Bear Brook on a soil PCO2
mechanism that may partially control this longer-term decline in the stream water alkalinity, occurring independently of anthropogenic acidification, chemical weathering, seasonality, and hydrological variation.
Methods
SITE DESCRIPTION AND COLLECTIONS
The Bear Brook Watershed in Maine (BBWM) is a paired catchment investigation of the effects of artificial acidification on stream water chemistry, soils, and vegetation. East Bear Brook, the reference catchment, has an area of 10 ha, an average slope of 30%, and is underlain predominantly by Spodosols developed on till. Monitoring since 1987 includes weekly precipitation chemistry and volume, chemistry of approximately 250 stream samples per year with high frequency sampling during high discharge, and discharge measurements at five minute intervals. The headwater stream has low alkalinity (ca. 0 meq L-1 in 1999)
and low dissolved organic carbon (DOC) (ca. 2 mg L-1). A
detailed description of the catchment, methods and results of chemical analysis have been presented by Norton and
Fernandez (1999) and Norton et al. (1999).
We measured the concentration of soil air CO2 in BBWM
soil profiles for two years (1988–1990), including both winters. Soil air tubes were established in East Bear to collect soil air at the base of the O horizon, mid-B, and bottom of the B. As many as 20 concurrent (one-day of collection) soil air samples were collected at several depths in the soil and at multiple sites. Nearly all the soils at BBWM are freely drained and thus we assume that most groundwater below the zone of saturation equilibrates with a PCO2 equivalent to that of the lower B horizon. Here we use data only from the lower B horizon. Fernandez et al. (1993) give details of the methods.
Results
SUMMARY OF THE CHEMISTRY OF RUNOFF
The pH and alkalinity of waters draining a forest are controlled by a number of factors including: supplies of
strong acid anions (SO4+NO3+Cl+F = SAA) and strong base
cations (Ca+K+Mg+Na = SBC) from the atmosphere; chemical weathering and net ion exchange; and production
of the weak acid anions (WAA) from H2CO3 and dissolved
organic acids (from DOC). Changes in biomass may influence several SAAs and SBCs, as well as DOC through a variety of mechanisms. Change in alkalinity depends on changes in the concentrations of SAA, SBC, or WAA.
SAA: The concentration of SO4 in precipitation at BBWM
declined gradually from 1988 to 1999, as it did in precipitation and in many surface waters in the northeastern USA (Stoddard et al., 1999). The decline in atmospheric
deposition has caused a decrease in SO4 concentration in
East Bear Brook of approximately 15 meq L-1 (15%) over
the same period (Norton et al., 1999). The concentration of
NO3 has been relatively unchanged in wet precipitation at
BBWM during this period. Stream concentration and export
of NO3 reached a peak at BBWM about 1990 but decreased
in East Bear runoff over the next nine years, as it has in many headwater surface waters in the northeastern USA (Mitchell et al., 1996). Volume-weighted concentration is now about 2 to 3 meq L-1. Chloride at BBWM is apparently
derived entirely from atmospheric deposition of marine aerosols. The concentration of Cl in precipitation varies seasonally, with lower concentrations in the May–September period. The outflow concentration is damped significantly as a consequence of mixing of “old” and “new” water. Stream Cl declined from 1978 to 1991, followed by an increase to 1999. The annual volume-weighted mean values range from about 60 to 70 meq Cl L-1. Sulfate from marine aerosols is,
of the SO4 in the marine aerosol component flux is only about 1 meq SO4 L-1 in stream water. Most of the stream F, about 1
meq L-1, is derived from weathering. In summary,
concentrations of some individual SAA in East Bear runoff have remained relatively constant during the 11-year period of observation but the sum of SAA has declined approximately 40 meq L-1, primarily due to declines in stream
NO3 (15 meq L-1)and SO
4 (20 meq L
-1) (Kahl et al., 1999).
SBC: Concentrations of SBC in wet atmospheric deposition, corrected for marine salts, were only a few meq L-1. Thus total atmospheric SBC varied consistently with Cl.
Rates of release of SBC from chemical weathering rates, normalised to the concentration of Si, appear to be relatively constant from year to year (Uddameri et al., 1995). Although there is a seasonal variation in stream chemistry associated with ion exchange of Na and Mg (from marine aerosols) for Ca and K (Norton and Kahl, in press), there is little net change in the sum of SBC derived from marine aerosols. We have not quantified biomass accumulation rate (and thus storage of SBC) at BBWM. However, changes in net storage would not vary strongly on a yearly basis in the absence of harvesting, substantial defoliation, or fire. Overall, SBC have decreased about 40 meq L-1 in East Bear Brook through the
period of record (Norton et al., 1999). This is comparable to the decline in SAA.
WAA: The concentration of DOC averaged close to 2 mg L-1 over the 11 year record of stream chemistry with no
long-term systematic change. Kahl et al. (1989) and David et al. (1992) estimated that the charge density for the organic anions was approximately 5 meq mg-1 DOC L-1. Thus, total
organic anions are typically <10 meq L-1 and range up to 20
meq L-1 during periods of high discharge. Changes in DOC
(and related organic acidity) are likely not responsible for the modest decline in alkalinity at East Bear Brook.
Alkalinity and pH: The paradox at East Bear Brook and at some other localities in the northeastern USA is that as the
concentrations of SAA, dominated by SO4 and NO3, have
declined in streams and lakes, the concentrations of SBC have declined as much or more, and alkalinity has declined, contrary to expectation (Fig. 1). Alkalinity at East Bear Brook has a strong seasonal pattern. It is typically low early in the year, declines to a minimum during snowmelt and early spring rains, climbs to a peak at very low flow (deep flow paths), and then declines during fall rains. In 1988, minimum alkalinity was approximately 0 meq L-1 whereas by 1999 the
pattern persisted but the minimum reached was –10 meq L-1
(Fig. 2). East Bear had become more acidic.
SOIL PCO2
Synchronously collected samples of soil air from different soil depths revealed a concentration gradient for CO2 from 0.1 to 1.0% from the O horizon to the C horizon. This depth trend for PCO2 is opposite the trend in CO2 generation in the soil from respiration, because CO2 generated in the forest floor and uppermost mineral soil is readily lost to the
atmosphere. Production of CO2 decreases with depth in the
soil but CO2 is more efficiently retained in deeper soil pore space resulting in increasing PCO2 with depth. The increase depends on season, soil texture, and soil moisture content.
Fernandez et al. (1993) reported strong variations of PCO2
between years, seasons, and from year to year for the same
season. The highest PCO2 at the base of the B horizon,
approaching 1%, occurred in the winter of 1988/89. The snow
-20 -10 0 10 20 30 40 50 60 70 80 0 50 100 150 200 250 300 350
Day, 1988 (circles) and 1999 (plus)
Alkalinity, ueq/L
Fig. 1. Measured alkalinity (meq L-1) in East Bear Brook for 1988 (circles) and 1999 (crosses) for all stream samples.
-20 -10 0 10 20 0 200 400 600 800
Julian Days (0 = Oct. 3, 1988)
Alkalinity, ueq/L 0.0 0.2 0.4 0.6 0.8 1.0 PCO2, % atm.
Fig. 2. (a) Percent CO2 in soil air (diamonds) at 50 cm in the mineral soil (C horizon) at East Bear Brook in Maine. Julian time starts on October 3, 1988. January 1, 1989 and 1990 (vertical lines) are Julian Days 89 and 454. Synchronous data are from different air tubes on different plots.
(b) Alkalinity (triangles) of East Bear Brook during high discharge (>0.5 ft3 sec1-, >14 L sec1- ) for January to April for 1989 and 1990. Synchronous data are from ISCO™ auto-samplers, typically taken
S.A. Nor ton, B.J. Cosby, I.J. Fernandez, J.S. Kahl and M. Robbins Church
pack was particularly deep and continuous during that winter. In the 1989/90 winter which had an intermittent thin snow
pack, the PCO2 was considerably lower, sometimes
approaching 0.1%. Summer PCO2 in the B horizon was
typically about 0.4% (Fig. 2).
Concurrent measurement of stream chemistry, stream
discharge, and soil PCO2 throughout the 1988–1990 period
enabled an evaluation of the relationships among these variables, especially controls on alkalinity. We compared the seasonality of alkalinity (including winter) and stratified the data by discharge. Figure 2 includes alkalinity data for only those times when discharge exceeded 14 L s-1, approximately
1/10 of the maximum discharge over the 12-year record. We assume that similar discharge values correspond to similar flow paths. The high alkalinity that occurs in the summer period (Fig. 1) is caused by less acidic flow paths with a
PCO2 of approximately 0.4% of an atmosphere. During the
late 1988/89 winter period, PCO2 approached 1%, and
alkalinity of the runoff (stratified by flow) was approximately 10 meq L-1 higher than the comparable period the following
winter, when PCO2 was less than 0.2% (Fig. 2). The high
PCO2 values of winter 1988/89 corresponded with a
continuous and extensive snowpack and higher than normal alkalinity; the converse was true the next winter. The higher alkalinity was associated with an increase of SBC (Ca, Mg, and K), greater than the SAA decrease. Approximately half the annual runoff for East Bear is associated with the spring runoff (see Chen and Beschta, 1999, for detailed hydrology). Consequently, this spring period of higher than normal alkalinity influenced a considerable fraction of the volume-weighted mean alkalinity (and base cations) for the year.
Discussion
CO2, WEATHERING, AND ALKALINITY
PRODUCTION
The long-term role of CO2 in chemical weathering is well
known. Through the dissolving of CO2 into water, the
formation of carbonic acid (H2CO3), and the dissociation of H2CO3 into H1+, HCO
3
1- and CO 3
2- in equilibrium amounts,
chemical weathering and alkalinity generation are increased over what would occur in the absence of H2CO3. Respiration of heterotrophic microbial communities decomposing organic matter and root respiration in soils produce elevated
concentrations of CO2, further increasing the rates of
chemical weathering (demonstrated empirically by Berner and Ji-Long, 1997, for example, and modelled by Neal and Whitehead, 1988). Weathering rates are also enhanced by the production of organic acidity.
In freely-drained forest Spodosols at BBWM, pH varies
dramatically with depth. Within the O horizon, pHH2O is
commonly <4.0, controlled largely by weak organic acidity from partial decomposition of forest floor organic materials. Below the O horizon in these undisturbed Spodosols there is commonly a series of abrupt transitions between horizons. The E horizon, where present, is highly acidic but with a pH >4.0. This horizon is generally chemically inert, and extremely thin, intermittent, or absent. Below the O or E horizon is the B horizon, commonly with pH <4.5 at its top,
still below the pH at which soil PCO2 can affect pH
significantly. Increased pH with depth occurs as the organic acid is precipitated, adsorbed, and metabolised, coincident with percolating solutions encountering increasingly less weathered alumino-silicate minerals. Lower B horizon soil pH at BBWM is commonly between pH 4.5 and 6.0. The
higher pH with depth results in an increased role for PCO2
in controlling acid-base chemistry in soil solutions and groundwater.
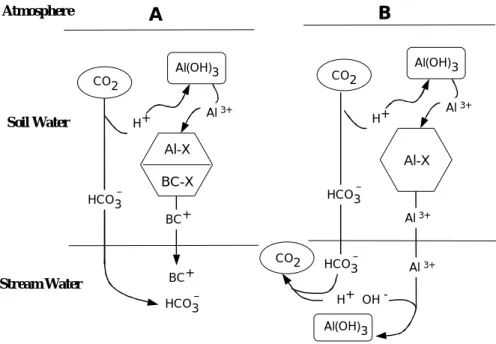
Alkalinity is generated in the soil water by the formation of HCO3- from dissolved CO
2 in soil water:
CO2 + H2O = H1+ + HCO 3
1- (1)
The H1+ produced by reaction (1) reacts with an Al solid
phase (e.g., Al(OH)3) in the soil: 3H1+ + Al(OH)
3 = Al 3+ + 3H
2O (2)
Most soil cation exchange sites have a higher affinity for trivalent Al than for di- or monovalent base cations. Consequently an exchange of cations between dissolved and solid phases results:
Al3+ + (BC)
3-X = Al-X + 3BC
1+ (3)
where BC1+ represents a base cation and X represents the
soil exchange complex. The net result of reactions (1), (2), and (3) is the production of bicarbonate alkalinity in the soil water (Fig. 3a,b). If soil air PCO2 decreases below long-term average values, less CO2 dissolves in the percolating soil water, the pH of the soil water tends to be higher than average (particularly if the soil pH approaches or is greater than 5), the soil solutions are less aggressive at chemical weathering and net adsorption of exchangeable cations occurs. A higher-than-average pH along any preferential flow path produces net adsorption of exchangeable cations (including SBC), decreasing the export of base cations (SBC). The alkalinity of the soil water is determined, in the short term, by this ion exchange equilibrium. As the groundwater emerges to a
Henriksen, 1983; Jones and Mulholland, 1998; Neal et al., 1998). Virtually all headwater streams have overpressures
of CO2, including East Bear Brook. During degassing, the
pH increases but alkalinity is unaffected because the water is no longer in contact with soil. Modest alkalinity changes may occur because of interaction between the emergent groundwater and the stream substrate (Norton et al., 2000) and precipitation of hydroxide phases (e.g. Fe and Mn) caused by increased oxidation potential. For lower than
normal soil PCO2, the stream water would have lower SBC,
accompanied by lower HCO31-, i.e. lower alkalinity. If base
saturation in the soil complex is very low, alkalinity variations are induced through interaction with the Al soil complex and soil water (Figure 3b). East Bear Brook responses include variation in the export of both SBC and Al. Degassing of CO2 there results in the precipitation of Al in the stream (Roy
et al., 1999), with no net alkalinity production. David and
Vance (1989) subjected B-horizon soil material from the
BBWM site to leaching under PCO2 ranging from
atmospheric (10-3.5 atm) to pure (100%) CO
2 (1 atm) and
found that alkalinity ranged from –5 to 163 meq L-1, consistent
with the mechanism described above. Their data also suggest that the soils are in equilibrium with a PCO2 higher than 10– 3.5, because the average alkalinity is higher than –5 meq L-1.
It is concluded that episodic or short-term decreases in PCO2 in the soil result in lower alkalinity in runoff at BBWM. Episodic or short-term increases in PCO2 produce short-term higher alkalinity. This is somewhat counterintuitive because
long-term elevated PCO2 produces long-term acidification
of surface water.
Observed variations in soil air PCO2 appear to affect
alkalinity to the same quantitative extent as recent changes in SO4 or NO3 concentrations in streams and lakes, and thus obscure (or enhance) the expected alkalinity recovery as SO4
concentrations decline. Although SO4 concentrations in
surface waters are generally declining, soil PCO2 can vary concurrently and on a short time scale. The hypothesis was evaluated by estimating the magnitude of alkalinity changes
expected to result from changes in SO4 concentrations or
from changes in soil PCO2. These estimates are derived using the process-based model of soil acid-base chemistry, MAGIC (Cosby et al., 1985a, b).
MODELLING BBWM RESPONSE
Cosby et al. (1996) applied the MAGIC model to the Bear Brook catchments for the period 1987 to 1992. The lumped parameter model was calibrated to two years of pre-treatment data on the manipulated catchment (West Bear) as well as to four years of data from the reference catchment (East Bear). MAGIC reproduced fairly well the observed stream water chemistry trends in both the treatment and reference
catchments for SO4 and SBC. Residuals for the treated
(predicted minus observed chemistry) were least if the West Bear data were used for the West Bear calibration. Both catchments had similar observed patterns (but different absolute values) of alkalinity, pH, and Al. The patterns
Atmosphere Soil Water Stream Water Al-X BC-X CO2 Al(OH)3 HCO3 BC+ BC+ H+ Al 3+ HCO3
A
Al-X Al(OH)3 HCO3 H+ Al 3+ Al3+ Al3+ H+ OH -Al(OH)3 CO2 CO2B
HCO3Fig. 3. Conceptual model of the influence of PCO2 on (a) Export of exchangeable base cations (BC1+) from soils with high base saturation and (b) Export of exchangeable Al (Al3+) from soils
S.A. Nor ton, B.J. Cosby, I.J. Fernandez, J.S. Kahl and M. Robbins Church
differed from some of the MAGIC prediction, suggesting that some process was occurring that was not correctly represented or parameterised in the model. The 1996 calibration of MAGIC for the East Bear catchment was modified for this paper by dividing the soil into an upper organic horizon and a lower inorganic horizon. The modified model was used to simulate the responses of stream water alkalinity to variations in observed SO4 concentrations and
PCO2 in the soil air. As SO4 decreases in atmospheric
deposition, MAGIC predicts a concurrent decrease in SO4
and increase in alkalinity of the stream water. However, episodically decreasing CO2, can reduce or even reverse the increase in alkalinity.
Three different 20-year simulations were run:
(1) The base case simulation assumed no changes in either SO4 concentrations (atmospheric input and stream values for 1991) or soil PCO2 (set at 0.25%).
(2) Responses to altering SO4 concentrations in soil water,
with soil PCO2 unchanged were examined and the
resultant changes in simulated alkalinity relative to the base case simulation were calculated (Fig. 4).
(3) Soil PCO2 in the lower horizon soil was varied while
SO4 concentrations were held constant at 1991 values
(Fig. 4).
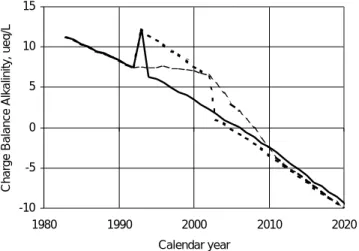
The three simulations began with observed 1991 conditions. By the end of years 1, 10, and 20 of the base case simulation
(SO4 and PCO2 unchanged), alkalinity of East Bear had
declined to 6.9, 2.4, and –3.8 meq L-1, respectively (Fig. 5).
That is, East Bear continued to acidify at 1991 levels of atmospheric S and N deposition and for a constant soil air
PCO2 of 0.25% in the lower B horizon. This base case
response for alkalinity is similar to the actual behavior of East Bear since 1987.
A step decrease in SO4 concentration of 20 meq L-1 resulted
in a simulated alkalinity after the first year following the decrease that was 4 meq L-1 higher than the base case stream
alkalinity for year one. Similarly, a decrease in soil PCO2 to 0.05% resulted in a simulated stream alkalinity in year one that was 4 meq L-1 lower than the base case alkalinity for
year one. If the 0.2% PCO2 decrease and the 20 meq SO4
L-1 concentration decrease occur simultaneously, there would
be no detectable stream alkalinity (or pH) response to the
SO4 concentration reduction in year 1 (Fig. 4). These
simulations strongly support the hypothesis that “reasonable”
changes in soil PCO2 can produce changes in stream
alkalinity that are of the same magnitude as alkalinity changes expected from declining stream SO4 concentrations. Ten years into the simulation, the base case stream alkalinity declined approximately 5 meq L-1 as East Bear continued to
acidify from the excess SO4. Relative to the base case
alkalinity, the step decrease in SO4 of 20 meq L-1 resulted in
an alkalinity increase of 7 meq L-1. At 20 years, the decrease
in SO4 produced an increase in alkalinity of 9 meq L-1 relative
to the base case (the alkalinity of which had declined 11 meq
L-1 since year 1). At 10 and 20 years, because of the low
PCO2 of 0.25% for the base case, it is not possible to decrease PCO2 enough to compensate for the 20 meq L-1 decrease in
SO4. This change in response through time is caused by cation depletion in the soil to the point where changes in SO4 are accompanied by a nearly 1:1 response in acidic cations, largely H+. At East Bear Brook, acidification or alkalization
from changes in PCO2, relative to the base case, could not be sustained for more than a few decades because of continued soil acidification.
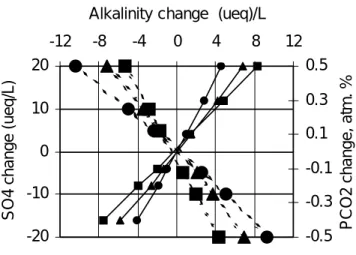
The ratio of (the slope of the curve [D alkalinity:D SO4]) to (the slope of the curve [D alkalinity:D PCO2]) in any year can be used to establish a “compensation factor” for no net change in alkalinity for that year. This ratio expresses the increase (decrease) in PCO2 that offsets an increase (decrease) in SO4 concentration such that alkalinity does not change.
Figure 4 shows that if CO2 is doubled for ten years, the
alkalinity remains nearly constant relative to the base case. The opposite effects of H2SO4 and H2CO3 are caused by their appearance on opposite sides of the alkalinity relationship:
SSBC – SSAA = alkalinity = SWAA – S(H+ + Al(OH) n +3-n) (5) -20 -10 0 10 20 -12 -8 -4 0 4 8 12
Alkalinity change (ueq)/L
SO4 change (ueq/L)
-0.5 -0.3 -0.1 0.1 0.3 0.5
PCO2 change, atm. %
Fig. 4. Alkalinity change relative to the base case (1991
concentration of SO4
2-) expected at East Bear Brook from variations of stream SO4 and soil PCO2 for 1, 10, and 20 years. Dashed lines are for SO4. Solid lines are for PCO2. Squares are the 1-year response. Triangles are the 10-year response. Circles are the 20-year response. For example, if SO42- decreased 20 meq L-1, alkalinity would increase 4, 7, or 9 meq L-1 over 1, 10, and 20 years,
Increased net cation adsorption because of decreased soil
air PCO2 is charge-compensated in the stream by decreased
formation of HCO3- and increased H+. However, as SO 4 from
the input of H2SO4 increases, the charge balance for the higher
SO4 is provided by higher concentrations of base cations
and increased H+. Thus, changes in alkalinity from variations
in soil PCO2 and SO4 may be additive or cancel each other. The compensation factor is (D PCO2, %)/(D SO4, meq L-1);
the values for East Bear Brook are –0.013, 0.024 and –0.050 for the 1st, 10th, and 20th years, respectively. The increase with time indicates that the potential for changes of soil PCO2 to offset changes of SO4 concentration declines with time. For the conditions observed in East Bear Brook soils, the
factors suggest that PCO2 effects could obscure or delay
alkalinity increases in response to SO4 concentration. The impact of a doubling of PCO2 (to 0.5%) for 1 and 10 years, or ramping the PCO2 to 2× over ten years is shown in Fig. 5. By 20 years the alkalinity increases related to SO4 reduction should be observed, in spite of any reasonable variation for soil PCO2.
IMPLICATIONS OF ALKALINITY CHANGES DRIVEN
BY VARIABLE SOIL CO2
The increases in alkalinity expected from decreases in atmospheric deposition of strong mineral acid anions may
be obscured by decreases in soil PCO2, a process that may
persist for several years due to systematic climate change.
Conversely, increased PCO2 will cause enhanced alkalinity
production. This would confuse documentation of recovery in surface water alkalinity associated with S emission
reductions. Because of the effect of variable PCO2,
long-term monitoring is necessary to delong-termine the efficacy of S emission control strategies. Surface water recovery from acidification will, most likely, not be monotonic, an extremely important consideration for evaluation of air pollution control policy.
The amount of short-term production of higher alkalinity due to higher PCO2 is controlled by site characteristics prior to the changes. In systems that are more acidic than East
Bear, the response of stream alkalinity to changes in CO2
would be smaller. More alkaline systems would be more responsive and the effect would persist longer. These conclusions are consistent with the empirical findings of Stoddard et al. (1998a,b) who demonstrated that the magnitude of trends in acid/base variables (alkalinity and SBC) are related to the acidity of the system.
Is there evidence for annual decline in soil PCO2, other than that caused by strong seasonality? The authors are not aware of any regional or site-specific integrated programme
of soil PCO2 monitoring to demonstrate trends for this
parameter. The northeastern U.S.A. has experienced some of the warmest years on record during the 1990s. Warmer summer conditions may increase both microbial and root respiration in the soil. Increased soil PCO2 should result in an enhancement of the alkalinity recovery attributed
(mistakenly) to SO4. However, Rustad and Fernandez (1998)
found that experimental warming of spruce-fir soils in the snow-free period in Maine produced increased respiration and an increase in efflux of CO2, but PCO2 in the lower soil horizon was not significantly higher, even though the temperature at 50 cm depth was increased by 5oC. The effect
of such a temperature increase was investigated at the mini-catchment scale by Wright (1998). He found that the major result of increased air CO2 (to two times atmospheric) plus
warming of soil by 5oC was an increased mobilization of
NO3 to runoff. Nitrate decreased through the 1990s at East
Bear Brook. A decline in soil PCO2, despite increased
temperature and possibly increased soil respiration, could result from lower soil moisture content and greater efflux of soil CO2. For this reason, the O horizon of a forest rarely has
high PCO2, despite high respiration rates, due to rapid
exchange between forest floor gas phases and the open atmosphere. However, atmospheric warming in the winter period may cause a reduction in the temporal extent of the snow-pack, permitting loss of soil CO2 and thereby reducing alkalinity of spring runoff from rain and snowmelt.
There are several alternative explanations for the continued decline in alkalinity at East Bear Brook concurrent with declining SO4 in the stream water:
(1) Perhaps the catchment is still acidifying from excess SO4, even as atmospheric loading of SO4 has declined to produce stream concentrations 15 meq L-1 below 1991 Fig. 5. Projected response in alkalinity of East Bear Brook to
deposition of SO4 atmospheric at 1991 values to (a) a one-year doubling of soil PCO2 (solid line), (b) a doubling of soil PCO2 for 10 years (dashed line), and (c) a 10-year ramp to doubled soil PCO2
(dotted line). -10 -5 0 5 10 15 1980 1990 2000 2010 2020 Calendar year
S.A. Nor ton, B.J. Cosby, I.J. Fernandez, J.S. Kahl and M. Robbins Church
values. This explanation appears likely for East Bear. However, the BBWM soils adjust rapidly to changes in atmospheric deposition of SO4 and they should have been close to equilibrium at BBWM in 1991, having been subjected to higher loading prior to 1991. Under 1991 conditions, modelling suggests that East Bear apparently would slowly acidify, decreasing in alkalinity about 0.5meq L-1 yr-1. If soil CO
2 were increased by 0.4% to a
long-term average of 0.65%, it would take approximately 40 years for alkalinity to decline to values achieved in the same period with the base case conditions (1991 SO4
and PCO2). Thereafter, the system with elevated CO2
would be more acidic than for the base case conditions in the model simulation. Before that occurs, labile carbon for production of CO2 in soils might become limiting. (2) Dillon et al. (1997) suggested that drought affecting
central Ontario lakes resulted in lowering of the water
table and release of SO4, oxidized from reduced S in
organic matter. This mechanism would operate well in wetland-rich systems, but not at East Bear, which has no wetlands.
(3) Webster et al. (1990) argued that acidification of some seepage lakes was strongly influenced by the moisture budget; lower water supply resulted in evaporative concentration of acidic components. At East Bear Brook, there have been no obvious changes in hydrology that parallel the decline in alkalinity from 1988 to 1999. (4) Driscoll et al. (1989) suggested that declines in
atmospheric deposition of base cations may cause a decline in stream base cations, and thus alkalinity. Base cations have declined little, if at all, at BBWM from 1988 to 1999.
(5) Lastly, as SO4 inputs to soil water decline, the rate of base saturation loss should decline. However, the implied net adsorption should be less than the decline in SO4. At BBWM and at many other localities, the decline in base cations in stream waters exceeds the decline in SO4.
Summary
Variations in soil PCO2 at BBWM caused by variation in the snow pack appear to be responsible for variation of alkalinity production during the winter and early snow-melt period. The magnitude of variation (+/- 10 meq L-1) is comparable to
the increase in alkalinity expected by the reduction in atmospheric SO4 from 1990 to 1999. Soil PCO2 and surface water data with sufficient detail, and linked in space and time, are not available from appropriate catchments to
determine the extent to which declines in soil PCO2 may
cause declining stream and lake alkalinity in the northeastern USA and elsewhere. Theory, some field data, and limited
experiments, indicate that variations in soil PCO2 may
introduce significant uncertainty into the interpretation of time series for acid-sensitive surface waters. It is important, therefore, that this mechanism not be overlooked, so that policy and evaluations of trends in air emissions, precipitation chemistry, and surface water chemistry are based on understanding.
Acknowledgments
The helpful comments from Arne Henriksen, Richard Wright, and anonymous reviewers are appreciated. This research was supported by the U. S. Environmental Protection Agency through contracts CR813599 CR816261, CR821014, and R825762-01-0 to the University of Maine. The manuscript has been reviewed by the Agency but does not necessarily reflect the views of the Agency, and no official endorsement should be inferred. Research was also supported by grant (DEB9615199) from the National Science Foundation. This is contribution #2478 of the Maine Agricultural and Forest Experiment Station.
References
Berner, R.A. and Ji-Long, R., 1997. Alkalinity buildup during silicate weathering under a snow cover. Aquatic Geochem., 2, 301–312.
Castelle, A.J. and Galloway, J.N., 1990, Carbon dioxide dynamics in acid forest soils in Shenandoah National Park, Virginia. Soil
Sci. Soc. Amer. J., 54, 252–257.
Chen, H. and Beschta, R., 1999. Dynamic hydrologic simulation of the Bear Brook in Maine (BBWM). Environ. Monit. Assess.,
55, 53–96.
Clair, T.A., Dillon, P.J., Ion, J., Jeffries, D.S., Papineau, M. and Vet, R.J., 1995. Regional precipitation and surface water chemistry trends in southeastern Canada (1983-1991). Can. J.
Fisheries Aquat. Sci., 52, 197–212.
Clow, D.W. and Mast, M.A., 1999. Long-term trends in stream water and precipitation chemistry at five headwater basins in the northeastern United States. Water Resour. Res., 35, 541–554. Cosby, B.J., Wright, R.F., Hornberger, G.M. and Galloway, J.N.,
1985a. Modeling the effects of acid deposition: assessment of a lumped parameter model of soil water and stream water chemistry.
Water Resour. Res., 21, 51–63.
Cosby, B.J., Hornberger, G.M., Galloway, J.N. and Wright, R.F., 1985b. Time scales of catchment acidification: a quantitative model for estimating fresh water acidification. Environ. Sci. Tech.,
19, 1144–1149.
Cosby, B.J., Norton, S.A. and Kahl, J.S., 1996. Using a paired-catchment manipulation experiment to evaluate a paired-catchment-scale biogeochemical model. Sci. Total Environ., 183, 49–66. David, M.B. and Vance, G.F., 1989. Generation of soil solution
acid-neutralizing capacity by addition of dissolved inorganic carbon. Environ. Sci. Tech., 23, 1021–1024.
David, M.B., Vance, G.F. and Kahl, J.S., 1992. Chemistry of dissolved organic carbon and organic acids in two streams draining forested watersheds. Water Resour. Res., 28, 389–396. Dillon, P.J., Molot, L.A. and Futter, M., 1997. The effect of El
Niño-related drought on the recovery of acidified lakes. Environ.
Monit. Assess., 46, 105–111.
Driscoll, C.T., Likens, G.E., Hedin, L.O., Eaton, J.S., and Bormann, F.H., 1989. Recovery of surface waters in the northeastern U.S. from decreases in atmospheric deposition of sulfur. Environ. Sci.
Tech., 22, 137–143.
Fernandez, I.., Son, Y., Kraske, C.R., Rustad, L.E., and David, M.B., 1993. Soil carbon dioxide characteristics under different forest types and after harvest. Soil Sci. Soc. Amer. J, 57, 1115–1121. Jones, J.B. Jr. and Mulholland, P.J., 1998. Influence of drainage
basin topography and elevation on carbon dioxide and methane supersaturation of stream water. Biogeochemistry, 40, 57–72. Kahl, J.S., Norton, S.A., MacRae, R.K., Haines, T.A., and Davis,
R.B., 1989. The influence of organic acidity on the chemistry of Maine U.S.A. surface waters. Water, Air, Soil Pollut., 46, 221– 234.
Kahl, J.S. Norton, S.A., Haines, T.A., and Davis, R.B., 1993. Recent trends in the acid-base status of surface waters in Maine U.S.A.
Water, Air, Soil Pollut., 67, 281–300.
Kahl, J., Norton, S., Fernandez, I., Rustad, L. and Handley, M., 1999. Nitrogen and sulfur input-output budgets in the experimental and reference watersheds, Bear Brook Watershed in Maine (BBWM). Environ. Monit. Assess. 55, 113–131. Kopácek, J., Hejlar, J., Stuchlik, E., Fott, J. and Vesely, J., 1998.
Reversibility of acidification of mountain lakes after reduction in nitrogen and sulphur emissions in central Europe. Limnol.
Oceanogr. 43, 357–361.
Mitchell, M.J., Driscoll, C.T., Kahl, J.S., Likens, G.E., Murdoch, P.S. and Pardo, L.H., 1996. Climatic control of nitrate loss from forested watersheds in the northeastern United States. Environ.
Sci. Tech., 30, 2609–2612.
National Atmospheric Deposition Program, 1998. (Web site). Neal, C., 1988. EPCO2 variations in streamwaters draining an acidic
and acid sensitive spruce forested catchment in mid-Wales. Sci.
Total Environ., 76, 279–283.
Neal, C. and Whitehead, P.G., 1988. The role of CO2 in long term stream acidification processes: A modelling viewpoint. Hydrol.
Sci. J., 33, 103–108.
Neal, C., House, W.A. and Down, K., 1998. An assessment of excess carbon dioxide partial pressures in natural waters based on pH and alkalinity measurements. Sci. Total Environ., 210/211, 173– 185.
Norton, S.A. and Henriksen, A., 1983. The importance of CO2 in evaluation of effects of acidic deposition. Vatten, 39, 346–354. Norton, S.A. and Fernandez, I.J. (Eds.), 1999. The Bear Brook in
Maine. Environ. Monit. Assess., 55. Kluwer Acad. Pub., The Netherlands.
Norton, S., Kahl, J., Fernandez, I., Haines, T., Rustad, L., Nodvin,
S., Scofield, J., Strickland, T., Erickson, H., Wigington, P. and Lee, J., 1999. The Bear Brook Watershed, Maine (BBWM)
Environ. Monit. Assess., 55, 7–51.
Norton, S.A. and Kahl, J.S. Impacts of marine aerosols on surface water chemistry at Bear Brook Watershed, Maine USA.
Verhandlungen, Soc. Intern. Limnol. in press.
Norton, S.A., Wagai, R., Navratil, T., Kaste, J.M. and Rissberger, F.A., 2000. Response of a first-order stream in Maine to short-term in-stream acidification. Hydrol. Earth System Sci., 4, 383– 391.
Reuss, J., Cosby, B.J. and Wright, R.F., 1987. Chemical processes governing soil and water acidification. Nature, 329, 27–32. Roy, S., Norton, S., Fernandez, I. and Kahl, J., 1999. Linkages of P
and Al export at Bear Brook Watershed in Maine. Environ. Mon.
Assess., 55, 133–147.
Rustad, L.E. and Fernandez, I.J., 1998, Experimental soil warming effects on CO2 and CH4 flux from a low elevation spruce-fir forest soil in Maine. Global Change Biol., 4, 597–605.
Stoddard, J.L., 1987. Alkalinity dynamics in an un-acidified alpine lake, Sierra Nevada, California. Limnol. Oceanogr., 32, 825– 839.
Stoddard, J.L., Driscoll, C.T., Kahl, J.S. and Kellogg, J.H., 1998a. Can site-specific trends be extrapolated to a region? An acidification example from the northeast. Ecol. Applic., 8, 288– 299.
Stoddard, J.L., Driscoll, C.T., Kahl, J.S. and Kellogg, J.H., 1998b. A regional analysis of lake acidification trends for the northeastern U.S., 1982-1994. Environ. Monit. Assess., 51, 399–413. Stoddard, J.L., Jeffries, D.S., Lükewille, A., Clair, T.A., Dillon,
P.J., Driscoll, C.T., Forsius, M., Johannessen, M., Kahl, J.S., Kellogg, J.H., Kemp, A., Mannio, J., Monteith, D., Murdoch, P.S., Patrick, S., Rebsdorf, A., Skjelkvåle, B-L., Stainton, M., Traaen, T., vanDam, H., Webster, K.E., Wieting, J. and Wilander, A., 1999. Regional trends in aquatic recovery from acidification in North America and Europe. Nature, 401, 575–578.
Uddameri, V., Norton, S.A., Kahl, J.S. and Scofield, J.P., 1995. Randomized Intervention Analysis of the response of West Bear Brook Watershed to chemical manipulation. Water, Air, Soil
Pollut., 79, 131–146.
UN ECE, 1994, Protocol to the 1979 Convention on Long-range Trans-boundary Air Pollution on Further Reductions of Sulfur Emissions. Document ECE/EB.Air/40. Geneva.
Webster, K.E., Newell, A.D., Baker, L.A. and Brezonik, P.I., 1990. Climatically induced rapid acidification of a soft water seepage lake: Nature, 347, 374–376.
Wright, R.F., 1998. Effect of increased carbon dioxide and temperature on runoff chemistry at a forested catchment in southern Norway (CLIMAX Project). Ecosystems, 1, 216–225.