HAL Id: hal-01783526
https://hal.archives-ouvertes.fr/hal-01783526
Submitted on 2 May 2018
HAL is a multi-disciplinary open access
archive for the deposit and dissemination of
sci-entific research documents, whether they are
pub-lished or not. The documents may come from
teaching and research institutions in France or
abroad, or from public or private research centers.
L’archive ouverte pluridisciplinaire HAL, est
destinée au dépôt et à la diffusion de documents
scientifiques de niveau recherche, publiés ou non,
émanant des établissements d’enseignement et de
recherche français ou étrangers, des laboratoires
publics ou privés.
Reducing Freight Transport Pollution by using electric
vehicles
Christophe Rizet, Antoine Montenon
To cite this version:
Christophe Rizet, Antoine Montenon. Reducing Freight Transport Pollution by using electric vehicles.
TAP 2016 : 21st International Transport and Air Pollution Conference, May 2016, Lyon, France. 15p.
�hal-01783526�
Reducing Freight Transport Pollution by using electric
vehicles
Christophe RIZET* & Antoine MONTENON**
*IFSTTAR-AME-DEST, 14-20 bd. Newton. Marne-la-Vallée, France Email: [email protected]
** IFSTTAR-AME-SPLOTT, 14-20 bd. Newton. Marne-la-Vallée, France
Abstract
To mitigate the pollution of road transport, several cities in Europe have implemented ‘Low Emission Zones’ (LEZ). In order to plan the future of such questions for the Paris area, and to assess their impacts on traffic and air pollution, LEZ scenarios have been defined for freight vehicles: a ‘Business as Usual (BAU) scenario, a LEZ scenario, in which only the most recent vehicles are authorized, and two ‘electric scenarios, in which only electric vehicles can enter the zone limited by the motorway A86, an area of 385 km² for about 4.8 million inhabitants. The difference between the two electric scenarios is related to the hypothesis on the evolution of the technologies: In the first scenario, Diesel trucks can be replaced by equivalent electric powered trucks of the same payload. In the second scenario, only the vehicles with a payload below 5 tons could be replaced by the electric equivalent. So, every vehicle with a load over 5 tons has to be replaced by several smaller vehicles in the LEZ area.
This communication follows the RETMIF project (Reduction of Emissions from Freight Transport in the Greater Paris Region). Its main objective is to understand the potential impacts of a LEZ in the Paris metropolitan area, in particular for goods vehicles. In conjunction with this development of LEZ, there has been a huge evolution in the motor technologies for commercial diesel vehicles. The industrial companies have also began to develop new hybrid and electric technologies, in anticipation of the scarcity of fossil oil and the future potential regulations only enabling non-polluting vehicles.
Keys-words: (5 words) LEZ, freight, electric, pollution, companies
Introduction
Air quality is a very important topic for cities. Proportion of population exposed to air quality problems is high: in 2012, 36% of European urban population is concerned by a day limit on air concentration of PM10 (EEA, 2013). The city of Paris follows this assessment. In 2013, more than 9 on 10 inhabitants of the city were concerned by an overexposure to NO2 and PM10 in the air. Peaks of
pollution levels in 2014 and 2015 reopened the debate on that topic into media and politics.
Above the punctual regulations, the city of Paris actually wants to lower the pollutant emissions, and become a model to follow in Europe. Some initiatives have been taken: reduction of parking places, peak-hour restrictions, working groups on “100% non-Diesel deliveries”, prefiguration of a Low Emission Zone, etc.
Low Emission Zones (LEZ) is one of the solutions proposed by European Commission to lower the air pollution. Some have already been implemented in Europe, but their effect on the city economy, on workers, and on the environment is poorly known. The objective of the RETMIF project, funded by ADEME (French Agency on Energy and Environment) is to better know the effects of this regulation on companies and environment. Phase 1 of the project aimed to specify the different characteristics of Low Emission Zones in Europe, interviews with professionals throughout Europe, especially in London, Berlin, Göteborg and Paris, have been lead during the phase 2.
This paper follows the phase 3 of RETMIF. The objective is to know what effect a Low Emission Zone would have on goods transport in the Paris Region. It is structured as follows. Section 1 explains the impacts of European, national and local environmental programs, especially Low Emission Zones, with a focus on the reactions of companies concerning environment, as well as the difficulties that could be created by these regulations. Section 2 introduces the methodology of the quantitative part of
the study, by defining 4 scenarios of transport regulations for Paris region from now to 2025: 1 “Business as Usual scenario”, 1 Low Emission Zone scenario, and 2 scenarios 100% electric: one with goods vehicles replaced by electric vehicles with the same capacity, one with a maximum payload of 5 tones for goods vehicles (gross weight of 12 tones).
Politics for Environment and Transport
In 2002, European Commission implemented the sixth Environmental Action Program which set out to achieve a high level protection of human health. Different environmental goals have been defined to be achieved in 2020 or 2050. This program has been reinforced by the seventh Environmental Action Program which aims to define new higher standards for air quality. Current European goals in terms of pollution follow the Directive 2008/50/EC. This directive is based on Euro standards for vehicles. These standards, defined by a number (roman for HGV, Arabic for other vehicles), correspond to a limit of pollution mass per energy unit developed depending on the type of vehicle, the type of engine, the year of commercialization, and the type of pollutant. This limit is calculated through a driving-cycle standard (NEDC).
Member countries of the European Union and the European Environment Agency have to apply these programs by implementing national action programs in order to satisfy the pollution criteria. In France, two roadmaps for Environment have been set out during the past ten years : “the Grenelle Environnement (1 et 2)” and the “Loi pour la transition énergétique”. These two roadmaps consider the Environment as a global initiative, which has to be interpreted in the different faces of the national economy : energy, housing, transport, etc.
The goals of the Directive 2008/50/EC are not being reached in Europe, especially in urban areas. The European Commission launched in 2014 legal proceedings against countries in order to enhance the respect of the Directive.
Road transport is one of the main sources of pollutants, especially Nitrogen Oxides (NOx) and Particulate Matters (PM). In 2011, road transport produced 47% of all NOx and 14% of all PM10 (EEA, 2013). Diesel engines particularly are concerned by these pollutions, by being 4 to 100 times more polluting for NOx than gasoline engines – equivalent power and weight. Urban goods transport is a great contributor of pollution and greenhouse gases. In London, in 2010, freight transport was responsible for 24% of the CO2 emitted by road transport, 38% for the NOx and 37% for the PM10 according to Allen et al. (2012) and In French cities, this type of transport represent 35% of the NOx, and about 50% of the PM10 emitted by road transport, according to Gonzales-Feliu (2010).
In parallel, the most recent white paper on transport for European Union stresses the need to develop new sustainable transport systems, which consumes less energy, especially in urban areas. In France, the “Loi pour la Transition Energétique” has the ambition to reach a relative energetic independence in the country. That means to use less petrol and more biogas and electrical power (France has the capacity of producing more electricity than needed). It therefore enhances the use of electrical power within all the faces of economy, especially transport. At present, two types of electrical engines are promoted by the Ministry of Sustainable Development: direct electric engines using batteries and fuel cell engines powered by hydrogen, which creates the needs of new production and value chains in the energy economy, but which is much less restricting for vehicles by reducing the size and the weight of batteries.
One of the reasons of the growth of pollution in urban areas is the growth of mobility, and the use of older vehicles for doing short routes. This assessment has been verified for big cities like Paris through interviews during the RETMIF project.
A tool which is enhanced by the European Commission is Low Emission Zones (LEZ). These are “geographically limited zones that cover more than a very local area where there are problems from the point of view of atmospheric pollution, noise, the quality of urban life, traffic congestion and/or safety and in which specific restrictions are applied with regard to the volume and/or the nature of traffic in the zone” (UE, 2005).
The types of vehicles and associated Euro standards concerned by the LEZ are defined by the national, regional and local authorities. In 2015, there are about 210 LEZ in Europe, in 11 countries. Half of them are combined with a toll. The areas covered by these zones vary between 0.6 km² in Lisbon and 5700 km² in Styria (Austria). 99% of them concern HGVs, and about 75% concern personal cars and LCVs.
The method of enforcement widely influences the efficiency of the LEZ. In Europe, the two main methods of enforcement are the automatic enforcement by cameras reading the license plate on the vehicles, and the manual enforcement by municipal or national agents. In Amsterdam, the compliance rate rose from 66% in 2008 to 97% in 2010, while cameras have been implemented in 2009 (Broaddus et al., 2012).
Low Emission Zones are environmental policies, which has to be implemented and applied by the transport departments in the municipalities. That creates some troubles around the measure.
In fact, goods transport is often “forgotten” by the authorities (Dablanc, 2013), and is seen as the biggest pollution (air and noise) problem. But, reducing pollution by banishing different types of HGVs and LCVs creates number of evolutions in this economic sector, especially when speaking about investments for alternative fuel engines.
Low Emission Zones and Road Freight Transport.
This part is directly following two previous publications (Cruz et al., 2015, Dablanc et al. 2015) and the qualitative part of the RETMIF project.
The part 2 of the RETMIF project aims at interviewing goods transport professionals (companies, federations, associations, researchers, public authorities) in four cities : Paris, which hadn’t any LEZ at this time, London, Berlin and Göteborg (+ Stockholm), which have implemented their LEZ few years before. These interviews were separated in several parts: presentation of the company/institution, what they know and think about the environmental policies in their city/country, how they implement the notion of sustainable development in their institution, how they welcome the LEZ, what has changed several years after.
Most of goods transport companies and companies which use own-account transport can be divided in three types, which we won’t define precisely because of the fuzziness of the limits between them:
- Larger companies. They have enough funds for renewing their fleet quickly, by modifying their business models or not. In these companies, HGVs are renewed every 5 or 6 years, LCVs between every 6 months and every 3 years. Very few LEZ concern vehicles which are less than 6 years. Therefore, the measure doesn’t concern them at all, except for special vehicles, like waste collection vehicles. These companies have to ask an exemption pass, of redefine the routes of the vehicles for the time just after the implementation of the LEZ. The older vehicles drive outside the LEZ and the newer ones inside the LEZ.
- SMEs which depend on larger ones. Most of the time, the larger companies ask their subcontractor to have new vehicles in order to get a greener image. So, the LEZ doesn’t have any influence on them. We have the same thing for SMEs for which environment is a great part of their business model and competitiveness. But, LEZ can be a little loss of their competitiveness in comparison of other SMEs.
- The smaller companies have big troubles for complying with the LEZ. Some decide to merge with others or to use vehicle location for long time, but a lot have to shut up because the investment can be too high, or the subsidies provided by public authorities are too low. This case is very common in bigger cities because the vehicles cover less kilometers and therefore can be used longer.
Speaking about the link between environment and transport, especially goods transport, can have a different meaning depending on the location and the policies. When German, Swedish or Italian transport companies speak about environment, they speak more about ISO 14001 or gas and hybrid vehicles. In France and in London, most of the companies say: “we actually try to be aware of the new electric technologies for vehicles, but actually we don’t have a right business model for using it”. From a first point of view, big cities like Paris of London are particularly adapted for using electric vehicles: smaller trucks, less need of range, lots of stops in a small area, low speed, etc.
Environment concerns everybody, adapting it in a business way can be hard. Therefore, almost everybody feel reticent for using electric vehicles for a lot of reasons:
and market electrical trucks, but because of the price and of the small market, public authorities have to be very clear about what the future program on transport for cities and the regulations that will be defined. The regulations would help and constraint users for using electric vehicles. The business model for manufacturers is already too tight for evolving that way, in comparison to hybrid or gas vehicles.
- The supply of energy and fuel. There are quite few gas and electricity supply stations in France. And, refueling trucks during the night would be complicated; today, a lot of drivers take their trucks at home, in order to avoid the travel time between their home and the warehouse in the morning before doing their deliveries.
- The very low payload, compared to the GVW. The battery needed for bigger urban trucks is much too heavy, so there are no such trucks in the market. There are no such hybrid vehicles for the same reason. A change of regulations would force companies to use a number of smaller vehicles to replace one bigger. The price of the vehicles would not be a problem (with public funds, the price could be cheaper), but every vehicle would need a driver, which costs much more that the vehicles.
- But, thanks to the news developments works on electric vehicles, especially new fuel cells systems which are tanked by hydrogen composites, the battery and size problems about electric vehicles would be partially cleared.
Methodology
The scenarios
- The Business As Usual (BAU) scenario - The Low Emission Zone (LEZ) scenario - The 2 ‘electric’ scenarios
These two scenarios "100% electric" scenarios aim at quantifying what could be the evolution of emissions in a hypothetical situation where all freight vehicles would be electric. These two scenarios are the following:
In the first electrical scenario, we assume that any freight vehicle - regardless of its total maximum weight - is replaced by an electric vehicle of the same capacity. In this scenario, we assume that in 2025, the commercial vehicle manufacturers will manufacture electric vehicles with a payload up to 25 tons. Thus, the utility park used is identical to that found in the BAU scenario for capacity, but all vehicles run on electricity.
In the second electrical scenario, the maximum payload of an electric vehicle is assumed to be 5 tons, with a maximum gross weight of 12 tones. All vehicles with a payload higher than 5 tones are replaced by smaller electric vehicles, while maintaining constant total payload to keep a constant volume of potentially cargo. For simplicity, we consider two types of electric trucks: GVW vehicles included in 7.5 and 12 tones (maximum payload of 5 tons) and vehicle gross weight less than 7.5 tons (maximum payload of 2 tones). Eg a 11 tons of payload diesel truck, will be replaced in the second scenario by two electric L 5 tons of payload trucks and a two tones of payload truck. In contrast, a truck 14 tons of payload will be replaced in the second electric scenario by three trucks with a payload of 5 tons to minimize the increase in traffic : More electric commercial vehicles than today will be needed to transport the same load. We will estimate the increase in traffic
In each scenario, we will focus on CO2 and PM emissions, the only pollutants generated by electric vehicles. We study the same road sections and therefore the same traffic in each scenario.
In order to calculate road transport pollutant emissions in Paris region, and their evolution according to the different scenarios, the software CopCETE v4 has been used. CopCETE v4 has been developed by the CEREMA, and uses a Copert v4 basis with French data and adapted for a use with a Microsoft Excel interface.
CopCETE, as Copert, uses the following characteristics of vehicles:
- Different types of fuel: gasoline, Diesel, electric, hybrid, LPG - Different sizes of engines
- Euro standards from Euro 0 to Euro 6.
30 types of emissions can be calculated in CopCETE but we will calculate only 3 of them:
- Nitrogen oxides (NOx). In 2011, about 61% of the NOx emissions in France come from road transport (CITEPA, 2014)
- Particulate matter (PM10). In 2011, about 15% of the PM10 emissions in France come from road transport
- Carbone dioxide (CO2). In 2011, 33% of the CO2 emissions in France come from road transport.
CopCETE also distinguish hot engine and cold engine tail pipe emissions, and non-tail pipe emissions (PM, HAP, some metals) for brake and tires use.
Fleet evolution
To simulate the fleet evolution, we computed from statistical data on fleet, for each type of vehicles and for each year, the rate of vehicles still working for a given generation. On the other hand, we estimated the number of new vehicles entering the fleet per vehicle type, from what has been observed in other LEZ and from our scenarios. From the computed rate of survival, we estimate a theoretical law, in order to smooth the irregularities and to simulate the future evolution of the fleet, using the parameters of the statistical law. As suggested by Koli (2012), we used a Weibull statistical law, in which the rate of survival is : S(t)= e^(-〖(t/β)〗^α )
α determines how ‘incurved’ the function is and β is a parameter of temporal scale, which influences the vehicle median duration of life. Given the available statistics, we assumed α to be independent of the type of vehicle and we used the α estimated by Bourdeau (1997), which means that the speed of wear per type of vehicle does not varies along the years. The matching between the data observed and the Weibull law is then done by optimizing the parameter β for two types of vehicles: ‘road tractors’ and ‘trucks and vans’.
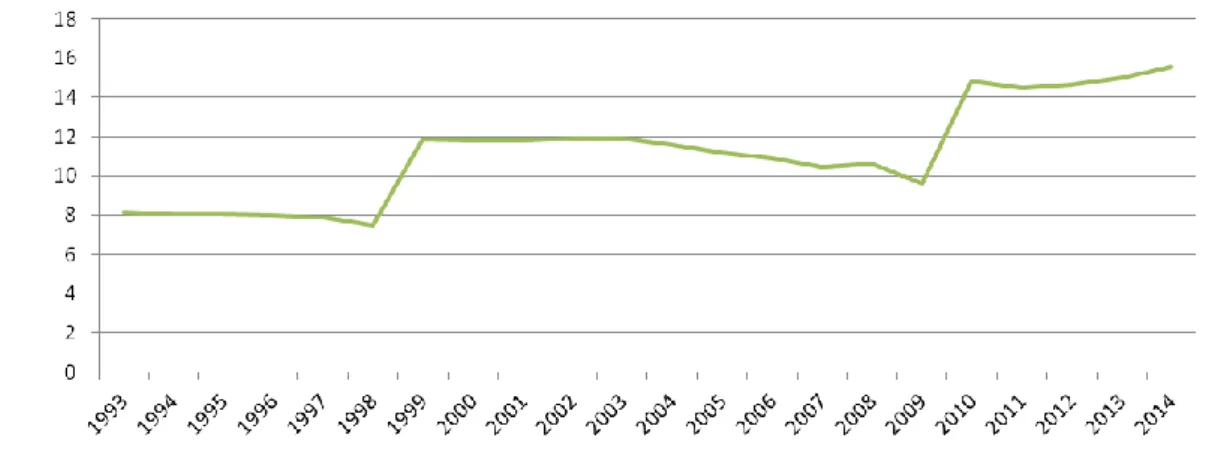
We are therefore interested in the categories of commercial vehicles, for which data of registrations are available far enough in the past. We then compare the results of optimal beta in the case of tractors and the trucks and vans, and then trace the evolution of optimal beta coefficient obtained between 1993 and 2014.
Figure 1: Determination of beta for vans (<3.5 t.)
In the case of vans (Figure 1), beta varies in steps: around 8 between 1993 and 1998 and between 10 and 12 until 2010 when it stabilizes at 14.9. These different levels can have various explanations, including buyer behavior can be encouraged by policy measures favoring renewal. But the landing between 2009 and 2010 was most likely a change in the way of counting vehicles: before 2009 were accounted for all vehicles less than twenty years after that date then only vehicles less
than fifteen years old are counted.
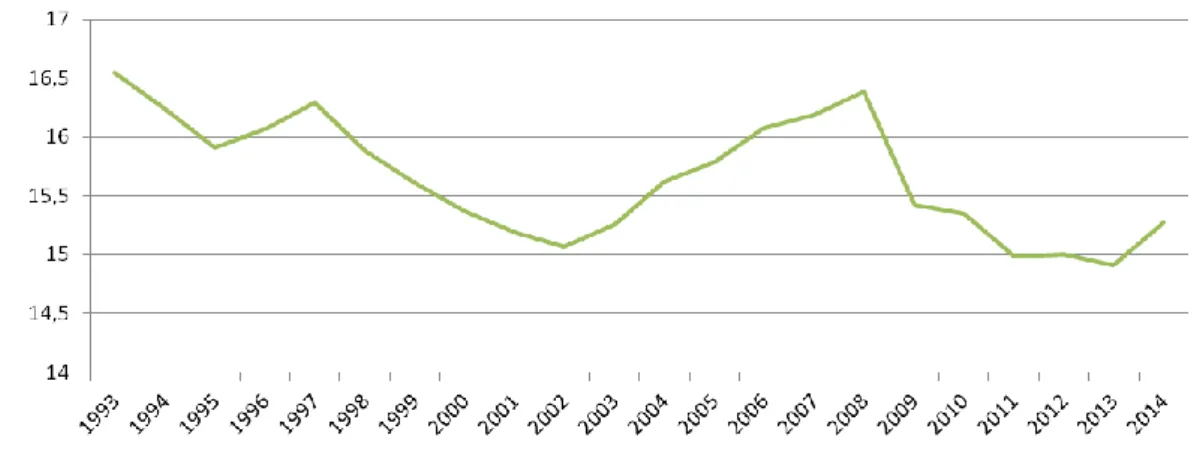
Figure 2 : Determination of beta for trucks
The variations of beta are much more pronounced in the case of heavy goods vehicles (Figure 2). Beta increases or decreases over long periods. As in the previous chart, we see the peak in 2009 probably due to the change in the way of counting. The beta value is between 15 and 17. Finally, to define the forecast changes, we retain the alpha values of Bourdeau, and we hold the average value of beta from 2009 as shown in the table below.
Table 1 : The coefficients alpha and beta we used
Vans Rigide trucks Tractors & trailors
Alpha 2,1 3,3 3,9
Beta 14,9 15,17 15
Implementation for fleets of the studied areas:
We evaluated the fleets circulating in four distinct areas: inner Paris, the first ring road (boulevard périphérique), the intra- A86 area and the A86 (second ring road). For each area, the categories of vehicles have been adapted to the structure of CopCETE software. Not having enough accurate data to estimate the parameters for each vehicle types, we assume that all types of vehicles of the same category (i.e. personal cars, vans, rigid trucks or trailer) follow the same law and, within the class, the types of vehicles are only differentiated by the data of the initial year.
In addition, as observed in the cases of Berlin and London during the RETMIF project, we assumed that the total traffic remains constant per vehicle subcategory, that is to say that any abandoned vehicle is replaced by a newer model of the same vehicle. This assumption allows analyzing the impact of fleet renewal, regardless of the trends between different subcategories.
Moreover, given that the share of electric vehicles is extremely low, and no regulatory or strong political will exists today on their development, we keep constant the percentage in both scenarios "over water" and " Reduced Emissions Zone. » The "electric" scenario will assess the possible impact of a change of clean vehicles.
The fleets in the ‘Business as Usual’ scenario
Our approach is therefore to estimate the fleet in each of the different area, implementing our statistical laws of survival defined above. Specifically, for a given vehicle type (eg diesel PL standard Euro 4), we assume that it is as likely to have been made in each year the standard was the latest in the market (Tables 2 and 3), and then we apply the survival coefficient corresponding to the years ahead.
For example, PL for Euro 4 diesel in 2014, about a third was registered in 2006 and the same for 2007 and 2008. For Euro 6, the number of vehicles also split in the different years, according to the
previous assumption of replacement of discarded vehicles.
Table 2: Years of registration of each Euro standard for HDV Conventionnel 1988 1989 1990 1991 1992 Euro 1 1993 1994 1995 Euro 2 1996 1997 1998 1999 2000 Euro 3 2001 2002 2003 2004 2005 Euro 4 2006 2007 2008 Euro 5 2009 2010 2011 2012 2013 Euro 6 2014 2015 …
Table 3 : Years of registration of each Euro standard for vans Conventionnel 1990 1991 1992 1993 1994 Euro 1 1995 1996 1997 1998 Euro 2 1999 2000 2001 Euro 3 2002 2003 2004 2005 2006 Euro 4 2007 2008 2009 2010 Euro 5 2011 2012 2013 2014 Euro 6 2015 …
This enabled to estimate the fleets in the “Business As Usual" scenario on each area for the years following the counting. These BAU fleets, compared to the "LEZ" scenario fleets, show the impact of a LEZ on the fleet. To determine the LEZ fleets scenario, we rely on rates of compliance of the LEZ observed in Berlin and London, taking into account the specificities of each of the capitals (eg Parisian fleet is initially oldest) and the type of control implemented. This gives the following table of compliance:
Table 4 : compliance rate of the LEZ per area and per year
2018 (manual control)
2021 (RFID control)
Inside Paris
Limitation : E5
VUL 70%, PL 65%
Limitation : E6
VUL 96%, PL 93%
Ring road
(Périphérique)
Limitation : -
E5: VUL 65%, PL 60%
Limitation : E5
E6 : VUL 90%, PL 85%
E5 : VUL 95%, PL 90%
Intra A86
Limitation : -
E5: VUL 65%, PL 60%
Limitation : E5
E6 : VUL 90%, PL 82%
E5 : VUL 95%, PL 90%
A 86
Limitation : -
E5: VUL 65%, PL 60%
Limitation : -
E6 : VUL 85%, PL 80%
E5 : VUL 90%, PL 85%
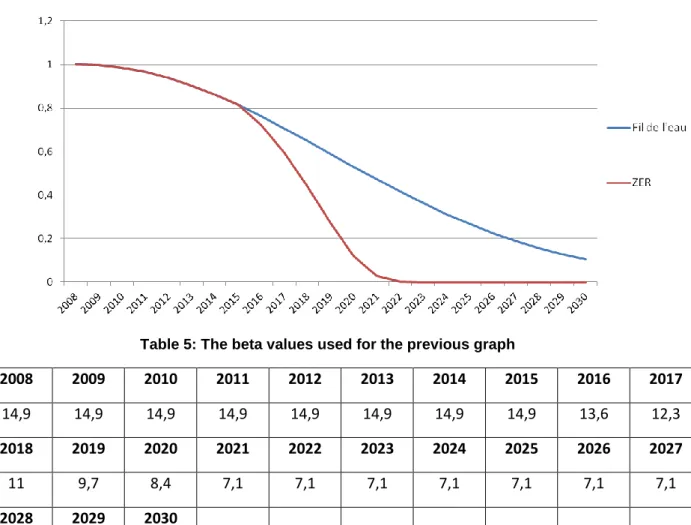
These rates have been obtained by modifying the beta coefficient of the Weibull distribution from the year of announcement of the new regulation, which corresponds to the acceleration of the fleet renewal observed in all low emission zones. Beta determines the median age of survival and its decrease leads to a lower lifetime for old vehicles. Figure 3 shows an example of a van registered in 2008).
Figure 3: changes in the law of survival: for a van registered in 2008
Table 5: The beta values used for the previous graph
2008
2009
2010
2011
2012
2013
2014
2015
2016
2017
14,9
14,9
14,9
14,9
14,9
14,9
14,9
14,9
13,6
12,3
2018
2019
2020
2021
2022
2023
2024
2025
2026
2027
11
9,7
8,4
7,1
7,1
7,1
7,1
7,1
7,1
7,1
2028
2029
2030
7,1
7,1
7,1
So we get ultimately estimates of the structure of the fleet (percentage of each traffic) for each year, for each zone and for scenarios BAU and LEZ.
Without a LEZ, 'natural' renewal of the old fleet with new vehicles in the latest Euro standard is gradual; the announcement and the implementation of a LEZ accelerates this renewal. Table 6 take the example of the evolution of trucks in Paris and allows us to further analyze the impact of the LEZ.
Table 6 : Evolution of the split of trucks in Paris according to their Euro norm
Euro standard BAU LEZ
2014 2018 2021 2025 2014 2018 2021 2025 Conventional 1,5% 0,2% 0,04% 0,02% 1,5% 0,03% 0,00% 0,00% Euro I 1,2% 0,4% 0,1% 0,05% 1,2% 0,1% 0,00% 0,00% Euro II 11, 6% 5,5% 2,3% 1,1% 11,6% 3,0% 0,00% 0,00% Euro III 23,5% 16,6% 10,6% 5,1% 23,5% 13,2% 0,00% 0,00% Euro IV 23,4% 20,3% 16,1% 10,1% 23,4% 18,7% 0,2% 0,1% Euro V 29,5% 28,3% 25,7% 21,7% 29,5% 27,7% 6,8% 3,3% Euro VI or more 9,4% 28,7% 45,2% 61,9% 9,4% 37,3% 93,0% 96,6%
La part des poids lourds les plus anciens (<= Euro II) est faible en 2021 dans le scénario au fil de l’eau et devient nulle ou négligeable dans notre scénario ZER ; l’impact de la mise en place d’une ZER sur ce parc ancien est donc faible (2,5%). En revanche, ces vieux véhicules ayant des
émissions très importantes par kilomètre, l’impact sur les émissions est beaucoup plus important. Pour les poids lourds plus récents (Euro III à V) qui représente 76 % du parc en 2014, l’impact de la ZER est beaucoup plus sensible sur l’évolution du parc : dans Paris la part de ces PL passe de 76% en 2014 à 7% dans le scénario ZER 2021 (-69%) contre 52% en 2021 dans le scénario fil de l’eau (-24%). La tendance est la même pour les VUL dans Paris.
Pour les zones géographiques hors Paris, le fait que les véhicules Euro 5 sont en service depuis 2009 pour les PL et 2011 pour les VUL implique que le scénario ZER 2021 n’aura que peu d’influence sur le renouvellement effectif du parc. Le taux de renouvellement naturel (au fil de l’eau) des PL et VUL est suffisamment rapide pour que la ZER ne provoque pas de bouleversement important. Dans Paris, l’impact est plus fort car la ZER implique de l’Euro 6 donc des véhicules 4 à 5 ans plus récents (Erreur ! Source du renvoi introuvable. et Erreur ! Source du renvoi introuvable.).
La ZER va augmenter la proportion (et donc le nombre) de véhicules utilitaires ‘propres’ de façon significative. Cette modernisation accélérée du parc a été déjà observée dans les autres pays (Londres et Berlin).
The share of the oldest trucks (<= Euro II) is low in 2021 in the BAU scenario r and becomes nil or negligible in our LEZ scenario; the impact of the implementation of the LEZ on this old stock is low (2.5%). However, for these older vehicles with very high emissions per kilometer, the impact on emissions is much more important than the impact on fleet.
For newer trucks (Euro III to V) representing 76% of the park in 2014, the impact of the LEZ is much more sensitive on the evolution of the park: in Paris the share of these trucks from 76% in 2014, decreases to 7% in the 2021 LEZ scenario (minus 69%) against 52% in 2021 in the BAU scenario (-24%). The trend is similar for vans in Paris.
For locations outside Paris, the fact that the Euro 5 trucks are in operation since 2009 (2011 for vans) means that the LEZ 2021 scenario will have little effect on the actual fleet renewal. The natural turnover (BAU) for trucks is fast enough for the LEZ does not cause major upheaval. In Paris, the impact is stronger because the LEZ involves Euro 6 vehicles, therefore 4-5 years more recent.
LEZ will increase significantly the proportion and therefore the number of clean freight vehicles. This accelerated modernization of the park following the implementation of a LEZ has already been observed in London and Berlin.
Computing emissions for electric vehicles
Electric vehicles do not emit CO2 directly during a journey, but we take into account the CO2 emissions upstream from the production of electricity used to operate the vehicle. For passenger cars (PC), the estimated average consumption (ADEME, 2014) per 100 km is 20 kWh. We will assume that all cars have the same consumption. Knowing that the French electricity emission factor is 53 gCO2 / kWh (MEDDE, 2012), a private car therefore emits around 10.6 gCO2 / km. For goods vehicles, emissions are calculated according to the power consumption, estimated by the following formula (Rizet et al, 2014b):
Electricity consumption per km (kWh / km) = 0.43 + 0.033 x GVW (tones)
This formula was found from consumption data of different types of electric trucks literature on the assumption that the relationship between power consumption and the GVW is linear. For light commercial vehicles (vans), the average gross weight is taken equal to 3 tons. In the same way as cars, we will use the emission factor of 53 g CO2 / kWh for the CO2 emissions for each type of commercial vehicles (Heavy Commercial Vehicles).
From the number of trucks and vans and composition of fleet in the four zones in 2025, we were finally able to calculate, for each zone, the CO2 emissions per linear kilometer of road. In the different scenarios
- Calculation method of PM emissions
but they produce emissions of particles, by resuspension as well as abrasion (tires, brakes and road surface).
Table 7 : Non tail pipe PM emissions per vehicle type, in g/km.
Vehicle type
Trucks
Vans
Cars
Non tail pipe PM
emission (g/km)
0,5732
0,05
0,0444
The values shown in Table 7 are the unit emissions per vehicle class data CopCETE. By summing the products of unit emissions by the number of vehicles, we finally get the PM emissions generated by the traffic of electric vehicles.
Results: vehicles and emissions
Local pollution of freight vehicles: the situation in 2011
Within the RETMIF project, the city of Paris sent us the data of the survey 'number plates' realized in 2011 to know various vehicle types circulating to Paris. These data were used with the software COPCETE V4 which calculates emissions by vehicle type, using the equations of COPERT 4. We present here the results of this analysis, focusing on the share of freight vehicles in the traffic and in its emissions.
In this plates survey, vehicle registration numbers are raised at various points, allowing, with the file of French vehicles registrations, to know their type, their energy, their year of first registration and pollution standard (Euro norm). The survey was conducted in week, 22 to 23 and June 28, 2011 from 8am to 10am and from 14h to 16h. The recorded sample of registrations recovered with a comprehensive traffic count.
We used these data for three types of roads: Motorways arriving in Paris, the ring road around central Paris (périphérique) and inside Paris. In this latter category, the survey points are mostly located on relatively large boulevards. The result of a road type is obtained by the weighted average traffic results of each point of inquiry of this type of road. For example Table 8 for motorway is the average of results from 3 survey points, one on the motorway A1, one on the motorway A4 and the third on the motorway A13, on their arrival in the capital. Emissions and traffic tables below are for 1 km of road, for 4 hours x 3 days of the week. Unfortunately we had not sufficient information to make an estimate of the overall emissions over the city for a year or even over a year at a given point, or even over 24 hours in a given point.
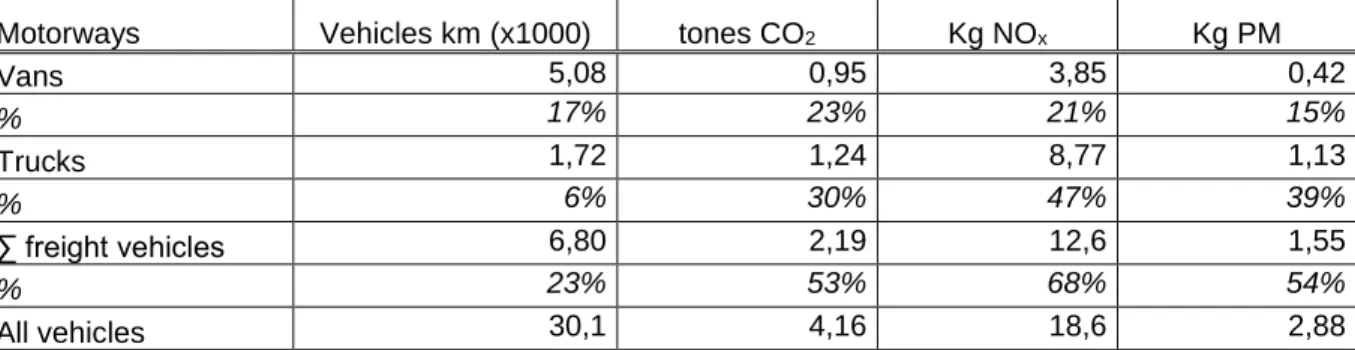
Importance of freight vehicles in the road traffic emissions in 2011: results by type of road: In Table 1, freight vehicles account in 2011 for 23% of the number of registered vehicles (vans 17% HGV 6%), 53% of CO2 emissions (23 and 30%), 68% of NOx (21 and 47%) and 54% of PM (15 and 39%).
Table 8 : Motorways arriving in Paris - % of freight vehicles in the traffic and in the emissions Motorways Vehicles km (x1000) tones CO2 Kg NOx Kg PM
Vans 5,08 0,95 3,85 0,42 % 17% 23% 21% 15% Trucks 1,72 1,24 8,77 1,13 % 6% 30% 47% 39% ∑ freight vehicles 6,80 2,19 12,6 1,55 % 23% 53% 68% 54% All vehicles 30,1 4,16 18,6 2,88
On the ring road (Table 2), freight vehicles account for 28% of traffic (19 and 8% respectively for vans and trucks), 63% of CO2 emissions (25 and 38), 77% NOx (19 and 58) and 64% PM (15 and 49). Compared to motorways, the volume of traffic is close, the share of commercial vehicles is somewhat higher (28% against 23%) and the share of emissions from these freight vehicles is more
important: 63% against 53% for CO2, 77% against 68% for NOx and 64% against 54% for PM.
Table 9 : Ring road (périphérique) - % of freight vehicles in the traffic and in the emissions Ring road Vehicles km (x1000) tones CO2 Kg NOx kg PM
Vans 6,09 1,43 5,65 0,55 % 19% 25% 19% 15% Trucks 2,61 2,19 17,4 1,81 % 8% 38% 58% 49% ∑ freight vehicles 8,70 3,62 23,0 2,35 % 28% 63% 77% 64% All vehicles 31,3 5,78 29,9 3,68
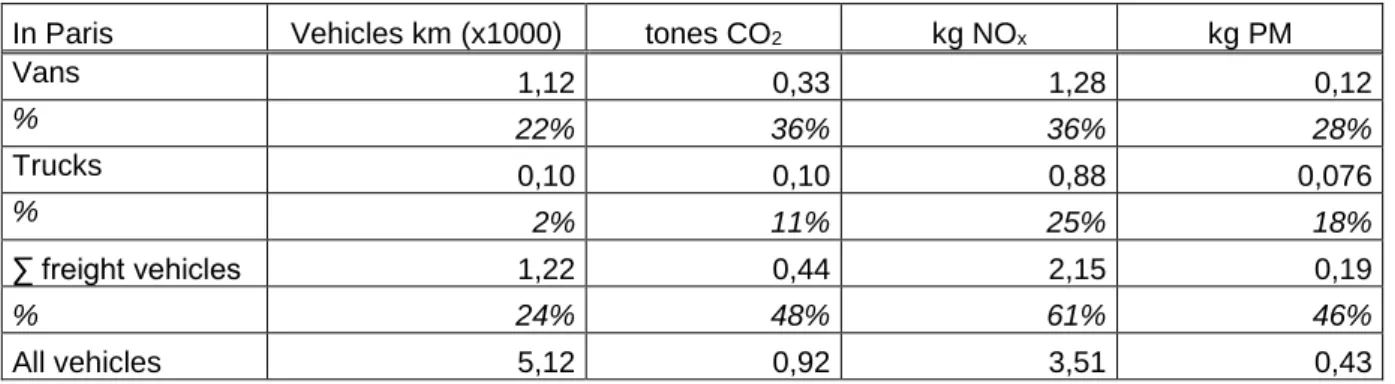
Inside Paris (Table 3), the traffic is on average much lower than on motorways or on the ring road (about 6 times less) and freight vehicles account for 24% of traffic but with less truck (2%). The share of emissions from freight vehicles is also lower: 48% for CO2 (11% for PL), 61% of NOx (25%) and 46% PM (18%).
Table 10 : Inside Paris - % of freight vehicles in the traffic and in the emissions In Paris Vehicles km (x1000) tones CO2 kg NOx kg PM
Vans 1,12 0,33 1,28 0,12 % 22% 36% 36% 28% Trucks 0,10 0,10 0,88 0,076 % 2% 11% 25% 18% ∑ freight vehicles 1,22 0,44 2,15 0,19 % 24% 48% 61% 46% All vehicles 5,12 0,92 3,51 0,43
For the 3 types of roads where traffic is known, freight vehicles (vans and trucks) are much more important for their emissions than for their traffic. They represent overall around a quarter of road traffic (23, 28 and 24% of vehicles km), half (53, 63 and 48%) of CO2 emissions, two thirds of NOx (68, 77 and 61%), and half of the particles (54, 64 and 46%). This share of freight vehicles in the total road emissions is higher than previous estimate for NOx (35%, according to Gonzales-Feliu 2010) and close for PM. So specific regulations on emissions of commercial vehicles could have a significant impact on the total emissions in the capital. We also noted that commercial vehicles have a greater share in traffic on motorways and ring road than within Paris.
Freight vehicles emissions in the 2025 scenarios Calculating emissions
Within Paris, an average emission value, weighted by the amount of traffic, is calculated from emissions on the different sections considered in the plate survey of the City of Paris in 2011. It is the same for the value of the emissions on the ring road (périphérique), where three sites are considered.
For non-electric scenarios, BAU and LEZ, we used the CopCETE tool for computing CO2 emissions and PM. So we can make a comparison of emissions based on different scenarios. Figures 4 (for CO2) and Figure 5 (for PM) here under show the evolution of computed emissions for
different scenarios in 2025 for the three areas: Paris, ring-road (périphérique) and intra A86 motorway.
Figure 4 : CO2 emissions (tones / km of road) by scenario and zone in 2025
For CO2 emissions there is not much difference between BAU and LEZ scenarios: The LEZ has very little influence on CO2 emissions since CO2 is not included in the emission Euro norms.
In electrical scenarios 1 and 2, the CO2 emissions have been considerably reduced in 2025 regardless of the geographical area. The reduction is less for electric scenario 2 because the number of vehicles increases. Indeed, the maximum threshold of 5 tones payload causes an increase in the number of vehicles and thus traffic. Compared with the BAU scenario, in the city of Paris CO2 emissions declines of 95% for the electric scenario 1 and 90% for the electricity scenario 2. These decreases are very important because the French electricity emission factor is low (53 g CO2 / kWh, ADEME, 2014), thanks to the high proportion of nuclear generation. These scenarios "100% electric" are extremely effective in terms of reducing CO2 emissions, for the three areas concerned, from the current French context. The energy situation may however change in the coming years.
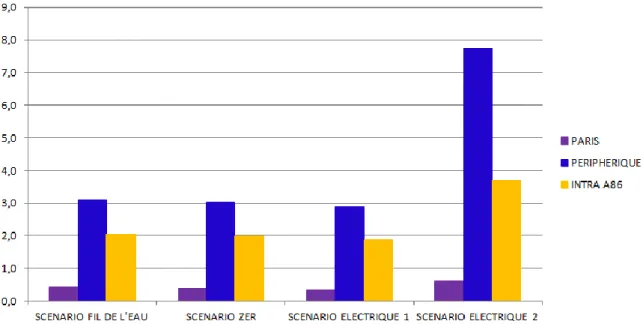
Figure 5: Estimation of PM emissions (kg/km of road) by zone in 2025 for the different scenarios
On PM emissions (Figure 5), the results are surprising at first. Indeed, we observe a very small decrease in emissions for the electricity scenario 1 compared to BAU and a real increase in emissions for electric Scenario 2. These phenomena are explained by the PM emission processes. The emissions in electric scenario 1, compared with the BAU scenario, decreased by 14.2%, respectively, 7.6% and 7.0% for Paris, the ring road and intra A86. These decreases are low because non tailpipe emissions (abrasion and re suspension) predominate for PM. For example, for a Euro 5 truck of less than 7.5 tones gross weight, non tailpipe PM emissions represent 96.6% of total PM. The phenomena of abrasion and resuspension also explain the significant increase in PM emissions for the electric scenario 2. Indeed, the traffic of trucks and vans increased by 293% 363% and 278% respectively, 2% for Paris, the ring-road and the intra A86. Thus the increase in emissions of the most important PM, 148.9% was observed for the ring-road, which is experiencing the greatest increase in traffic.
These results allow us to step back on the benefits of an electric scenario. But we must remember that the PM and indirect (upstream) emissions of CO2 are almost the only emissions of electric vehicles. For example, electric trucks don’t emit NOx nor PAH.
Urban trip distances and electric vehicles range
The electric trucks range is an important constraint for the electrification of urban freight1: we
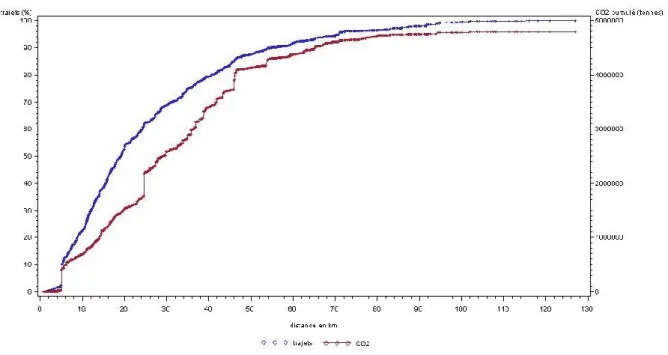
analyzed the distribution of freight traffic according to the distance of the legs in the electrical scenarios. The graph below (Fig. 6) shows the distribution of the number of urban legs according to their distance and thus the proportion of these legs which could be electrified in the electric scenario, according to the maximal distance considered for electric trucks. Nearly 90% of the legs are less than 50 km long. The figure below also shows the distribution of the urban CO2 emissions according to this distance.
Figure 6: Trip legs number and CO2 distribution according to the trip leg distance.
(Computed from Echo Survey, Cf. Rizet et al. 2015)
The percentage of trip legs can be read on the left axis and the corresponding CO2 emission level on the right axis: 87.6% of trip legs are less than 50 km and they emit 86% of the whole CO2 of the urban freight in the data base. At the opposite, legs beyond 100 km only represent 0.45% of the legs. The range currently announced for electric vans (around 100 km) would thus allow covering approximately 90% of the return electric routes of a French urban scenario. For the remaining 10%, it would be advisable either to improve electric trucks range (up to approximately 140 km), or to find a way to recharge battery before ending the round trip, or still to optimize the location of platforms by
1 Cf. Rizet et al. 2015 (City Logistics)
agreeing to reduce the zones of limitation of the Diesel traffic of freight below urban areas.
Electric vehicle capacity and the congestion in electric scenario 2
In electric scenario 2, a diesel truck with a payload of 11 tones will for example be replaced by two trucks of 5 tons payload and one 2 tones payload. In contrast, a 14 tons payload truck will be replaced in this second electric scenario by three 5 tons payload trucks, to minimize the increase in traffic.
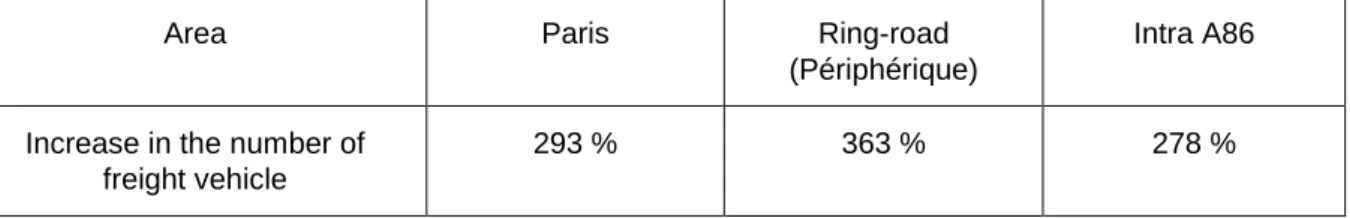
More electric freight vehicles will be needed to transport the same quantity of goods than today with large diesel trucks. The increase in traffic in electric scenario 2 compared with BAU, expressed in truck miles, is presented by region in Table 11
Tableau 11: Induced traffic in the electric Scenario 2 (% increase of freight vehicles) by Zone
Area Paris Ring-road
(Périphérique)
Intra A86
Increase in the number of freight vehicle
293 % 363 % 278 %
Conclusion
The implementation of a LEZ will force road transport professionals to adapt their behavior to the new regulations. Impacts will depend on the size of actors: bigger ones will not be much concerned by the measure, thanks to rental services and adaptation of their business models, smaller ones will have more trouble, they have less long-term visions and their evolution will depend on the time of preparation and the helps (services or funding) provided by authorities.
But, in Paris, despite the great funding provided by the city of Paris and the national funding for buying an electric vehicle, the cost of such vehicles seems to be too high for a punctual use. Another difficulty will be that most of these companies have no time for doing complicated administrative tasks. The companies which count more than 10 employees won’t have any funding from the municipality, so time for the evolution of the restriction has to be long enough for enabling these companies to comply.
Quantitatively speaking, the Low Emission Zone speeds up the modernization of the fleet. The impact the use of oldest vehicles will be low, but the resulting emissions will decrease much, due to the high emission factors. For newer vehicles, the LEZ would not have a great influence on their renewal, because the natural renewal of these utility vehicles is fast enough.
The impact on the fleet is higher in Paris than around the city, and reducing the flow of the utility vehicles is a priority because of the resultant polluting emissions. The highest impact would be for the NOx The most realistic electric scenario shows an increase of the congestion and of the non-exhaust emissions.
With these results, the industrialization of new fuel cell engines tanked by alternative fuels like hydrogen seems to be a good complement of the regulations, by reducing the cost of the vehicles (mostly due to the price of the battery). Therefore, such “electric policies” have to go with most globalized industrialization plans, developing technological and logistics solutions.
References
Allen, J., Browne, M. and Woodburn, A. London Freight Data report 2012 update. 2012
Boogaard, H., Janssen, N., Fischer P., Kos G., Weijers E., Cassée F., Van der Zee S., Hartog J., Meliefste K., Wang M., Brunekreef B., and Hoek G.. Impact of Low Emission Zones and Local Traffic
Policies on Ambient Air Pollution Concentrations. Science of the Total Environment, Vol. 435–436, 2012, pp. 132–140.
Bourdeau, B. 1997. Evolution du parc automobile français entre 1970 et 2020. PHD Thesis, Université de Savoie – Chambéry
Carteret M., André M., Pasquier A. 2014. Méthode d’estimation des parcs automobiles et de l’impact de mesures de restriction d’accès sur les émissions de polluants. Projet ZAPARC. Réalisé pour le compte de l’ADEME. 184 p.
Cruz, C., Montenon, A. Implementation and Impacts of Low Emission Zones on Freight Activities in Europe: Local Schemes Versus National Schemes. Transportation Research Procedia. Vol. 12, 2016, pp. 544–556.
Dablanc, L. Une grande oubliée, la logistique. In SEURA (Eds) , Les rendez-vous de la mégapole, AIGP2 saison 2. Atelier international du Grand Paris, 2013, pp 13-32.
Dablanc, L., Montenon, A., Impacts of Environmental Access Restrictions on Freight Delivery Activities - Example of Low Emissions Zones in Europe. Transportation Research Record: Journal of the Transportation Research Board Vol. 2478, 2015, pp. 12–18.
EEA, 2013 : Air Quality in Europe—2013 Report. European Environment Agency, Copenhagen, Denmark, 2013.
Gonzales-Feliu, J., Toilier, F. and Routhier, J.-L. End consumer goods movement generation in french medium urban areas. Procedia Social and Behavioral Sciences, Vol.2, 2010, pp. 6189-6204.
Hugrel, C., Joumard, R. 2004. Transport routier – Parc, usage et émissions des véhicules en France de 1970 à 2025. Document de l’INRETS
Kolli, Z. 2012. Dynamique de renouvellement du parc automobile. Projection et impact environnemental. PHD Thesis in economics, Université Paris 1
Rizet, C., Cruz, C., Vromant, M. The Constraints of Vehicle Range and Congestion for the Use of Electric Vehicles for Urban Freight in France, 9th Conference on City Logistics, Tenerife June 2015, Elsevier Procedia, pp 500-507
UE, 2005 : Report from the Working Group on Environmental Zones—Exploring the Issue of Environmentally-Related Road Traffic Restrictions. Joint Expert Group on Transport and Environment, Brussels, Belgium, 2005.