HAL Id: hal-00077601
https://hal-insu.archives-ouvertes.fr/hal-00077601
Submitted on 24 Jan 2013
HAL is a multi-disciplinary open access
archive for the deposit and dissemination of
sci-entific research documents, whether they are
pub-lished or not. The documents may come from
teaching and research institutions in France or
abroad, or from public or private research centers.
L’archive ouverte pluridisciplinaire HAL, est
destinée au dépôt et à la diffusion de documents
scientifiques de niveau recherche, publiés ou non,
émanant des établissements d’enseignement et de
recherche français ou étrangers, des laboratoires
publics ou privés.
Experimental study of arsenic speciation in vapor phase
to 500°C: Implications for As transport and fractionation
in low-density crustal fluids and volcanic gases.
Gleb S. Pokrovski, Ildar V. Zakirov, Jacques Roux, Denis Testemale,
Jean-Louis Hazemann, Andrew Y. U. Bychkov, Galina V. Golikova
To cite this version:
Gleb S. Pokrovski, Ildar V. Zakirov, Jacques Roux, Denis Testemale, Jean-Louis Hazemann, et al..
Experimental study of arsenic speciation in vapor phase to 500°C: Implications for As transport and
fractionation in low-density crustal fluids and volcanic gases.. Geochimica et Cosmochimica Acta,
Elsevier, 2002, 66, pp.(19) 3453-3480. �10.1016/S0016-7037(02)00946-8�. �hal-00077601�
PII S0016-7037(02)00946-8
Experimental study of arsenic speciation in vapor phase to 500°C: Implications for As
transport and fractionation in low-density crustal fluids and volcanic gases
GLEBS. POKROVSKI,1,
* ILDARV. ZAKIROV,2
JACQUESROUX,1
DENISTESTEMALE,3
JEAN-LOUISHAZEMANN,3
ANDREWYU. BYCHKOV,4
and GALINAV. GOLIKOVA4
1Institut des Sciences de la Terre d’Orle´ans (ISTO), UMR 6133 of CNRS, 1A rue de la Fe´rollerie, 45071 Orle´ans cedex 2, France 2Institute of Experimental Mineralogy (IEM-RAS), Chernogolovka, Russia
3Laboratoire de Cristallographie, UPR 5031 of CNRS, B.P. 166, 38042 Grenoble09, France 4Geological Department, Moscow State University, Moscow, Russia
(Received December 3, 2001; accepted in revised form April 22, 2002)
Abstract—The stoichiometry and stability of arsenic gaseous complexes were determined in the system As-H2O ⫾ NaCl ⫾ HCl ⫾ H2S at temperatures up to 500°C and pressures up to 600 bar, from both
measurements of As(III)
and As(V)
vapor–liquid and vapor–solid partitioning, and X-ray absorption fine structure (XAFS) spectroscopic study of As(III)
-bearing aqueous fluids. Vapor–aqueous solution partitioning for As(III)
was measured from 250 to 450°C at the saturated vapor pressure of the system (Psat) with a special
titanium reactor that allows in situ sampling of the vapor phase. The values of partition coefficients for arsenious acid (H3AsO3) between an aqueous solution (pure H2O) and its saturated vapor (K ⫽ mAsvapor
/mAsliquid) were found to be independent of As (III)
solution concentrations (up to ⬃1 to 2 mol As/kg) and equal to 0.012 ⫾ 0.003, 0.063 ⫾ 0.023, and 0.145 ⫾ 0.020 at 250, 300, and 350°C, respectively. These results are interpreted by the formation, in the vapor phase, of As(OH)3(gas), similar to the aqueous As hydroxide
complex dominant in the liquid phase. Arsenic chloride or sulfide gaseous complexes were found to be negligible in the presence of HCl or H2S (up to ⬃0.5 mol/kg of vapor). XAFS spectroscopic measurements
carried out on As(III)
-H2O (⫾NaCl) solutions up to 500°C demonstrate that the As(OH)3complex dominates
As speciation both in dense H2O-NaCl fluids and low-density supercritical vapor. Vapor–liquid partition
coefficients for As(III)
measured in the H2O-NaCl system up to 450°C are consistent with the As speciation
derived from these spectroscopic measurements and can be described by a simple relationship as a function of the vapor-to-liquid density ratio and temperature. Arsenic(III)
partitioning between vapor and As-concen-trated solutions (⬎2 mol As/kg) or As2O3solid is consistent with the formation, in the vapor phase, of both
As4O6and As(OH)3. Arsenic (V)
(arsenic acid, H3AsO4) vapor–liquid partitioning at 350°C for dilute aqueous
solution was interpreted by the formation of AsO(OH)3in the vapor phase.
The results obtained were combined with the corresponding properties for the aqueous As(III) hydroxide species to generate As(OH)3(gas) thermodynamic parameters. Equilibrium calculations carried out by using
these data indicate that As(OH)3(gas) is by far the most dominant As complex in both volcanic gases and
boiling hydrothermal systems. This species is likely to be responsible for the preferential partition of arsenic into the vapor phase as observed in fluid inclusions from high-temperature (400 to 700°C) Au-Cu (-Sn, -W) magmatic-hydrothermal ore deposits. The results of this study imply that hydrolysis and hydration could be also important for other metals and metalloids in the H2O-vapor phase. These processes should be taken into
account to accurately model element fractionation and chemical equilibria during magma degassing and fluid boiling. Copyright © 2002 Elsevier Science Ltd
1. INTRODUCTION
The great majority of natural processes in the Earth’s crust occur in the presence of fluid phases, aqueous or gaseous. Until recently, a huge number of experimental, theoretical, and field studies have been devoted to the transport of metals and the formation of ore deposits by dense aqueous fluids. However, fewer experimental and geological information is available on metal behavior and transport in low-density vapors that are ubiquitous in hydrothermal and volcanic environments. Ar-senic, one of the most common components in such environ-ments, is often present in significant amounts in minerals, fluid, and gas phases throughout different stages of the crustal fluid evolution, like the separation of hot volatile-rich magmatic fluids from a crystallizing deep pluton, the vapor– brine
segre-gation and boiling of the ascending fluids in porphyry-style and epithermal ore deposits, and the fumarolic activity in modern volcanic areas (Goldschmidt, 1954; Heinrich and Eadington, 1986; Ballantine and Moore, 1988; Migdisov and Bychkov, 1998). Knowledge about the chemical status and solubility of arsenic in the vapor phase is necessary to account for its distribution during the magmatic-to-hydrothermal/volcanic evolution of As-bearing fluids and to better understand the relative importance of different processes (boiling, fluid mix-ing, fluid– host rock interactions) leading to the ore precipita-tion of arsenic and related metals. The aim of this article is to provide new data on the identity and stability of As species existing in water vapor and to apply these results to better understand the role of the vapor phase in As transport and fractionation.
The important role of the high-temperature vapors in the geochemistry of this relatively volatile element has long been
* Author to whom correspondence should be addressed ([email protected]).
Pergamon Printed in the USA. All rights reserved
0016-7037/02 $22.00 ⫹ .00
recognized from analyses of volcanic gas condensates and sublimates. Arsenic concentrations often attain 1 to 10 ppm in the vapor condensates of volcanic gases sampled at tempera-tures from 400 to 900°C (e.g., Symonds, 1990; Mambo et al., 1991), and up to 0.1 wt% in mineral sublimates and incrusta-tions precipitated from the gaseous phase during volcanic erup-tions (e.g., Symonds et al., 1987; Quisefit et al., 1989). This corresponds to As enrichment factors in the gas phase with respect to the magma of 100 to 1000, suggesting an important transfer of As into the hydrosphere and atmosphere during magma degassing and volcanic eruptions. At lower tempera-tures (⬍350°C), in water-dominated active hydrothermal sys-tems, As was found to preferentially concentrate into the liquid aqueous phase. Arsenic vapor–liquid fractionation factors, measured in hot springs of modern geothermal fields, typically range from 0.001 to 0.01 at temperatures of 150 to 300°C (Smith et al., 1987; Ballantine and Moore, 1988; and references therein). Recent measurements of element concentrations in coexisting high-density brine (H2O-NaCl) and low-density
va-por (H2O-H2S-HCl) inclusions in quartz from
magmatic-hy-drothermal Cu-Au-Sn-Mo-W-As deposits, formed at tempera-tures from 400 to 700°C, have demonstrated strong enrichments of As, B, Cu, and Au in the vapor phase, in contrast to other metals (e.g., Fe, W, Pb, Zn, Sb) that prefer-entially concentrate in the liquid NaCl-rich phase (Aude´tat et al., 1998, Aude´tat et al., 2000; Heinrich et al., 1999; Ulrich et al., 1999). Arsenic vapor/liquid partition coefficients derived in these studies range from 1 to 10 at temperatures from 450 to 650°C and pressures corresponding to the two-phase equilib-rium in the H2O-NaCl system (300 to 500 bar). Vapor
separa-tion thus allows selective transport of As and associated metals (Au, Cu), and can greatly affect the evolution and distribution of magmatic-hydrothermal ore deposits (Heinrich et al., 1999). Quantitative understanding of As transport in the low-density fluid phase is, however, hampered by the lack of data on As chemical species identity and stability in this phase.
In recent years, effort has been made toward acquisition of thermodynamic and structural data for As aqueous species existing in high-temperature dense aqueous solution (density
ⱖ0.4 g cm⫺3) via both solubility measurements of As-bearing minerals and spectroscopic techniques. These studies have shown that As(III) hydroxide (mainly As(OH)3) and, to a lesser
extent, sulfide (H0 –3As1–3S3– 6) aqueous species are the main
As complexes in natural hydrothermal solutions depending on temperature, pH, and H2S content (Akinfiev et al., 1992; Helz
et al., 1995; Pokrovski et al., 1996, 2002a, and references therein). These and other earlier studies allowed generation of a consistent set of thermodynamic properties in the system H2O-As2O3-As2S3-FeAsS and thus permitted better constraint
of the stabilities and solubilities of the main As minerals such as arsenolite, orpiment, realgar, and arsenopyrite at hydrother-mal conditions (Akinfiev et al., 1992; Pokrovski et al., 1996, Pokrovski et al., 2002a). However, much less is known about arsenic speciation in low-density supercritical fluids (density ⱕ
⬃0.3 g cm⫺3
), hydrothermal steams, and volcanic gases. Cur-rently available databases (e.g., Pankratz, 1982; Gurvich et al., 1993; Symonds and Reed, 1993) present only thermodynamic properties of anhydrous gaseous species of arsenic (e.g., As4,
As4O6, AsO, AsS, AsCl3, AsF3) determined at low pressure
(⬍1 bar) in a water-free system. However, water represents
from 90 to 99% of volcanic gas and fumarolic vapor compo-sitions. A few experiments evidenced that hydroxide and hy-drated metal species (e.g., H2MoO4, Belton and Jordan, 1965;
Ca(OH)2, Al(OH)3, Si(OH)4, Hashimoto, 1992) can be
domi-nant at volcanic temperatures even at water pressures of 1 bar. These still scarce data imply an important role of the solvent (water) in the vapor speciation of metals and thus require systematic experimental studies for As and other elements.
The goal of this study was to obtain new information on the identity and stability of As species existing in natural vapors and low-density supercritical aqueous fluids. For this purpose, vapor/solid (As2O3) and vapor/aqueous solution (H2O-NaCl)
partition coefficients for As were measured as a function of water pressure and H2S, HCl, and NaCl content up to 450°C.
Extended X-ray absorption fine structure spectroscopic mea-surements were performed in situ on As2O3-H2O-NaCl
solu-tions in a wide range of temperatures (30 to 500°C) and solvent densities (0.1 to 1.1 g cm⫺3). The results were used to generate thermodynamic parameters for As(III)
and As(V)
hydroxide gas-eous species and to predict As speciation and fractionation in boiling hydrothermal systems and volcanic gases.
2. EXPERIMENTAL
2.1. As2O3Vapor-Phase Solubility and Arsenic Vapor–Liquid
Partitioning Measurements
2.1.1. Experimental materials and conditions
Measurements of As(III)partitioning between aqueous solution
(As-H2O ⫾ NaCl ⫾ NaOH ⫾ HCl ⫾ H2S) and its saturated vapor were
conducted with aqueous arsenious acid (H3AsO3) solutions of
concen-tration ranging from 0.0001m As to the saturation with respect to As2O3solid (⬎10m), at saturated vapor pressure of the system (Psat).
The following solution compositions and temperatures were investi-gated: pure water at 250, 300, and 350°C; H2O-NaCl solutions at 300,
350, 400, and 450°C; and H2O-H2S, H2O-HCl, and H2O-NaOH at
350°C (Tables A1 to A4 of the Appendix). Several measurements were also conducted with aqueous solutions of arsenic acid (H3As(V)O4) at
350°C with As(V)aqueous concentrations from 0.005 to 0.05m (Table
A5 of the Appendix).
Arsenious and arsenic acid solutions were prepared by dissolving, respectively, As2O3and As2O5solids (Merck Normapur) in deionized,
degassed H2O. Sodium chloride salt, or 1m HCl or 1m NaOH solutions
(Normapur) were added by weight in the As solutions to desired concentrations. To avoid possible As oxidation in the experiments with As(III), solutions were flushed for ⬃30 min with argon or hydrogen gas before loading into the reactor. Hydrogen sulfide was introduced in the reactor as aluminum sulfide (Al2S3, Normapur), which produces H2S
and Al hydroxide when reacting with water.
Measurements of As vapor–solid partitioning were performed on arsenolite (cubic As2O3) at 130, 220, 250, 265, and 300°C as a function
of water pressure ranging from 0 to Psat. Although at these conditions
arsenolite is considered to be thermodynamically metastable with re-spect to the monoclinic As2O3polymorph claudetite (Schulman and
Schumb, 1943; Pokrovski et al., 1996), all attempts to synthesize the necessary quantity of this monoclinic phase have failed. Arsenolite was always found to rapidly form in the presence of aqueous solution or water vapor. This was in agreement with previous studies that reported a very slow kinetics of arsenolite-to-claudetite transition, and, by contrast, the extreme facility for arsenolite to form in the system As2O3-H2O (e.g., Rushton and Daniels, 1926; Schulman and Schumb,
1943). Consequently, arsenolite was chosen for measurements to 300°C in the present study. Arsenolite was synthesized via the disso-lution of As2O3in oxygen-free H2O at 200°C, followed by a slow
cooling to ambient temperature. Because arsenolite melts between 275 and 315°C (Rushton and Daniels, 1926), measurements at 350°C were performed with molten As2O3. The molten phase was obtained directly
As2O3melting was inferred from both the measured solubilities (see
below), and optical and X-ray diffraction analyses of the quenched solid products after experiment, which showed the only presence of glassy As2O3. Vapor–solid partitioning measurements were conducted
via two complementary techniques (Tables A6 and A7 of the Appen-dix), allowing either rapid quenching at the end of the experiment or in situ sampling of the vapor phase. Vapor–liquid partitioning experi-ments were performed with a sampling technique (see below).
2.1.2. Quenching technique
Dissolution experiments of arsenolite in undersaturated water vapor at 130, 220, 265, and 300°C were performed in ⬃40 cm3titanium-alloy
(VT-8) reactors held in an air-thermostated oven (SNOL-3.5M). Tem-perature gradients were minimized to less than 0.1°C per autoclave height by placing a wall-thick copper cylinder into the oven. Details about the experimental equipment and procedure were similar to those described by Migdisov et al. (1998), Migdisov et al., (1999) and Archibald et al. (2001). A 7-cm-long, 0.5-cm-inner-diameter Pyrex ampoule opened at its top that contained 0.5 to 1 g of dry solid was placed into the autoclave. A weighed amount of deionized and de-gassed water was introduced with a syringe at the bottom of the reactor outside the ampoule. The reactor volume was determined before ex-periments, both geometrically from the reactor and ampoule dimen-sions and by filling with pure water at controlled temperature (22 ⫾ 1°C). Pressure was estimated from the reactor free volume and loaded amount of water according to the PVT properties of pure water vapor (Kestin et al., 1984); we assumed that the low concentrations of As in the vapor did not significantly modify these properties. At the end of the run, the reactor was quenched in cold water for 15 min, the Pyrex ampoule was weighed, and the As2O3solid and water condensed on the
reactor walls and bottom were washed with a weighed amount of 0.1m NaOH solution, which was then analyzed for As (see below). The ampoule was dried at 105°C during a few hours and weighed again. Arsenic quantity dissolved in the vapor, calculated from the ampoule weight loss and from analyses of the washing solution, was always the same, in the limit of ⫾10 wt% of the value. As demonstrated in this (see below) and previous studies (Migdisov et al., 1998, Migdisov et al., 1999; Zakaznova-Iakovleva et al., 2001), the quenching technique can be effectively used for studying vapor–solid equilibria in simple systems involving solids easily condensable on cooling.
2.1.3. Sampling technique
In the case of vapor–liquid coexistence, a rapid irreversible redistri-bution of the solute and solution (condensation on colder parts of the reactor, boiling of the solution) occurs during both heating and cooling. This inevitably results in poor reproducibility and overestimation of the solubility in the vapor phase (Alekhin and Vakulenko, 1988; Migdisov et al., 1999). Therefore, the quenching technique described above could not be used for vapor–liquid partition measurements. Consequently, all vapor–liquid partition measurements, and also some vapor-phase As2O3solubility experiments (at 250 and 350°C), were performed with
a specially developed reactor. The experimental technique is modified after that described in Zakirov and Sretenskaya (1994). The method allows both in situ separation of a part of the vapor phase at the end of the experiment and extraction of vapor samples through a capillary tubing during the run. The experimental apparatus consists of a ⬃100-cm3internal volume Ti-alloy (VT-8) pressure vessel (Fig. 1) placed in
a ⬃80 cm-height vertical furnace. Temperature is maintained within
⫾0.2°C by two heating resistances independently regulated by a
Eu-rotherm-900HP programmer and K-type (Chromel-Alumel) thermo-couples. Vertical temperature gradients were minimized in an empty reactor before experiments by adjusting the electric power of each resistance so that they did not exceed 0.3°C per autoclave height (⬃30 cm). An opening on the vessel top was connected to sampling valve and pressure transducer via titanium and 316SS capillary tubing. Dead volumes of the pressure and sampling lines were 0.6 cm3. Pressure was
measured with a P60 tensor transducer manufactured at the Institute NII-TEPLOPRIBOR (Moscow) and connected to a Keithley-2000 mul-timeter. The reproducibility of measurement at maximum experimental pressure (⬃300 bar) was within 1 bar. In the upper part of the vessel was fixed a ⬃10 cm3cylindrical rigid Ti ampoule with a cover fitted to
the ampoule body via a platinum ring seal. The ampoule can be tightly closed, through a hole in its cover, via a valve fitted in the vessel obturator. Graphite-based (Cefigraf) seals around the stem allow the valve operation during experiment without fluid leakage. The free volumes of the equipped vessel and ampoule were determined by filling with deionized degassed water (section 2.1.2). They were assumed to not change in the limit of their uncertainties (⫾0.5%) at experimental temperature and pressure. The charged vessel and ampoule were accu-rately weighed before and after each experiment to assure nothing was lost to leakage.
In the beginning of the experiment, weighed experimental solution (20 to 40 g) or solid As2O3(0.5 to 1.5 g) with necessary amount of
water were placed at the bottom of the reactor. At the run temperature, the solution did not enter the ampoule, which is situated in the upper part of the reactor occupied by the vapor phase and kept closed by the valve (Fig. 1). During vapor–liquid partitioning experiments at
ⱖ300°C, samples of vapor condensate were periodically taken via the capillary tubing. Two to four successive aliquots of 0.3 to 0.7 g each were withdrawn in every sampling session. They were weighed, diluted (if necessary), and analyzed for As, Na, and pH (see below). The first aliquot of the condensate, which served to wash the sampling capillary, was usually rejected. No systematic variations of metal concentrations and pH were recorded in the following samples. At the end of the experiment, the ampoule was gently opened to minimize the rate of pressure drop as a result of volume increase, which could result in a rapid adiabatic fluid expansion and consequently a decrease in temper-ature, vapor recondensation, or solution boiling. The ampoule remained open for 10 to 60 min to equilibrate the system and was then closed; the reactor was then taken out of the furnace and cooled to room temper-ature by compressed air. The ampoule was weighed, opened, and washed with H2O or H2O-NaOH solutions to remove all the solid and
liquid condensed on its walls. The mass of water condensate trapped in the ampoule always matched, within 10%, the calculated mass using the ampoule volume and water vapor density at the given temperature and pressure.
Fig. 1. Schematic drawing of the titanium-alloy reactor used for vapor–liquid and vapor–solid partitioning measurements.
Arsenic concentrations determined after the experiment in the resi-due of the liquid phase (if present) from the reactor corresponded to the limit of 5% to their counterparts calculated from the initial solution concentrations and mass of vapor samples, demonstrating that no loss of As, other than through sampling, occurred during the experiments. Arsenic vapor concentrations for similar solutions measured after both sampling via capillary (“extraction technique”) and trapping into the ampoule (“ampoule technique”) were always close to one another (Tables A1, A2, and A4 of the Appendix). This demonstrates that both methods were adequate for vapor–liquid fractionation studies for at least relatively soluble elements (As) and vapor densities higher than 0.04 g cm⫺3(see below).
At lower densities, corresponding to the undersaturated water vapor or vapor–liquid equilibrium at temperatures lower than 300°C, the quantity of the vapor phase in the reactor (⬍2 to 3 g) was too small to be accurately sampled via capillary. Consequently, vapor–liquid parti-tion runs at 250°C and As2O3solubility experiments in undersaturated
water vapor at 250 and 350°C were conducted using only the ampoule technique (Table A6 of the Appendix).
2.1.4. Analytical methods and vapor–liquid composition calculations
Arsenic concentrations in sampled or quenched vapor condensates as well as aqueous solutions before and after the experiment were mea-sured by atomic absorption spectroscopy (AAS) with acetylene–air flame (Pokrovski et al., 2002a), colorimetry with the arsenic molybdate blue complex (Marczenko, 1986; modified by Pokrovski, 1996), and titration with iodine (Charlot, 1966), depending on As content in the experiments. Details about these analytical techniques are described elsewhere (Pokrovski, 1996; Pokrovski et al., 2002a). Combination of these methods allows accurate analyses (⫾2%) of both total As (AAS and colorimetry) and AsV(colorimetry) and AsIII(titration) in a wide
concentration range (from 0.01 to 10000 ppm As). Arsenic concentra-tions of the same experimental soluconcentra-tions analyzed by the three methods were always the same within ⫾5%.
Sodium concentrations in the condensates from selected NaCl-rich experiments were measured in the range 0.02 to 10 ppm via acetylene– air flame emission spectroscopy at an emission line of 589 nm with a reproducibility of ⫾5% and a detection limit of 0.01 ppm Na. Values of pH were measured at ambient temperature (20 ⫾ 2°C) with a combination pH glass electrode calibrated on the activity scale using the National Institute of Standards and Technology (NIST) tartrate, phthalate, phosphate, and borate buffers (pH20°C⫽ 1.69, 4.00, 6.87 and
9.21, respectively) and 0.1m HCl and 0.01m NaOH solutions (pH20°C
⫽ 1.10 and 12.10, respectively).
Sodium vapor-phase concentrations measured in the system H2
O-NaCl-As using the sampling through capillary at 300 and 350°C were found to be in reasonable agreement with data available in the literature (see compilation of Bischoff and Pitzer, 1989). For example, the average NaCl concentration in the vapor in equilibrium with a ⬃4 molal NaCl solution at 350°C measured in this study, ⬃0.0004m (Table A4), is close to the corresponding value reported by Bischoff and Pitzer (1989), ⬃ 0.0005m. At higher temperatures, however, the sampling gives values usually lower by a factor of 5 to 10 than most of the data cited in the literature. This discrepancy likely arises from the possible NaCl precipitation in the cold capillary tubing during sampling in the present study. This is confirmed by the fact that a few measure-ments carried out in this study at 400 and 450°C by the ampoule technique, which avoids temperature gradients and thus irreversible fractionations (section 2.1.3), have provided vapor NaCl concentrations close to the literature data in the limit of ⫾30% of the value (Table A4). The values of pH measured in both vapor condensates and liquid from experiments in the H2O-NaCl-As(III) system were essentially neutral,
indicating that the hydrolysis of NaCl to produce NaOH and HCl is not important up to at least 450°C, in agreement with previous studies (Bischoff et al., 1986).
Arsenic, NaCl, and NaOH equilibrium concentrations in the liquid phase at each sampling were calculated via the mass balance from the initial solution composition and amount, measured As and Na concen-trations in the vapor phase, and the amount of samples taken. The estimation of the masses of vapor and liquid at equilibrium, necessary for calculation of the liquid-phase concentrations, requires knowledge of the vapor and liquid densities and the reactor volume. The density of
the vapor phase was derived from the pressure measured before each sampling with the PVT properties of pure water (Kestin et al., 1984) and assuming that small amounts of As, NaCl, or H2S/HCl in the vapor
(mole fraction ⬍0.01) do not significantly modify these properties. The vapor densities calculated via this approach in the system NaCl-H2O at
350 to 450°C were identical, in the limit of ⫾5%, to those reported by Khaibullin and Borisov (1966) and Bischoff (1991). The liquid-phase densities for H2O-As-HCl-H2S dilute solutions were assumed to be
equal to those of pure water, and those for H2O-NaCl solutions were
taken from the compilation of Bischoff (1991). For vapor–liquid par-titioning experiments carried out on H2O-NaCl-As solutions, the
mea-sured pressures and derived NaCl liquid-phase concentrations were in reasonable agreement with the composition-pressure two-phase equi-librium curve for the system H2O-NaCl reported in previous studies
(Bischoff and Pitzer, 1989, and references therein).
Vapor-phase concentrations of hydrochloric acid in H2O-HCl-As
experiments were determined from the pH of the vapor condensates. The corresponding liquid-phase HCl concentrations were calculated via the mass balance and the density approximations as discussed above. The obtained HCl vapor/liquid partition coefficients were in good agreement with those measured by Simonson and Palmer (1993). Vapor- and liquid-phase concentrations of hydrogen sulfide in H2
O-H2S-As experiments were calculated via the mass balance as described
above and H2S Henry constants reported by Suleimenov and Krupp
(1994).
2.2. X-Ray Absorption Spectroscopy Spectroscopy
X-ray absorption spectroscopy (XAFS) (including the X-ray tion near edge structure region or XANES, and extended X-ray absorp-tion line structure or EXAFS) was performed on ⬃0.3m H3AsO3
(⫾NaCl) aqueous solutions prepared at described above (section 2.1.2), at temperatures from 30 to 500°C and pressures 250 and 600 bar. The spectra were collected in transmission mode at the As K-edge (⬃11870 eV) over the energy range 11800 to 12800 eV, at the collaborative research group IF BM32 beam line at the European Synchrotron Radiation Facility (ESRF; Grenoble, France). The storage ring was operated in the multibunch filling mode at 6 GeV with 100 to 200 mA current. The beam energy was selected with a Si(111) double crystal monochromator with sagittal focusing. The focusing at BM32 beam line allows to reduce the beam size on the sample to ⬃0.3 ⫻ 0.3 mm while keeping a high X-ray photon flux (⬃1013photons/s per sample).
Experimental solutions were placed in a special high-pressure cell developed at the Laboratoire de Cristallographie (Grenoble, France). Details about cell construction and handling can be found elsewhere (Tamura et al., 1995; Soldo et al., 1998). The apparatus consists of a polycrystalline sapphire optical cell (Fig. 2a) that is inserted in a super high tension steel vessel. The vessel has a water-cooling jacket and two Be windows for X-ray passage (Fig. 2b). The sapphire cell contains two inner tubes, each having one closed and polished end (⬃0.15 mm of thickness) and an outer coaxial tube. The experimental solution is placed in a gap between the two polished ends, which serve as X-ray windows. The thickness of the sample space is adjusted so that the jump in X-ray absorption at the absorption edge was about unity. The cell has a sample reservoir attached to the end of the outer tube. The reservoir and the sample space are connected through a narrow channel between the inner and outer tubes. The temperature in the sample space is maintained by Mo heating resistances and Pt-Pt/Rh thermocouples connected to a Eurotherm temperature regulator. The cell is pressurized by high-purity grade helium gas with low absorption constant for X-rays. Pressure in the sample space is always balanced with that of He gas through the liquid surface in the reservoir. Thus, the sample thickness is kept constant at high T and P, and thin sapphire walls are never broken by stress. This design permits operation at up to 2000°C and 2 kbar.
Because the length (⬃volume) of the sample space always remains constant, with increasing temperature at constant pressure, the solution in the sample space expands into the reservoir. The absorption jump of a spectrum in such cell configuration is proportional to the fluid density times absorber (As) concentration per unit mass of fluid. It was found that the change in the absorption jump with temperature (and pressure), both on heating and cooling, closely follows that of the fluid density (assumed to be equal to that of pure water or NaCl-H2O solutions; see
above). This demonstrates that neither loss of the solution occurs via evaporation through the sample reservoir nor precipitation of As-bearing phases takes place in the sample space or channel.
Spectra acquisition and analysis were similar to those described in Pokrovski et al. (2000), Pokrovski et al., (2002b). To obtain the necessary signal-to-noise ratio, three to six scans (of ⬃1 h per scan) at each temperature for each solution were performed up to high k values (⬃15 Å⫺1). After acquisition, all scans were carefully inspected, and if
they were found to be reasonably free of beam intensity fluctuations and other flaws, they were added together. As2O3(cubic and glassy),
NaAsO2, As2O5, and Na2HAsO4·7H2O solids, which serve as model
compounds for As local environment, were recorded in the transmis-sion mode at ambient temperature. XAFS data analysis was performed by the SEDEM (Aberdam, 1998) and XAFS2.6 (Winterer, 1997) soft-ware packages, following the standard procedure (Teo, 1986). The structural information about As atomic environment (identity of first and second (if present) neighbor atoms, distances between As and their neighbors, average coordination numbers, and the Debye-Waller fac-tors) was obtained from the least-square fit of the raw EXAFS spectrum or inverse Fourier transform for each atomic shell. Backscattering amplitude and phase-shift functions were extracted from the solid references for As-O or computed by the FEFF 6.01 ab initio code (Zabinsky et al., 1995; Ankudinov and Rehr, personal communication) for As-As, As-Na, and As-Cl pairs. The influence of the self-absorption and disorder (thermal and static) on determining accurate structural parameters was tested by use of the cumulant expansion method (e.g., Farges et al., 1996; Soldo et al., 1998). Possible multiple scattering phenomena within the first As coordination shell were also checked by using the FEFF 6.01 code. Self-absorption, disorder, and multiple scattering phenomena were found to be too weak to significantly affect As structural parameters. Explicit account for the temperature–pressure evolution of these contributions will be provided elsewhere later.
3. RESULTS AND DISCUSSION
3.1. XAFS Spectroscopy
XANES of all As-bearing solutions (data not shown) exhibit shapes and edge-crest positions close to those of arsenolite, As2O3-glass and sodium arsenite (NaAsO2). This suggests a
valence state ⫹3 for arsenic in solution, and likely a pyramidal configuration with three oxygen neighbors in the first atomic shell of arsenic, similar to those in these solids (Loehr and Plane, 1968; Pertlik, 1978). No changes in shape and edge energy that could indicate the presence of arsenate (As5⫹
O4),
As(aq), or H3As(aq) were observed at any temperature and
pressure for a run duration up to 2 d. This demonstrates that neither As oxidation nor reduction occurred in our experimen-tal solutions.
Normalized EXAFS spectra and their corresponding Fourier transforms for ⬃0.3m arsenious acid aqueous solutions (⫾10 wt% NaCl) at 250 and 600 bar as a function of temperature are reported in Figures 3 and 4 . The derived structural parameters (distances, number of neighbors, degree of disorder) are sum-marized in Table 1. All spectra exhibit a single contribution from the oxygens of the first As atomic shell. Modeling these spectra gives 3 ⫾ 0.3 oxygens in the first shell with a mean As-O distance of 1.78 ⫾ 0.01 Å in the temperature range 30 to 500°C. This is consistent with the predominance of the
Fig. 2. (a) Schematic drawing of an optical cell used for XAFS measurements. (b) Photograph of the pressure vessel mounted at BM32 beam line of the ESRF.
As(OH)3°, in agreement with the previous Raman spectroscopy
and solubility studies (Loehr and Plane, 1968; Pokrovski et al., 1996; Gout et al., 1997). The spectra of As(III) aqueous solu-tions at 250 and 600 bar are very similar at all temperatures, suggesting that the As(OH)3structure remains the same both in
high-density aqueous solution and low-density supercritical fluid (0.1 g cm⫺3 ⱕ density ⱕ 1.1 g cm⫺3; Table 1). The structural parameters derived from the spectra of the 10 wt% NaCl-H3AsO3fluid at 600 bar are identical, in the limit of their
uncertainties, to those of its pure water analog. This demon-strates the absence of significant (⬎10%) amounts of As chlo-ride or hydroxy-chlochlo-ride inner-sphere complexes, in agreement with thermodynamic calculations (Heinrich and Eadington,
1986; Pokrovski et al., 2002a). No second shell contributions that could arise from neighboring As in polymeric species, Na, or Cl presented in outer-sphere complexes, nor were oxygens from the water hydration sphere detected. Note that the As-O distances changed very little as temperature increased (in the limit of 0.01 Å from 30 to 500°C). This behavior is similar to that of other strongly bound OH/O aqueous complexes such as modybdate (MoO4
2⫺
) and wolframate (WO4 2⫺
), which also exhibit only minor changes in their metal-oxygen distances (within 0.01 Å) in a wide temperature range (Mosselmans et al., 1996; Hoffmann et al., 2000). Strongly hydrated cations (e.g., Ag⫹, Sr2⫹
; Seward et al., 1996, Seward et al., 1999) and aqueous neutral or charged complexes with a more ionic
char-Fig. 3. k2-weighed EXAFS spectra at As K-edge of a 0.3-m arsenious acid aqueous solution at 250 bar and indicated
temperatures (a) and their corresponding Fourier transforms (b). Dashed curves represent single-shell fit to the total EXAFS spectrum; solid vertical line indicates the first As atomic shell, composed of three oxygens in the As(OH)3complex. No
changes in As-O distances were detected from 30 to 500°C. The high noise associated with the spectrum at 500°C is due to the decrease of the fluid density (by 10 times in comparison with 30°C).
acter (e.g., SbCl3– 4, Oelkers et al., 1998; CuCl2–3, Collings et
al., 2000; ZnBr3– 4, Mayanovic et al., 2001) demonstrate, by
contrast, significant shortening of the hydration shell radius and metal-ligand bond length with increasing temperature, typically
⬃0.10 Å in the range 25 to 300°C. This contraction is in
agreement with the temperature changes in solvent–solute in-teractions, including such factors as dielectric saturation and solvent compressibility (e.g., Shock et al., 1992; Oelkers et al., 1998). Thus, the constancy of the As-O bond length over the wide temperature (30 to 500°C) and density range (1.1 to 0.1 g cm⫺3) implies that as a result of a strong covalent character of the As-OH bonds (Pauling, 1948) and the absence of significant hydration around the As(OH)3° molecule or interactions with
Na and Cl, the increased thermal vibration with temperature has no significant effect on the interatomic distances and the struc-ture of the first As atomic shell.
3.2. Arsenic Vapor–Liquid Partitioning
Detailed information about the arsenic vapor–liquid parti-tioning measurements performed in this study for different systems as a function of As, HCl, H2S, NaCl, and NaOH
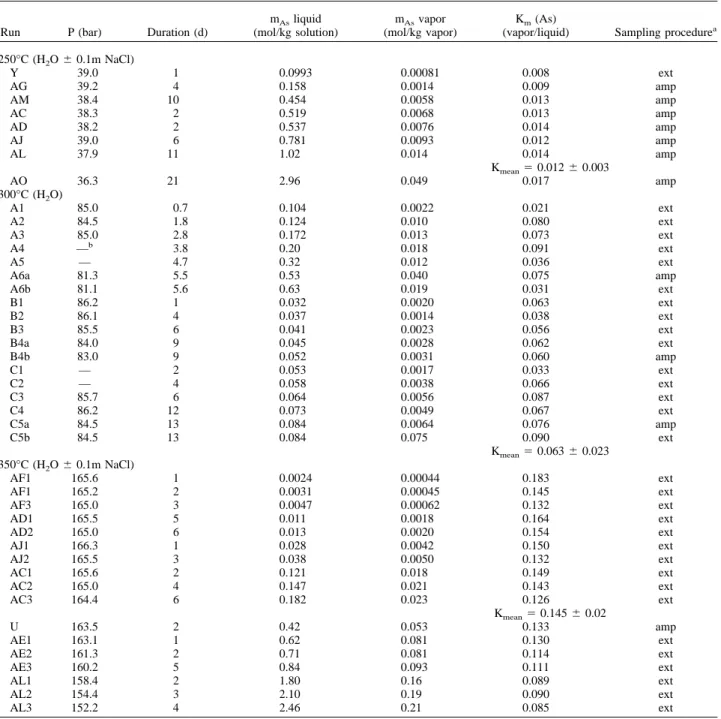
concentrations is presented in Tables A1 to A5 of the Appen-dix, and the average data for a given temperature and system composition are summarized in Table 2. In this article, arsenic vapor–liquid partition coefficient, Km, is defined as the ratio of
As concentration in the vapor (mol/kg of vapor) and liquid phase (mol/kg of solution) in equilibrium:
Km⫽mAsvapor(mol/kg)/mAsliquid(mol/kg). (1)
Note that in dilute (As ⬍ 1m) H2O solutions, this equation
corresponds to the conventional molality units (mol/kg H2O).
In highly concentrated solutions and in the presence of
signif-Fig. 4. k2-weighed EXAFS spectra at As-K edge of ⬃0.35-m arsenious acid aqueous solutions with and without NaCl
at 600 bar and indicated temperatures (a) and their corresponding Fourier transforms (b). The vertical line in Fig. 4b denotes the first As atomic shell composed of three oxygens. No detectable changes in the number of neighbors (ⱕ0.5 atoms) and As-O average distances (ⱕ0.01 Å) occur from 30 to 500°C.
icant amounts of salt (NaCl), the use of the molality scale is more ambiguous because H2O activity becomes very different
from 1. Consequently, in the present study, we decided to use the more universal partition coefficient defined by Eqn. 1.
It can be seen in Tables A1 to A5 that the values of Kmat a
given temperature and similar solution compositions obtained by sampling through capillary or trapping into the ampoule are the same in the limit of their uncertainties. This demonstrates the validity of both techniques for studying As vapor solubil-ities in a wide range of temperature (at least from 250 to 450°C) and vapor density (at least from 0.005 to 0.20 g cm⫺3). The values of Kmobtained at 250 and 300°C for similar As liquid
concentrations are independent of the run duration longer than a day or two, thus suggesting a rapid attainment of equilibrium for As between solution and vapor. At higher temperatures, the equilibrium was considered to be attained within a few hours. The results on As vapor–liquid partitioning are discussed below for each system.
3.2.1. Pure water
The data on As(III) partition between H3AsO3-H2O solution
and its saturated vapor at 250, 300, and 350°C are presented in Table A1 of the Appendix. In Figure 5, arsenic concentrations in the vapor phase are plotted vs. their corresponding liquid-phase contents. It can be seen in this figure that at low to moderate As liquid-phase contents (up to ⬃1m), measured equilibrium vapor-phase As concentrations are linearly propor-tional to their corresponding liquid-phase concentrations. The slopes (in log scale), at all temperatures investigated, are equal to 1 in the limit of the uncertainties (Fig. 5). As was shown by XAFS spectroscopy in the present study and by previous Ra-man spectroscopy and solubility measurements (Pokrovski et al., 1996; Gout et al., 1997), the monomeric As(OH)3complex
entirely dominates arsenic speciation in aqueous solution of arsenious acid to ⬃1m at temperatures higher than 200°C. As a result, the same monomeric species As(OH)3is likely to form
Table 1. Structural parameters of the first arsenic– oxygen atomic shell obtained from fitting As K-edge EXAFS spectra of As(III)-bearing aqueous fluids recorded as a function of pressure and temperature.a
Solution
composition P (bar) T (°C)
Fluid density
(g cm⫺3) Fitted k range(Å⫺1) (atom)NAs-O R (Å)
2(Å2) 2 0.30m H3AsO3 250 30 1.00 3.0–15.0 3.0 1.78 ⫺0.0003 0.13 250 300 0.74 3.0–14.6 3.2 1.78 0.0008 0.10 250 375 0.51 3.0–13.5 3.3 1.78 0.0018 0.14 250 500 0.09 3.0–10.0 3.3 1.78 0.0050 0.18 0.35m H3AsO3 600 30 1.02 3.0–14.9 3.2 1.78 0.0002 0.11 600 300 0.79 3.0–14.9 3.3 1.79 0.0010 0.10 600 375 0.67 3.0–14.7 3.5 1.78 0.0016 0.13 600 500 0.21 3.0–14.5 3.2 1.79 0.0060 0.14 0.35m H3AsO3 600 30 1.10 3.0–14.5 3.0 1.78 ⫺0.0005 0.12 ⫹1.8m NaCl 600 300 0.90 3.0–14.9 2.9 1.78 0.00006 0.11 600 375 0.79 3.0–14.9 3.0 1.78 0.0003 0.10 600 500 0.56 3.0–14.5 3.2 1.78 0.0004 0.15 ⫾0.3 ⫾0.01 ⫾0.0003
aConcentrations are expressed in mol/kg of solution (m); densities for H
2O-H3AsO3 and H2O-H3AsO3-NaCl solutions were approximated
respectively by those for pure water (Kestin et al., 1984) and for H2O-NaCl (Potter and Brown, 1977). R ⫽ arsenic-oxygen mean distance; N ⫽ As-O
coordination number; 2⫽ squared Debye-Waller factor (relative to the first shell of As
2O3(cub) solid at ambient temperature and pressure); 2
⫽ D/(F ⫻ M) ⫻ ⌺共Yexp2 ⫺ Yfit2兲, where D ⫽ number of independent data, F ⫽ degrees of freedom, M ⫽ number of data points fitted, and
Yexp2 ⫺ Yfit2 ⫽ difference between experimental and fitted squared EXAFS absorption coefficient (k2·X) of the raw signal for each point (Press et
al., 1986).
Values in the last row represent average uncertainties for R, N, and 2.
Table 2. Average vapor/liquid partition coefficients for As(III) and As(V) in dilute (⬍1m As) H2O, H2O-HCl, and H2O-H2S solutions; Henry
constants of reactions 2 and 3; and standard molal Gibbs free energies of As(OH)3(gas) and AsO(OH)3(gas) at corresponding temperature at Psat.
T (°C) Solution composition Average vapor/liquid partition coefficient, (Km) Henry constant, Kh(bar/mol/kg) ⌬G°T,Psata (kJ/mol) 250 H3AsO3-H2O 0.012 ⫾ 0.003 0.0084 ⫺677.9 ⫾ 4.2 300 H3AsO3-H2O 0.063 ⫾ 0.020 0.097 ⫺703.6 ⫾ 5.6 350 H3AsO3-H2O 0.145 ⫾ 0.020 0.432 ⫺727.1 ⫾ 6.7 350 H3AsO3-H2O-HCl(ⱕ0.1 m) 0.165 ⫾ 0.015 — — 350 H3AsO3-H2O-H2S(ⱕ0.5 m) 0.146 ⫾ 0.037 — — 350 H3AsO4-H2O 0.039 ⫾ 0.006 0.116 ⫺830.9⫾?b aCalculated from the values of K
hand using the thermodynamic properties for As(OH)3(aq) and AsO(OH)3(aq), respectively, from Table 4 and
Shock et al. (1997).
in the water vapor in equilibrium with these solutions according to the reaction
As(OH)3°(aq) ⫽ As(OH)3°(gas), (2)
which is consistent with the slope (S) d log mAs(gas)/d log
mAs(aq)⫽ 1, where m is the corresponding As concentration.
The formation in the vapor phase of other alternative monomer
species such as HAsO2or As(OH)3·nH2O, also consistent with
a slope of 1, can be excluded because neither changes in As coordination and distances in the first atomic shell (NAs-O⫽
3.0; RAs-O⫽ 1.78 Å) nor second-shell water molecules were
detected by our EXAFS measurements (see above) of super-critical fluids with densities close to those in the vapor phase (e.g., density ⬃0.1 g cm⫺3both at 350°C/P
satand 500°C/250
Fig. 5. As(III) vapor-phase vs. corresponding liquid-phase concentrations (log mol/kg of solution) measured in the system As2O3-H2O at vapor–liquid equilibrium at 250, 300, and 350°C and Psat. Open squares ⫽ experimental data obtained in this
study for dilute and moderately concentrated arsenious acid solutions; straight solid lines ⫽ linear regression of these data points; closed symbols ⫽ data for the solutions saturated with respect to solid As2O3at each temperature. Dashed lines were
bar). No stable hydration shell around the As(OH)3molecule
was also predicted, from thermodynamic considerations, in aqueous solution at these temperatures (Pokrovski et al., 1999). Molecular orbital calculations suggest that hydration can be neglected when estimating the energetics of As oxy-hydroxide neutral molecules in solution (Tossell, 1997). In the case of a pyramidal structure, the lone pair of electrons on the As(OH)3
prevents close approach of the oxygen atom of water. Because the density of the saturated water vapor from 250 to 350°C is 100 to 5 times lower than that of the liquid water, the formation of a stable hydration shell around the neutral gaseous As(OH)3
is unlikely. Although oxy-hydroxide species with reduced metal coordination such as HBO2or HAlO2have been reported
at high temperature for other metals and metalloids like boron and aluminum (Chase et al., 1985), thermodynamic calcula-tions demonstrate that their stabilities are extremely low at temperatures below 800°C and water pressures above 1 bar, in comparison to B(OH)3and Al(OH)3. As a result, As(OH)3(gas)
is likely to dominate As speciation in the vapor in equilibrium with dilute aqueous solutions up to the critical point of water, and in supercritical low-density fluids at temperatures to at least 500°C.
It can be seen in Figure 5 that at As liquid-phase concentra-tions higher than ⬃1m, there is a clear deviation from the linear relationship in the log mAs(vapor)vs. log mAs(liquid)plot, with a
progressive decrease of the slope up to the point of solution saturation with As2O3. Recent Raman spectroscopy
measure-ments (Gout et al., 1997) and ab initio calculations (Tossell, 1997) have shown that neutral cyclic oligomeric As oxy-hy-droxide species such as As3O3(OH)3, As4O6, and probably
As6O6(OH)6form at the expense of the As(OH)3monomer in
these concentrated solutions at temperatures above 150°C. The decrease of the slope can thus be explained by a significantly lower volatility of these heavier species in comparison to As(OH)3, and by a progressive decrease of the activity
(⬃con-centration) of the latter species in solution with increasing total aqueous As content. For example, for the reaction As3O3(OH)3(aq) ⫹ 3 H2O ⫽ 3 As(OH)3(gas), and assuming
that the activities of neutral species can be approximated by their corresponding concentrations, S should be equal to 1/3. This is in agreement with S ⬍ 1 observed at mAsⱖ 1m at
350°C (Fig. 5c). More quantitative interpretation of the As vapor-phase solubilities in equilibrium with these concentrated solutions is, however, difficult because of the few data points obtained at concentrations above 0.5 m As as well as the absence of the stability constants for the As oligomeric aqueous complexes. Nevertheless, the results of our measurements clearly show that As(OH)3is the dominant As-bearing species
in the vapor phase of the system As2O3-H2O at Psat.
Several liquid-vapor partitioning measurements were also performed at 350°C for arsenic acid (H3AsO4, Table A5). The
obtained partition coefficients are independent, in the limit of their uncertainties, of As(V)
aqueous concentration ranging from 0.007 to 0.05m. The complex AsO(OH)3°(aq) is
consid-ered to be the dominant species in aqueous solution at the
Fig. 6. As(III) vapor/liquid partition coefficient (Km) as a function of
HCl or H2S concentration in the vapor phase at 350°C and Psat. The
values of Kmin the presence of HCl and H2S are the same as in pure
water and independent of HCl or H2S concentration. This demonstrates
that As-chloride and As-sulfide complexes are negligible; and the As(OH)3dominates in the vapor phase at HCl and H2S contents typical
of hydrothermal fluids. Fig. 7. As(III) vapor/liquid partition coefficient (Km) as a function
of solution pH at 350°C and Psat(upper graph). The symbols represent
average values from experiments reported in Tables A1 to A3; the solid curve shows the percentage (with respect to total As) of the aqueous As(OH)3species in solution. The calculated distribution of As
hydrox-ide species in solution as a function of pH at an ionic strength of 0.05 is shown in the lower graph. With increasing pH, the measured Km
values closely follow the amount of the neutral As(OH)3in solution,
thus demonstrating that charged aqueous species (AsO(OH)2 ⫺)
conditions of our experiments, as shown by thermodynamic calculations (Sergeeva and Khodakovsky, 1969; Baes and Mes-mer, 1976) and recent XAFS spectroscopic measurements (Testemale et al., unpublished data). As a result, a species of the same stoichiometry forms in the vapor phase according to the equilibrium
AsO(OH)3°(aq) ⫽ AsO(OH)3°(gas). (3)
The average Kmvalue for reaction 3 at 350°C reported in Table
2 indicates that arsenic acid is by a factor of 4 less volatile than its As(III) analog, arsenious acid.
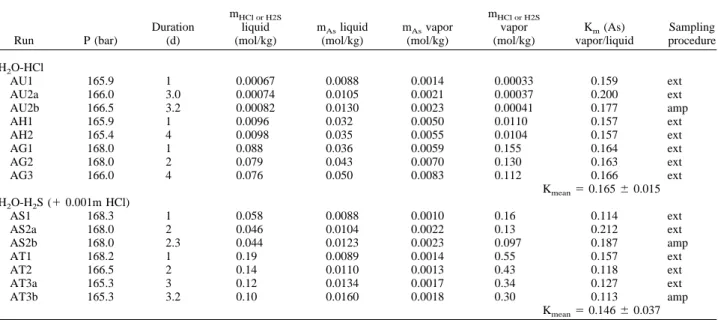
3.2.2. H2O-HCl, H2O-H2S, and H2O-NaOH
Details on the measurements of As(III) vapor–liquid parti-tion for dilute arsenious acid aqueous soluparti-tions in the presence of HCl or H2S at 350°C are reported in Table A2 of the
Appendix. In Figure 6, the values of Km (As) derived from
these experiments are plotted as a function of HCl or H2S
vapor-phase concentration. It can be seen that Km values are
identical to those in the pure-water system (section 3.2.1), and remain constant, in the limit of their uncertainties, up at least to 0.2m HCl and 0.5m H2S in the vapor phase. Previous solubility
measurements (Pokrovski et al., 1996; Pokrovski et al., 2002a) and thermodynamic calculations (Heinrich and Eadington, 1986; Akinfiev et al., 1992) indicate that sulfide and chloride As(III) complexes are negligible in near neutral H2S and
mod-erately acid HCl solutions, respectively; and the hydroxide As(OH)3 complex remains the dominant species. This result,
together with the independence of Kmof H2S and HCl
con-centrations, indicates that As sulfide or chloride gaseous spe-cies should be insignificant, and the As(OH)3complex is
dom-inant in the vapor phase in equilibrium with such solutions. Measurements of As vapor–liquid partition for arsenious acid alkaline solutions at 350°C are reported in Table A3 of the Appendix. The corresponding Kmvalues are plotted in Figure
7 as a function of pH, together with those for H2O-HCl
solu-tions discussed above. Because As(OH)3°(aq) is known to
Fig. 8. As(III) vapor–liquid partition coefficients for H2O-NaCl
solutions as a function of NaCl liquid concentration. Open symbols ⫽ experimental data points at indicated temperature; closed symbols ⫽
Km⫽ 1 at the critical points of the NaCl-H2O system at 400 and 450°C.
Dashed lines were drawn to aid the eye.
Fig. 9. Logarithm of As(III) vapor–liquid partition coefficient (Km, Eqn. 1) as a function of the logarithm of
vapor-to-liquid density ratio. Symbols ⫽ experimental data points at temperatures and compositions indicated in the figure; solid curves ⫽ regression of the data at 250 to 350; 400; and 450°C, according to Eqn. 4 (see text).
dissociate in dilute basic solutions forming AsO(OH)2
⫺anion (Baes and Mesmer, 1976), the Km values can be directly
compared with the percentages of the neutral complex and its charged counterpart. To allow this comparison, solution pHs and As hydroxide species distribution were calculated at 350°C and Psat(Table A3, Fig. 7). In these calculations, the
dissoci-ation constants for H2O, HCl, and NaOH were used from
Sweeton et al. (1974), Tagirov et al. (1997), and Shock et al. (1997), respectively. The ionization constant for the reaction As(OH)3 ⫽ AsO(OH)2
⫺ ⫹ H⫹
was predicted at 350°C by using Helgeson-Kirkham-Flowers (HKF) equation-of-state pa-rameters on the bases of potentiometric measurements from 20 to 200°C of Pokrovski (1996) (Table 4). This value (pK350°C⫽
9.3 ⫾ 0.3) is in good agreement with predictions of Smith et al. (1986) and Shock et al. (1997) (pK350°C⫽ 9.0 and 9.2,
respec-tively). It can be seen in Fig. 7 that the measured Kmvalues
(symbols) decrease at pH above ⬃9. This decrease closely follows the percentage of the neutral As(OH)3species in
solu-tion (solid curve) predicted as a funcsolu-tion of pH. This demon-strates again that the neutral As(OH)3 complex forms in the
vapor phase, and the charged complexes do not significantly contribute to As volatility. This is in agreement with the low dielectric constant of the vapor, which favors ion association and neutral complex stabilities (Pitzer and Pabalan, 1986; Brimhall and Crerar, 1987; Dandurand and Schott, 1992). Sim-ilar dependence on solution pH has been also found for the vapor–liquid partitioning of silicic and boric acids (Styrikovich et al., 1959; Martynova, 1964).
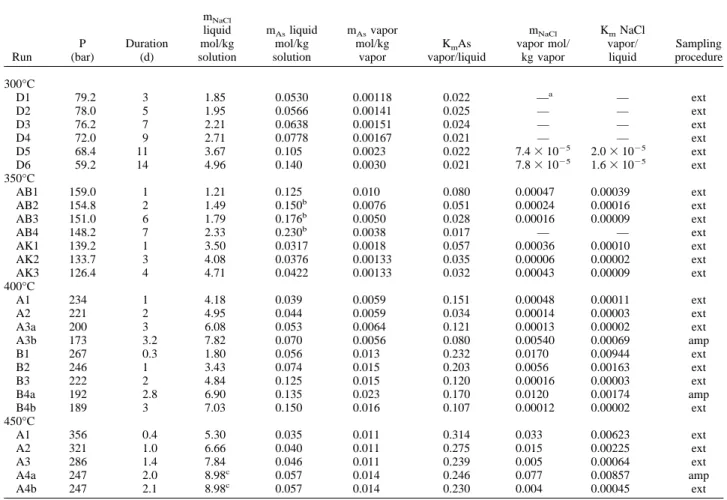
3.2.3. H2O-NaCl
Measurements of As(III) vapor–liquid partitioning at tem-peratures from 300 to 450°C and Psatin the system H2
O-NaCl-As2O3are reported in Table A4 of the Appendix. In Fig. 8, Km
values for As(III) in the presence of NaCl are plotted as a function of NaCl liquid-phase concentration. It can be seen in this figure that at 300 and 350°C, these values decrease with increasing NaCl solution content to the saturation with the solid salt, by a factor of 3 to 5 in comparison to pure water. At temperatures above the H2O critical point (400 and 450°C), this
decrease is slightly greater, by a factor of 5 to 10, in compar-ison to the theoretical Km ⫽ 1 at the critical point of the
H2O-NaCl isotherms at corresponding temperature. Arsenic
vapor–liquid distribution in the H2O-NaCl system can be
de-scribed by reaction 2, as supported by the XAFS spectroscopy (section 3.1) and vapor–liquid partitioning in pure water (sec-tion 3.2.1). The decrease of As solubility in the vapor phase can
be explained by salting-in effects for the aqueous As(OH)3,
which arise from its interactions with NaCl in the liquid. Quantitative treatment of the activity coefficients for the neutral As(OH)3species in high-temperature H2O-NaCl solutions,
us-ing, for example, the Setche´now (1892) equation as a function of ionic strength (e.g., Walther, 1997), or the Born (1920) electrostatic approach that is based on the dielectric constant of the solvent (e.g., Walther and Schott, 1988; Dandurand and Schott, 1992), is, however, difficult because of the large uncer-tainties associated with the estimation of both ionic strengths and solvent dielectric constants for H2O-NaCl solutions at
temperatures above 350°C and pressures below 300 bar. A more convenient and universal way to express vapor– liquid distribution is to apply a density approach initially pro-posed by Styrikovich et al. (1955), Styrikovich et al., (1960) for solutes weakly soluble in the steam below the critical point of water:
Km⫽(dvap/dliq) n
, (4)
where dvap and dliq are the densities of the vapor and liquid
phases, respectively, and n is an empirical number character-istic of the solute. In a logarithmic plot, vapor–liquid distribu-tion coefficients should thus be linearly dependent of the vapor-to-liquid density ratio and come to the critical point of the solvent where the vapor and liquid densities are the same and Km⫽ 1. It has been demonstrated that this simple model was
valid for a number of salts, weakly volatile compounds (boric and silicic acids) (Styrikovich et al., 1960; Smith et al., 1987), and gases (Ellis and Fyfe, 1957) over about 200°C below the critical point of water. It can be seen in Figure 9 that a plot of log Km, measured in this study both in pure water and H2
O-NaCl solutions, vs. log(dvap/dliq) at temperatures below the
critical point of water, gives a straight line for a wide range of densities, with a slope n ⫽ 1.19 ⫾ 0.03, which is consistent with Eqn. 4. At 400 and 450°C, distinct relationships are observed for H2O-NaCl solutions, with slopes of 0.95 ⫾ 0.04
and 0.69 ⫾ 0.03, respectively. For consistency with Eqn. 4, the regressions shown in Figure 9 were performed by fixing log Km
and log (dvap/dliq) to zero at the critical points of water and
H2O-NaCl solutions. The value of n obtained for As(OH)3in
this study below the water critical point (n ⬃ 1.2) is close to that derived from natural vapor–liquid partitioning of arsenic at the Geysers Geothermal Field (n ⬃ 1.6 to 1.7; Smith et al., 1987). Analogous neutral hydroxide species, such as boric and silicic acids, were found to exhibit a similar range of n values (0.9 for B(OH)3and 1.9 for Si(OH)4; Styrikovich et al., 1960).
Table 3. Average As(III) concentrations in water-free vapor phase in equilibrium with crystalline or molten As2O3and the corresponding partial
pressures of As4O6(ideal gas).
T (°C) CAsvapor (mol cm
⫺3) log(bar units ⫾ 1)10P (As4O6, gas) Equilibrium phase No. of runs
130 1.14 ⫻ 10⫺9 ⫺5.02 ⫾ 0.10 Arsenolite 2 220 1.70 ⫻ 10⫺7 ⫺2.76 ⫾ 0.20 Arsenolite —a 250 1.06 ⫻ 10⫺6 ⫺1.94 ⫾ 0.15 Arsenolite 4 265 3.46 ⫻ 10⫺6 ⫺1.41 ⫾ 0.11 Arsenolite 1 300 5.79 ⫻ 10⫺6 ⫺1.16 ⫾ 0.10 Arsenolite ⫾ As 2O3melt 2 350 1.07 ⫻ 10⫺5 ⫺0.86 ⫾ 0.10 As2O3melt 2 aExtrapolated to zero water pressure from runs 20 and 4c at 220°C (see Table A7 of the Appendix).
Note that the values of n derived in this study for As(OH)3
decrease with increasing temperature above the critical point of water. This reflects the increasing affinity of As(OH)3for the
vapor phase at higher temperatures for same vapor-to-liquid density ratios. Thus, it can be expected that at temperatures higher than ⬃450°C, arsenic would be enriched in the vapor phase in comparison to the corresponding dense H2O-NaCl
brine and thus exhibit values of Kmⱖ1 and n ⱕ 0, typical of
the liquid-vapor distribution behavior of gases (Ellis and Fyfe, 1957; Smith et al., 1987). It is, however, difficult to make quantitative predictions of As partition using this density ap-proach at temperatures above 500°C because of the small set of data and the absence of a rigorous physical-chemical basis for the extrapolation of the values of n to higher temperatures. Consequently, for practical purposes, and to allow a direct comparison with natural data (see below), we adopted an em-pirical equation describing As(III) vapor–liquid partition in the system H2O-NaCl as function of temperature and NaCl
con-centration:
log Km(As) ⫽ ⫺0.0050 t° log mNaCl⫹1.385 log mNaCl
(5)
⫹0.012 t° ⫺ 5.265,
where Kmstands for vapor–liquid partition coefficient for As
(Eqn. 1), mNaCl denotes NaCl liquid-phase concentration (in
mol/kg of solution), and t° is temperature (°C). Eqn. 5 repro-duces the Km(As) values measured in this study at mNaClⱖ1 m
from 300 to 450°C in the limit of ⫾0.1 log Km. A regular
dependence of log Kmon temperature and NaCl concentration
(Fig. 14) permits the use of this equation for extrapolation purposes at temperatures to at least 600°C with a confidence of about ⫾0.3 log units.
3.3. As2O3Vapor-Phase Solubility
Raw data on As2O3 vapor-phase solubility measurements
with and without H2O(gas) conducted by use of the ampoule
and quenching techniques are reported, respectively, in Tables A6 and A7 of the Appendix. As it can be seen in Table A6, both in the water-free system and in the presence of water, steady-state As vapor-phase concentrations were attained after ⬃2 d at 250°C and 350°C. Although no kinetic tests were conducted at other temperatures, a duration of 15 and 10 d, respectively, for the experiments at 130°C and 220, 265, and 300°C was con-sidered to be enough to attain a steady state. A rapid attainment of equilibrium (within ⬃1 h) between the vapor-phase and arsenolite in a dry system even at temperatures as low as 100°C has been demonstrated by previous works (Behrens and Rosen-blatt, 1972, and references therein). Following these studies, and the satisfactory reproducibility of our measurements at similar pressures but different duration or in different experi-ments (Tables A6 and A7), As contents measured in the vapor phase at all temperatures were assumed to be in equilibrium with the solid (or molten) phase. The results obtained in the dry system and in the presence of H2O are discussed below.
3.3.1. Water-free system
Average As(III) concentrations in the water-free vapor phase in equilibrium with arsenolite or molten As2O3are reported in
Table 3. The solid phase after experiments at temperatures from 130 to 250°C remained unchanged, always corresponding to arsenolite. At 350°C, only amorphous As2O3 was detected,
indicating that all solid melted completely in these experiments. At 300°C and 265°C, arsenolite remained the dominant phase but exhibited traces of partial melting. As has been shown by previous spectroscopic (Ban and Knox, 1970; Beattie et al., 1970; Brumbach and Rosenblatt, 1972) and pressure or vapor-ization-rate measurements (Jungermann and Plieth, 1967; Behrens and Rosenblatt, 1972), the vapor in equilibrium with arsenic trioxide consists of As4O6 molecules up to at least
800°C. Assuming an ideal behavior of As4O6 in the vapor
phase (Behrens and Rosenblatt, 1972), partial pressures of As4O6(gas) in equilibrium with solid or molten As2O3can be
calculated from the vapor As concentrations measured in this study:
PAs4O6⫽0.25 CAsRT, (6)
where CAs is the total As concentration in the vapor (mol
cm⫺3), 0.25 is the conversion coefficient between As and As4O6molal concentrations, R is the ideal gas constant (R ⫽
83.143 bar cm3
mol⫺1K⫺1), T is temperature (K), and P is As4O6pressure (bar). The values of log10(PAs4O6) derived in
this study by Eqn. 6 are reported in Table 3 and compared with the data reported in the literature in Figure 10. Despite the small number of experiments performed in a dry system in the present study, our As4O6pressures are in good agreement (in
the limit of ⫾0.1 log P) with the many data reported in the literature that were obtained from direct PAs4O6measurements
in equilibrium with arsenolite up to 300°C. The pressure of As4O6above molten As2O3derived in our study at 350°C is
also in reasonable agreement with the corresponding value reported by Rushton and Daniels (1926) from direct measure-ments. At 300 and 265°C, As4O6vapor pressures of the present
study are close to those obtained by extrapolation of the Rush-ton and Daniels (1926) curve for molten As2O3 to lower
temperatures. Because the melting temperature of arsenolite is
⬃275°C, the As4O6 pressures at 265 and 300°C from the
present study can be explained by the presence of a melt in our experiments (Rushton and Daniels, 1926; Schulman and Schumb, 1943), which is also in agreement with our observa-tions of the solid phases after the runs (see above).
3.3.2. As2O3-H2O
Arsenic (III) vapor-phase concentrations measured in the presence of H2O(gas) are plotted in Figure 11 as a function of
water vapor pressure. The solid phase after experiments below 265°C was dominated by arsenolite as showed X-ray diffrac-tion and Raman spectroscopy. However, optical observadiffrac-tions and weight-loss controls demonstrated the presence of an amor-phous hydrated As2O3 phase (⬍ ⬃10 to 50 wt% of the total
solid) whose quantity generally increased with increasing tem-perature. At 300°C, this amorphous phase dominated in the solid products after experiments. Because of its important amounts, the formation of such a phase cannot be explained by the condensation of vapor-dissolved arsenic trioxide during quenching, which could represent no more than 5 wt% of the total solid. Although claudetite (monoclinic As2O3) is
to 300°C, thus having lower vapor pressures than arsenolite (Fig. 10; Rushton and Daniels, 1926; Schulman and Schumb, 1943), this phase was never detected after our experiments. Nevertheless, initial stages of the arsenolite-to-claudetite trans-formation in the presence of water cannot be excluded in our experiments. Indeed, previous studies have demonstrated clau-detite formation from arsenolite between 150 and 300°C in the presence of water (Schulman and Schumb, 1943; Chang and Bestul, 1971; Pokrovski et al., 1996). It should be noted that the arsenolite-to-claudetite solid-phase transition requires impor-tant structural rearrangements, which consist in a complete breakage of the arsenolite cubic structure composed of As4O6
molecules, followed by the formation of two-dimensional net-works composed of As-O-As-O chains, typical of claudetite structure (Chang and Bestul, 1971). Because of such significant structural changes, this transformation should pass through an intermediate glassy state (Rushton and Daniels, 1926; Chang and Bestul, 1971). Such a metastable phase is likely to be observed in our experiments below and at 300°C in the pres-ence of water.
It can be seen in Figure 11 that at low H2O pressures, As
vapor solubilities measured at 130 and 265°C decrease by ⬃1.5 to 2 times in comparison to the water-free system. If As speciation in the vapor is dominated by the anhydrous As4O6
species (section 3.3.1) and the equilibrium solid phase re-mained unchanged, As vapor-phase solubility would be inpendent of water pressure. Consequently, the observed de-crease is most likely due to the formation of an intermediate glassy or claudetite-like phase, whose volatility is lower than that of arsenolite. At higher water pressures, As concentrations in the vapor remain about the same at 250 and 265°C, but increase at 220°C (Fig. 11). This can be interpreted by the formation in the vapor of hydrated As species whose concen-tration compensates the decrease of As4O6 vapor content
(⬃partial pressure) due to the phase transformation. Following the results on vapor–liquid partition for concentrated solutions (section 3.2.1), it is suggested that As(OH)3 could form in
significant amounts at H2O pressures close to the saturation. At
300°C, the possible solubility increase due to hydration is likely to be completely masked by arsenolite melting (see above).
Fig. 10. Logarithm of the pressure of As4O6(gas) in a water-free system in equilibrium with cubic (arsenolite),
monoclinic (claudetite), or molten arsenic trioxide (As2O3) as a function of reciprocal temperature. The symbols and curves
stand for experimental data derived from this study and are taken from the references indicated in the figure: B&R, Behrens and Rosenblatt (1972); J&P, Jungermann and Plieth (1967); K&S, Karutz and Stranski (1957); K&T, Kazenas and Tsvetkov (1997); R&D, Rushton and Daniels (1926); S&S, Schulman and Schumb (1943).
At 350°C, no arsenolite was detected after experiment, and the As2O3glass contained significant amounts of water (⬃5 to
10 wt%), as inferred from weight-loss control. Moreover, H2O
pressure monitored in the 350°C experiments was found to be lower than that calculated from the quantity of water loaded in the reactor before experiment. This difference can be explained by the dissolution of H2O(gas) in the molten As2O3, and was
found to attain 10 wt% (⬃0.9 in mole fraction) in experiments carried out at water pressures higher than 100 bar. It can be seen in Figure 11 that As vapor-phase solubility clearly in-creases with increasing pressure at PH2O ⱖ ⬃40 bar. The
Pointing correction (which accounts for the increase in the fugacity of the molten As2O3at pressures higher than the vapor
pressure of the melt itself; Sandler, 1985) was found to not exceed 15% of the total vapor solubility at the highest pressure measured (150 bar). As a result, this solubility increase clearly demonstrates the formation, in the 350°C experiments, of hy-drolyzed/hydrated arsenic species other than As4O6. The exact
quantification of species stoichiometry and stability from these experiments is, however, impossible because of the expected continued changes in the melt properties due to H2O
dissolu-tion with increasing H2O pressure. A very rough estimation of
the hydrated species contribution to the solubility at 350°C could be performed assuming an ideal H2O-As2O3solution in
the melt (As4O6 mole fraction ⬃0.1 to 0.2 at P ⬎ 100 bar),
which implies that at the highest pressure investigated (150 bar), As hydrolyzed species should account for ⬃90% of the
total As in the vapor phase. These crude estimations are, nevertheless, in reasonable agreement with the stability of As(OH)3(gas) species derived below.
4. CHARACTERIZATION OF THE THERMODYNAMIC PROPERTIES OF GASEOUS ARSENIC
OXY-HYDROXIDE SPECIES
4.1. Conventions, Units, and Standard States
The Gibbs free energies (and enthalpies) of minerals, gases, and aqueous species are represented in this study as apparent standard molal Gibbs free energies (⌬G°P,T) (and enthalpies, ⌬H°P,T) of formation from the elements at the subscripted
pressure (P) and temperature (T) (Shock et al., 1997):
⌬G°P,T⫽ ⌬fG° ⫹ 共G⬚P,T⫺G⬚Pr,Tr兲, (7)
where ⌬fG° is the standard molal Gibbs free energy of
forma-tion of the species from its elements in their stable state at the reference pressure (Pr⫽ 1 bar) and temperature (Tr⫽ 298.15
K), and (G°P,T⫺ G°Pr,Tr) refer to differences in the standard
molal Gibbs free energy of the species that arise from changes in pressure (P-Pr) and temperature (T-Tr). The reference states
for the elements (for which ⌬G°1,298(and ⌬H°1,298) ⫽ 0) in the
system As-O-H are native arsenic (As, rhombohedral); O2,
ideal gas; and H2, ideal gas. The standard states for the solid
phases and H2O are unit activity for the pure phase at all
temperatures and pressures. The standard state for gaseous species is characterized by unit fugacity of the ideal gas at 1 bar and any temperature. For aqueous species, the reference state convention corresponds to unit activity coefficient for a hypo-thetical one molal solution whose behavior is ideal. At low to moderate solution ionic strengths (ⱕ ⬃0.1), activity coeffi-cients of neutral aqueous species were assumed to be unity, but those of charged species were calculated by the extended Debye-Hu¨ckel equation (Garrels and Christ, 1965).
4.2. Henry Constants for As(OH)3and AsO(OH)3Vapor– Liquid Equilibria
The data on vapor–liquid partitioning in pure water at Psatfor
As(OH)3 at 250, 300, and 350°C allow determination of the
thermodynamic properties of As(OH)3(gas) by using the
cor-responding properties of As(OH)3(aq) and the conventional
Henry constant (Kh, Naumov et al., 1974) for vapor–liquid
equilibrium for reaction 2:
Kh⫽fAs(OH)3共gas兲/aAs(OH)3共aq兲, (8)
where f and a stand, respectively, for the vapor-phase fugacity and aqueous-phase activity of the subscripted species. Accord-ing to the convention (section 4.1), the activity of As(OH)3(aq)
in pure water can be replaced by its corresponding molality. Following the low As vapor-phase concentrations, and assum-ing the absence of significant As(OH)3-H2O interactions in the
low-density vapor phase in our experiments (ⱕ0.1 g cm⫺3), As(OH)3(gas) fugacity can be approximated by its partial
pres-sure defined as
fAs(OH)3(gas)⬇ PAs(OH)3(gas)⫽PtotXAs, (9)
where Ptotis the total pressure in the system (⬇PH2O), and XAs
Fig. 11. Arsenic vapor-phase concentrations (expressed in mol As/mL of vapor, in log10units), as a function of water vapor pressure,
in equilibrium with arsenic trioxide. Symbols ⫽ data measured in this study at stated temperatures; arrows ⫽ saturated pressure of pure water at each indicated temperature; horizontal dashed lines ⫽ concentration of As4O6(gas) species measured in this study in a dry system in
equilibrium with arsenolite (130 to 300°C) or molten As2O3(350°C),