HAL Id: hal-00304641
https://hal.archives-ouvertes.fr/hal-00304641
Submitted on 1 Jan 2001HAL is a multi-disciplinary open access archive for the deposit and dissemination of sci-entific research documents, whether they are pub-lished or not. The documents may come from teaching and research institutions in France or abroad, or from public or private research centers.
L’archive ouverte pluridisciplinaire HAL, est destinée au dépôt et à la diffusion de documents scientifiques de niveau recherche, publiés ou non, émanant des établissements d’enseignement et de recherche français ou étrangers, des laboratoires publics ou privés.
quantity data for the Strymon River in Greece
V. Z. Antonopoulos, D. M. Papamichail, K. A. Mitsiou
To cite this version:
V. Z. Antonopoulos, D. M. Papamichail, K. A. Mitsiou. Statistical and trend analysis of water quality and quantity data for the Strymon River in Greece. Hydrology and Earth System Sciences Discussions, European Geosciences Union, 2001, 5 (4), pp.679-692. �hal-00304641�
Statistical and trend analysis of water quality and quantity data for
the Strymon River in Greece
Vassilis Z. Antonopoulos, Dimitris M. Papamichail and Konstantina A. Mitsiou
Depart. of Hydraulics, Soil Science and Agricultural Engineering, School of Agriculture, Aristotle University of Thessaloniki, 54006 Thessaloniki, Greece. Email for corresponding author: [email protected]
Abstract
Strymon is a transboundary river of Greece, Bulgaria and Former Yugoslav Republic of Macedonia (FYROM) in southeastern Europe. Water quality parameters and the discharge have been monitored each month just 10 km downstream of the river’s entry into Greece. The data of nine water quality variables (T, ECw, DO, SO42-, Na++K+, Mg2+, Ca2+, NO
3-, TP) and the discharge for the period 1980-1997 were selected for
this analysis. In this paper a) the time series of monthly values of water quality parameters and the discharge were analysed using statistical methods, b) the existence of trends and the evaluation of the best fitted models were performed and c) the relationships between concentration and loads of constituents both with the discharge were also examined. Boxplots for summarising the distribution of a data set were used. The χ2-test and the Kolmogorov-Smirnov test were used to select the theoretical distribution which best fitted the data. Simple regression was
used to examine the concentration-discharge and the load-discharge relationships. According to the correlation coefficient (r) values the relation between concentrations and discharge is weak (r< 0.592) while the relation between loads and discharge is very strong (r>0.902). Trends were detected using the nonparametric Spearman’s criterion upon the data for the variables: Q, ECw, DO, SO42-, Na++K+ and NO
3- on
which temporal trend analysis was performed.
Key words: Strymon river, water quality, discharge, concentration, load, statistics, trends
Introduction
The water quality of water resources is a subject of ongoing concern. The assessment of long-term water quality changes is also a challenging problem. During the last decades, there has been an increasing demand for monitoring water quality of many rivers by regular measurements of various water quality variables. The result has been the gradual accumulation of reliable long-term water quality records and the examination of these data for long-term trends (Hirsch et al., 1991). According to Liebetrau (1979), some of the necessities of water quality monitoring are the following: 1) to provide a system-wide synopsis of water quality, 2) to monitor long-range trends in selected water quality parameters, 3) to detect actual or potential water quality problems; if such problems exist 3a) to determine specific causes and 3b) to assess the effect of any convective action and 4) to enforce standards.
Computer systems now offer the possibility of handling and manipulating very large databases in ways which were not previously a practical option. Littlewood et al. (1998) have used such databases for estimation of UK river mass loads of pollutants. Miller and Hirst (1998) used the hydrochemical databases from an upland catchment in Scotland for a period of five years to assess the annual variation in amounts and concentration of solutes and to examine the variation in streamwater quality due to changes in flow, season and long time trend. Ferrier et al. (2001) analysed in detail databases for Scotland and identified temporal changes in water quality over the last 20 years.
The Strymon River is one of the most important rivers in the Greek and Balkan area, with an extensive basin of 17,330 km2. The water quality and the discharge entering Greece is
affected by many different anthropogenic factors and processes taking place in that part of the river catchment
occupied by Bulgaria and FYROM. Monthly measurements of the discharge and the water quality variables have been monitored at the Sidirokastro Bridge station of the Strymon River by the Greek Ministry of Agriculture. The Sidirokastro Bridge station is 10 km downstream of the Greek–Bulgarian border and upstream of Kerkini Lake, which is one of the significant wetlands in the area of Balkans.
This paper examines statistically: (1) the time series of monthly values of water quality parameters and the discharge at Sidirokastro station, (2) the existence of trends and the evaluation of the best fitted trend models, and (3) the relationships between concentration and loads of solutes and the discharge.
Methodology for the analysis of water
quality parameters
In planning control and management programme of streams, the statistical and trend analysis as well as the relations between concentrations or loads and discharge are important steps for understanding the behaviour and the variation of water quality parameters and streamflow. This variation is affected by many factors. These factors may be formed by the different substances in the surface water due to activities in the catchment and may be further obscured by random events. Furthermore, the streamflow data exhibit hydrological persistence and seasonal variance (Antonopoulos and Papamichail, 1991).
PROBABILITY DISTRIBUTION OF WATER QUALITY PARAMETERS
Water quality data do not usually follow convenient probability distributions such as the well-known normal and lognormal distributions on which many classical statistical methods are based (Lettenmaier et al., 1991).
Probability plots are used to determine how well data fit a theoretical distribution. This could be achieved by comparing visually histograms of measured values to the density curve of theoretical distributions.
To select the distribution which provided the best fit, ten theoretical probability distribution functions were examined: Chi-square (χ2), Erlang (Er), Exponential (Ex), F, Gamma
(G), Logistic (L), Lognormal (LN), Normal (N), Triangular (Tr) and Weibull (W). To select the distribution which fitted the data best, the χ2-test and the Kolmogorov-Smirnov test
(K-S) were used.
The χ2 test compares the measured and the predicted
frequencies and it is described by the formula (Haan, 1977) (1)
where oi and ei are the measured and predicted frequencies respectively and k is the number of class intervals. The null hypothesis H0 is that the data follow a theoretical distribution. H0 should be rejected if the statistic χ2 exceeds
the (1-α) quantile of a chi-square distribution having (k-1) degrees of freedom.
The K-S test is a non-parametric test (Haan, 1977) of the fitting of data to a theoretical distribution using the maximum absolute deviation (D) between the two functions of cumulative distribution. It is calculated by
D = max Fn(x) - Fo(x) (2)
where Fn(x) is the cumulative density function based on n measurements, Fo(x) is the specified theoretical cumulative distribution function under the null hypothesis H0. The values of D(n,α) are given in tables (Haan, 1977). If D≥D(n,α), the H0 hypothesis is rejected and if D<D(n,α),
H0 is accepted, for the chosen level of significance α=0.05. SOLUTE CONCENTRATIONS-DISCHARGE AND LOADS-DISCHARGE RELATIONSHIPS
The concentrations of solutes in water in a stream vary during time. A major source of this variation is the stream discharge (Edwards, 1973; Pinol et al., 1992). A strong relationship between streamwater chemistry and discharge at different spatial and temporal scales has been identified for rivers and streams (Larsen et al., 1999).
The load (or flux) of water solutes (the product of discharge and concentration) is an important variable of water quality if interest focuses upon storage of the water and its constituents. The load of relatively conservative constituents may be important where the monitoring station is upstream of a reservoir, lake or estuary where the water has a long residence time and the exposure to chemicals by aquatic organisms or populations that ingest the water is of concern (Hirsch et al., 1991).
Different models were proposed to describe the relationship between concentration-discharge and load-discharge (Edwards, 1973; Oborne et al., 1980; Pinol et al., 1992). These relationships give information on the variation of quality parameters due to discharge. Hirsch et al. (1982) suggested that, for water quality variables that are highly dependent on stream flow, the confounding effects of discharge variations be removed by analysing the residuals from a discharge-concentration relationship for trend, rather than the raw data. For this analysis, the linear (Cij=a+bQj), the power (Cij=aQjb), the exponential (C
ij=a exp(bQj)), and
the logarithmic (Cij=a+b ln(Qj)) models were used. The method of least squares for the pairs of monthly measured
χ2 (o e ) e i i i i k 2 1 = − = ∑
values of each variable and the discharge was used to determine the constants of these models.
TREND ANALYSIS
Testing water quality data for trend over a period of time has received considerable attention recently. The interest in methods of water quality trend arises for two reasons.The first is the intrinsic interest in the question of changing water quality arising out of the environmental concern and activity. The second reason is that only recently has there been a substantial amount of data that is amenable to such an analysis.
Trend analysis determines whether the measured values of a water quality variable increase or decrease during a time period. In statistical terms, has the probability distribution from which they arise changed over time? It would be useful to describe the amount or rate of that change, in terms of changes in some central value of the distribution such as mean or median (Hirsch et al., 1982; Hirsch and Slack, 1984).
Hirsch et al. (1982) suggested an adaptation of the Kendall non-parametric test to detect trends in seasonally varying water quality time series; this is often referred to as the seasonal Kendall’s test. This test can accommodate time series with missing data. In this study, to detect the existence of trends in the time series of the variables involved, the nonparametric Spearman’s criterion was used and different trend models were fitted (Dahmen and Hall, 1990). The Spearman rank-correlation coefficient is described as:
(3) where n is the total number of values in each time series, D is the difference and i is the chronological order number. The difference between rankings is computed as Di = Kxi -Kyi, where: Kxi is the rank of a measured variable in chronological order and Kyi is the series of measurements transformed to its rank equivalent, by assigning the chronological order number of a measurement in the original series to the corresponding order number in the ranked series, y. The null hypothesis, H0:Rsp = 0 (there is no trend), against the alternate hypothesis, H1:Rsp < or > 0 (there is a trend), is checked with the test statistic:
(4) where tt has Student’s t-distribution, with ν=n-2 degrees of freedom. At a significant level of 5%, the time series has no
trend if:
t{ν, 2.5%} < tt < t{ν, 97.5%}, (5)
The trend analysis applied here was an attempt to fit the following linear, quadratic, exponential and mixed type models to the time series of the discharge and the water quality parameters:
T
F
=
α
+
β
⋅
(6) 2T
c
T
F
=
α
+
β
⋅
+
⋅
(7)(
T
)
exp
F
=
α
+
β
⋅
(8)(
T
)
exp
F
=
α
+
β
(9)The best-fitted model of time trend for each variable was chosen using the following statistical criteria of Mean Error (ME), Mean Square Error (MSE), Mean Absolute Error (MAE) and Mean Absolute Percent Error (MAPE) (Makridakis et al., 1986):
(10) (11) (12) (13) where Xi is the measured value at time i, Fi is the predicted value at the same time, ei=Xi-Fi and n is the number of measurements. The closer the average ME is to zero and the smaller the values of MSE, MAE and MAPE, the better the model fits the time-series (Statgraphics, 1987). DESCRIPTION OF STUDY SITE
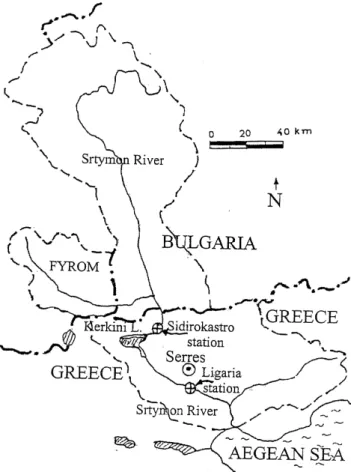
The Strymon River, is a transboundary river of Greece, Bulgaria and FYROM. Its length is about 392 km and after a distance of approximately 118 km in Greek territory it discharges into the Northern Aegean Sea (Fig. 1). The total area of the Strymon catchment is approximately 17,330 km2
of which 8,670 km2 (50%) are in Bulgaria, 2,365 km2
(13.6%) in FYROM and 6,295 km2 (36.4%) in Greece. The
mean elevation of the catchment is approximately 830 m while 77 km upstream of the mouth of the Strymon River a dam was constructed in 1932 forming Kerkini Lake, which is one of the 11 Ramsar sites in Greece. The initial volume of Kerkini Lake was 312×106 m3, which had reduced to
(
)
R D D n n sp i i i n = − − =∑
1 6 1 1 2 ( ) t R n R t sp sp = − − 2 1 2 0 5.∑
= = n 1 i i n e ME∑
= = n 1 i 2 i n e MSE∑
= = n 1 i i n e MAE(
)
∑
= − ⋅ = n 1 i i i i n 100 X F X MAPE170×106 m3 in 1977. In 1983 a new dam was constructed in
the same place. Now the maximum volume of lake rises to 600×106 m3. The main attributes of the lake are flood control,
irrigation, fisheries and biodiversity. The Strymon River carries high quantities of sediments and solutes into the lake, affecting the system values negatively.
The mean yearly precipitation in the area of Kerkini lake is 534 mm, with a distribution during the year which follows the two characteristic peaks of a Mediterranean climate. The mean yearly temperature is 15.4 oC, with July the warmest
month (26.7 oC) and January the coldest month (3.9 oC).
Upstream of Kerkini Lake and 10 km downstream of the Greek–Bulgarian border at Sidirokastro Bridge of the Strymon River there is a monitoring station, where the Greek Ministry of Agriculture measures water flow and takes water samples once every month. This station has been included in the European Community’s water quality monitoring programme since 1982 (E.C., 1994).
Among the variables measured by the Department of Irrigation and Water Protection of the Greek Ministry of Agriculture at the Sidirokastro Bridge station are water temperature (T), pH, specific conductivity (ECw), dissolved
oxygen (DO), bicarbonates (HCO3-), sulphates (SO 42-),
chlorides (Cl-), sodium and potassium (Na++K+), magnesium
(Mg2+), calcium (Ca2+), nitrate (NO
3-), ammonia (NH4+), total
phosphorus (TP) and discharge (Q). The monitoring data for these variables available for the analysis as presented in this paper is on a monthly basis for the period 1980–1997. Discharge is a parameter with many missing values, especially since 1989. It was impossible to complete the values for discharge since 1994 and for this reason, the relationship between discharge and the concentrations and loads were examined only for the period 1980 to 1993. Neither nitrate nor total phosphorus have been measured since 1993. The missing monthly values were completed using the methods proposed by Holder (1985).
Results and discussion
STATISTICAL ANALYSIS OF WATER QUALITY PARAMETERS AND DISCHARGE
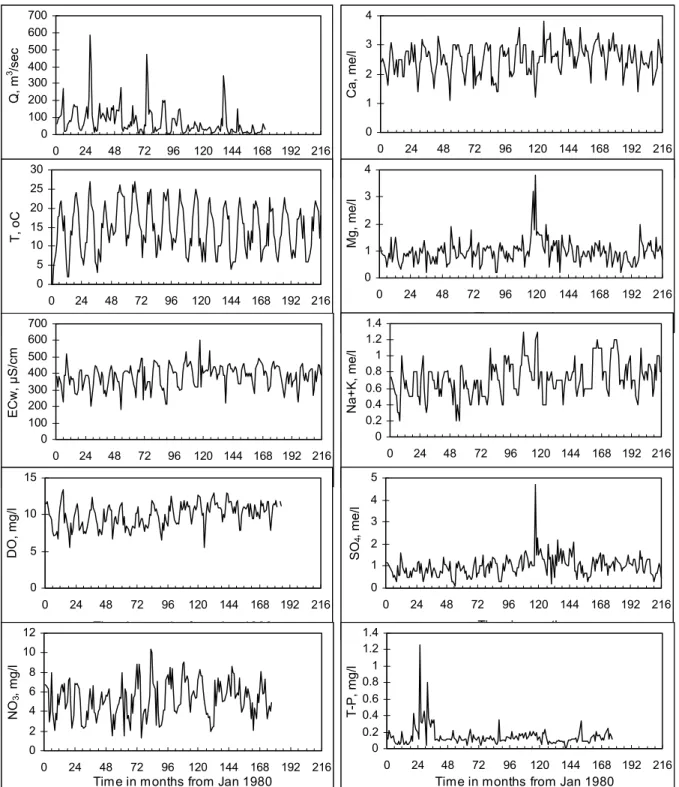
Figure 2 shows the time series of monthly measured values of Q, T, ECw, concentrations of DO, SO42-, Na++K+,
Mg2+ Ca2+, NO
3- and TP, at Sidirokastro station. The
statistical measures of time series of water quality variables at the Sidirokastro station, used in the following analysis, are given in Table 1. In Table 1, the statistical measures of pH, Cl-, HCO
3- and NH4+ parameters are also given. Many
water quality parameters show striking seasonal variations. For temperature and dissolved oxygen, seasonal variation is relatively uniform during the time. There is also a variation in concentrations and discharge. There are different reasons for these variations. Some of them depend on discharge and seasonality; the magnitudes of the fluctuations in discharge are much greater than those of concentrations. The ratio of highest to lowest concentration and water discharge is very large for discharge (214:1) followed by total phosphorus (63:1), sulphate (47:1), temperature (27:1), Mg2+ (19:1) and
NO3- (13.6:1). There is low ratio for Na++K+ (6.5:1), Ca2+
(3.5:1), ECw (3.3:1) and DO (2.4:1). The dominant anion and cation in the water of Strymon river is HCO3- and Ca2+,
respectively. The values of NO3- show anthropogenic
influence but it is five times less than those in the European rivers in which the medium level of NO3- is 20 mg l–1
(Maybeck et al., 1989). The mean value of phosphorus coincides with the critical value of 0.15 mg l–1which is
considered a minimum requirement for the avoidance of eutrofication effects on European rivers (van Dijk et al., 1994).
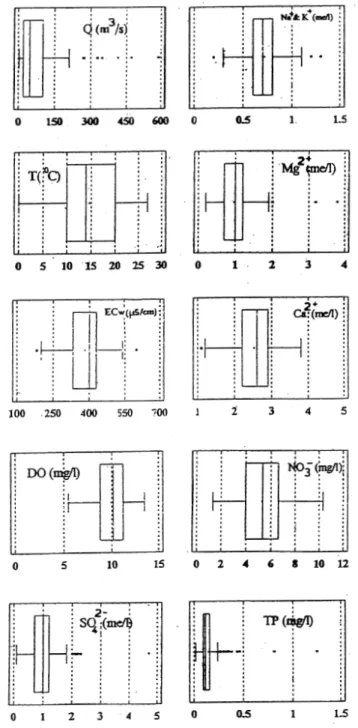
A very useful and concise graphical display for summarising the distribution of a data set is the boxplot (Helsel and Hirsch, 1992). Boxplots provide visual
Fig. 1. River Strymon, its catchment boundaries and Sidirokastro
summaries of (1) the centre of the data (the median = the centre line of the box), (2) the variation or spread (interquartile range=the box height), (3) the skewness (quartile skew=the relative size of box halves) and (4) presence or absence of unusual values (“outliers” and “extreme” values). Boxplots are even more useful in comparing these attributes between several data sets.
Figure 3 shows the boxplots of water quality parameters and discharge at Sidirokastro station (Mitsiou et al., 1999). The boxplots show that the data of the variables of Q, ECw, SO42-, Na++K+, Mg2+, Ca2+, and TP depart from a normal
distribution not only in skewness, but also by the number of outliers and the extreme values. The data of the variables DO and NO3- depart from a normal distribution only in the
Fig. 2. Time series of water quality parameters and discharge at Sidirokastro station of the Strymon River
0 100 200 300 400 500 600 700 0 24 48 72 96 120 144 168 192 216
Time in months from Jan/1980
Q, m 3 /sec 0 1 2 3 4 0 24 48 72 96 120 144 168 192 216 Ca, me/l 0 5 10 15 20 25 30 0 24 48 72 96 120 144 168 192 216 Time in months T, oC 0 1 2 3 4 0 24 48 72 96 120 144 168 192 216 Time in months Mg, me/l 0 100 200 300 400 500 600 700 0 24 48 72 96 120 144 168 192 216 Time in months ECw, μ S/cm 0 0.2 0.4 0.6 0.8 1 1.2 1.4 0 24 48 72 96 120 144 168 192 216 Time in months Na+K, me/l 0 5 10 15 0 24 48 72 96 120 144 168 192 216
Time in months from Jan 1980
DO, mg/l 0 1 2 3 4 5 0 24 48 72 96 120 144 168 192 216 Time in months SO 4 , me/l 0 2 4 6 8 10 12 0 24 48 72 96 120 144 168 192 216
Time in months from Jan 1980
NO 3 , mg/l 0 0.2 0.4 0.6 0.8 1 1.2 1.4 0 24 48 72 96 120 144 168 192 216
Time in months from Jan 1980
Table 1. Statistical parameters of the time series of monthly values of water quality parameters and discharge of
the Strymon River at Sidirokastro station.
Variable Sample Size
x
δ xmax xmin xmax- xmin s CVQ, m3sec–1 171 76.43 46.00 588.87 2.75 586.12 86.96 113.77 T, oC 216 14.65 14.00 27.00 0.00 27.00 6.14 41.87 ECw, µS cm–1 216 383.19 400.00 600.00 180.00 420.00 68.65 17.92 DO, mg l–1 182 9.95 10.16 13.44 5.5 7.94 1.61 16.17 SO42-, me l–1 216 0.99 1.00 4.70 0.10 4.60 0.46 46.73 Na+ + K+, me l–1 216 0.72 0.70 1.30 0.20 1.10 0.21 29.86 Mg2+, me l–1 216 0.97 1.00 3.80 0.20 3.60 0.43 44.79 Ca2+, me l–1 216 2.52 2.60 3.80 1.10 2.70 0.50 19.81 NO3-, mg l–1 177 5.25 5.28 10.34 0.76 9.58 1.88 35.81 TP, mg l–1 177 0.15 0.12 1.26 0.02 1.24 0.12 83.90 pH 215 7.79 7.85 8.5 6.9 1.6 0.37 4.75 Cl-, me l–1 215 0.25 0.2 0.8 0.1 0.7 0.15 60.00 HCO3-, me l–1 215 2.92 3.0 4.2 1.3 2.9 0.59 20.21 NH4+, mg l–1 110 0.113 0.086 0.56 0.025**
Notes on the table:
x
: mean, δ: median, xmax: maximum value, xmin: minimum value, s: standard deviation, CV: coefficient of variation, ** Lower detection limit.skewness. It is noted that only temperature is approaching normality. Figure 3 shows that there are many outliers and extreme values for the variables of Q, SO42-, Mg2+, and TP.
The extreme values of Q are due to floods, while the extreme values of other variables are unexpected and maybe due to non-suitable measurements or handling the water samples. The procedure used to fit a theoretical continuous distribution function to the data time series (a) provides the parameter estimates for the chosen distribution function, (b) calculates a chi-square statistic that allows comparison of
observed and expected frequencies, with its degrees of freedom (d.f.) at a chosen significant level of α=0.05, (c) runs a Kolmogorov-Smirnov one-sample test for goodness-of-fit with its maximum absolute deviation (D) and (d) plots a frequency histogram with the fitted distribution superimposed on it (Statgraphics, 1987). Table 2 includes the results of the aforementioned procedure for the water variables of the Strymon River. It has been accepted that the best fitted theoretical distribution to each data time series is the one which satisfies both tests (χ2-test and K-S test).
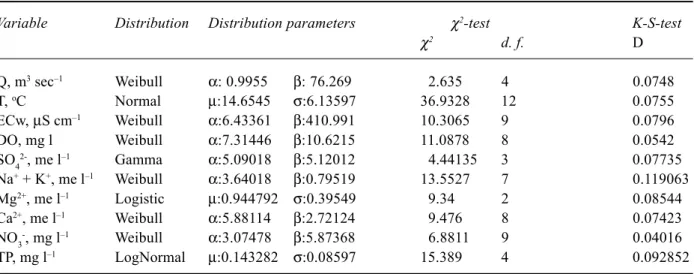
Table 2. The best-fitted distribution parameters and the values of the goodness-of-fit tests
Variable Distribution Distribution parameters χ2-test K-S-test
χ2 d. f. D Q, m3sec–1 Weibull α: 0.9955 β: 76.269 2.635 4 0.0748 T, oC Normal µ:14.6545 σ:6.13597 36.9328 12 0.0755 ECw, µS cm–1 Weibull α:6.43361 β:410.991 10.3065 9 0.0796 DO, mg l Weibull α:7.31446 β:10.6215 11.0878 8 0.0542 SO42-, me l–1 Gamma α:5.09018 β:5.12012 4.44135 3 0.07735 Na+ + K+, me l–1 Weibull α:3.64018 β:0.79519 13.5527 7 0.119063 Mg2+, me l–1 Logistic µ:0.944792 σ:0.39549 9.34 2 0.08544 Ca2+, me l–1 Weibull α:5.88114 β:2.72124 9.476 8 0.07423 NO3-, mg l–1 Weibull α:3.07478 β:5.87368 6.8811 9 0.04016 TP, mg l–1 LogNormal µ:0.143282 σ:0.08597 15.389 4 0.092852
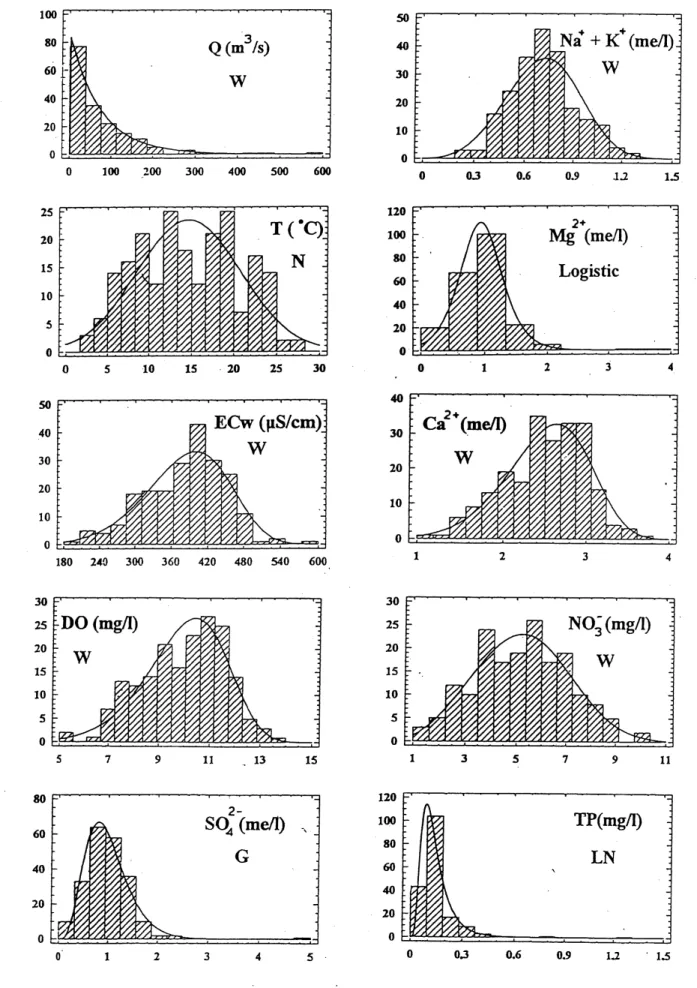
Figure 4 shows the frequency histograms of the data time series with the best fitted distributions.
After a thorough examination of the statistical tests’ parameter values the following conclusions about the distribution of each variable were reached: the Strymon’s discharge follows the Weibull distribution. The specific conductivity, the dissolved oxygen, the Ca2+ and the nitrate
also follow the Weibull distribution. The sulphates follow the Gamma distribution. Water temperature, Mg2+ and total
phosphorus approach none of the known theoretical
distributions according to both goodness-of-fit criteria. According to the K-S test only, water temperature approaches the normal distribution, Mg2+ the logistic and
total phosphorus the lognormal. According to the χ2-test
only Na++K+ follows the Weibull distribution.
CONCENTRATION- DISCHARGE AND LOAD-DISCHARGE RELATIONSHIPS
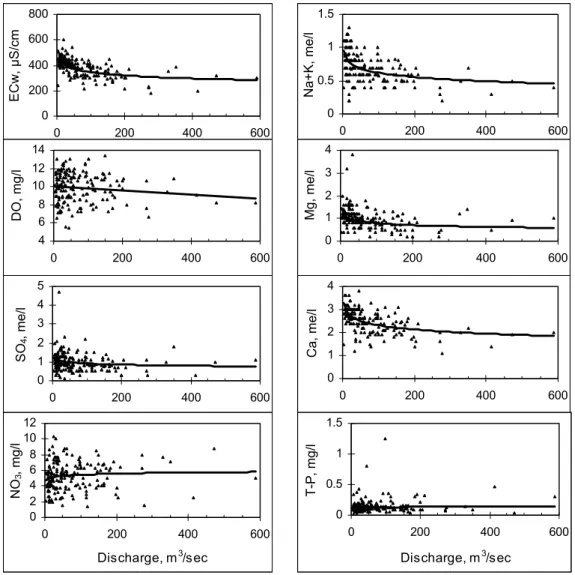
The results of simple regression applied between each water quality variable’s concentration (dependent variable) and the discharge (independent variable) as well as between each water quality variable’s load (dependent variable) and the discharge (independent variable), monitored at the Sidirokastro station of the Strymon River are given in Table 3. In this table the values parameters a and b of linear (Cij=a+bQj), power (Cij=aQjb), exponential (C
ij=a exp(bQj)),
and logarithmic (Cij=a+b ln(Qj)) models as well as the correlation coefficients are given. Figures 5 and 6 show the best-fitted to the data regression models. From the values of Table 3 and the graphs of Figs. 5 and 6 it is clear that: (a) no one of the applied models describes well the concentration-discharge relationships or these relationships are very weak, (b) the correlation coefficients are negative for most of the variables, except nitrates and total phosphorus, which show a decreasing relationship. This is a result (Edwards, 1973) of dilution effects of surface runoff, during periods of high runoff in the catchment, on the water of base runoff, (c) the logarithmic and the power models describe better the concentration-discharge relationships, and d) the relationship between conductivity (which express the total dissolved solids) and discharge, has got the better correlation coefficient value (r=–0.592), following by Calcium (r=–0.553) and then by the other cations Na++K+
(r=–0.466) and Mg2+ (r=–0.384), while dissolved oxygen,
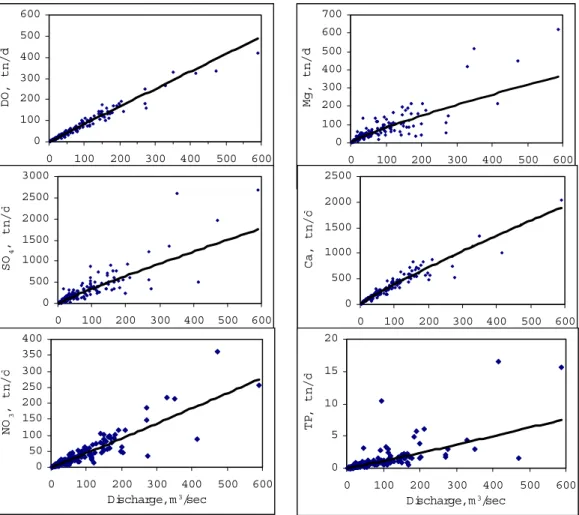
total phosphorus and nitrates show weaker relations. The load-discharge relationships show better correlation than that of concentration-discharge. The power model expresses better the load-discharge relationships. The correlation coefficients are very high: r = 0.903 and r = 0.981 for the cations Mg2+ and Ca2+, respectively and r = 0.941
and r = 0.902 for nitrates and total phosphorus, respectively. The slope coefficient b (Table 3) for nitrate and phosphorus discharge-load relationships are greater than 1.0. The concentrations of these constituents have a fairly good positive correlation with discharge (Edwards, 1973). The dilution effects of high discharges on concentration produces lower values for coefficient b. The smaller value of b is 0.83 for Mg2+, followed by 0.89 for Ca2+.
Discharge has strong seasonality with the higher values during the spring as a result of snow melting from the
Fig. 3. Boxplots of measured values of water quality parameters and
Fig. 5. Concentration of water quality parameters against discharge relationships with the curve of the best fitted model.
Table 3. Concentration-discharge and load-discharge relationships
Concentration-discharge Load-discharge
Variable Equation a b r Variable Equation a b r
ECw, µS Power 573.39 –0.1101 –0.592
DO, mg l–1 Linear 10.07 –0.0023 –0.123 DO, tn d–1 Power 0.8635 0.9936 0.987
SO42-, me l–1 Log 1.3267 –0.0883 –0.190 SO 42–,tn d–1 Power 5.0192 0.9173 0.895 Na++K+, me l–1 Log 1.0428 –0.0918 –0.466 Mg2+, me l–1 Power 1.6882 –0.1651 –0.384 Mg2+, tn d–1 Power 1.7732 0.8349 0.903 Ca2+, me l–1 Log 3.5294 –0.263 –0.553 Ca2+, tn d–1 Power 6.5012 0.8898 0.981 NO3–, mg l–1 Log 4.5466 0.1961 0.113 NO 3–, tn d–1 Power 0.3717 1.0354 0.941 TP, mg l–1 Power 0.0916 0.0746 0.144 TP, tn d–1 Power 0.0079 1.0746 0.902
mountainous area of the catchment. The seasonality in discharge and the inverse relationships with the solutes of Ca2+ and Mg2+, which have groundwater sources and
Na++K+, which have predominantly point sources, controls
the patterns of these solutes. TP and NO3 show no well-defined seasonal patterns with very highly scattered
0 200 400 600 800 0 200 400 600 Discharge, m3/sec ECw, μ S/cm 0 0.5 1 1.5 0 200 400 600 Discharge, m3/sec Na+K, me/l 4 6 8 10 12 14 0 200 400 600 Discharge, m3/sec DO, mg/l 0 1 2 3 4 0 200 400 600 Discharge, m3/sec Mg, me/l 0 1 2 3 4 5 0 200 400 600 Discharge, m3/sec SO 4 , me/l 0 1 2 3 4 0 200 400 600 Discharge, m3/sec Ca, me/l 0 2 4 6 8 10 12 0 200 400 600 Discharge, m3/sec NO 3 , mg/l 0 0.5 1 1.5 0 200 400 600 Discharge, m3/sec T-P , mg/l
relationships with the water discharge, indicating the existence of many different potential sources and availability of sources for transportation within the river system. TREND ANALYSIS OF WATER QUALITY
PARAMETERS
The time series of nine water quality parameters and the discharge of the Strymon River at the Sidirokastro station were tested for existence of trend, by using the nonparametric Spearman’s criterion and analysed by fitting different trend models. The value of Spearman’s rank-correlation coefficient (Eqn. 3), the Spearman statistical criterion (Eqn. 4) and the limits defined by Eqn. (5), which for n=216 (18 years*12 months), is: t{214,2.5%} < tt < t{214, 97.5%}, where: t{214,2.5%}= -1.96 and t{214,97.5%}=1.96, for the examined time series are given in Table 4. So, according to the results of Spearman’s test (Table 4), the values of the given series of observations of Q, ECw, DO, SO42+, Na+ + K+ and NO
3- changed over time
in a certain rate. In order to describe these changes an attempt
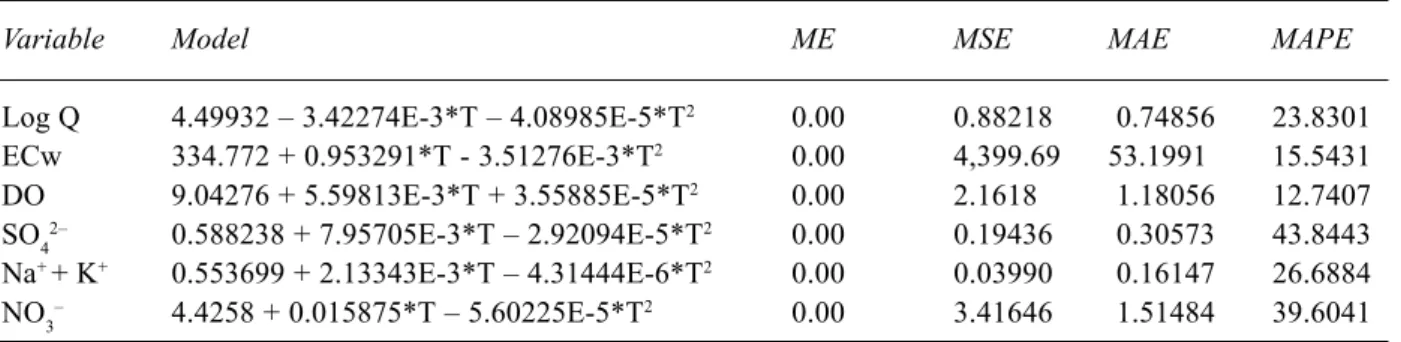
was made to fit one of the known trend models (Eqns. 6-9) to each data time series. The selection of the “best-fitted” model was based on the values of the statistical tests described by Eqns. 10-12 and are given in Table 5, while
Fig. 6. Load of water quality parameters against discharge relationships with the curve of the best fitted model. 0 100 200 300 400 500 600 0 100 200 300 400 500 600 Discharge, m 3/sec DO, tn/d 0 100 200 300 400 500 600 700 0 100 200 300 400 500 600 Discharge, m 3/sec Mg, tn/ d 0 500 1000 1500 2000 2500 3000 0 100 200 300 400 500 600 Discharge, m 3/sec SO 4 , tn/ d 0 500 1000 1500 2000 2500 0 100 200 300 400 500 600 Discharge, m 3/sec Ca, tn/ d 0 50 100 150 200 250 300 350 400 0 100 200 300 400 500 600 Discharge, m3/sec NO 3 , tn/ d 0 5 10 15 20 0 100 200 300 400 500 600 Discharge, m3/sec T P , tn/ d
Table 4. Detecting trend existence in Strymon’s water
quality variables
Variable Sidirokastro station Is there a
Rsp tt trend? Q, m3sec–1 –0.4940 –7.386 Yes ECw, µS cm–1 0.1885 2.808 Yes DO, mg l–1 0.4145 6.111 Yes SO42–, me l–1 0.2657 4.031 Yes Na+ + K+, me l–1 0.3324 5.156 Yes Mg2+, me l–1 0.1106 1.628 No Ca2+, me l–1 0.1311 1.935 No NO3-, mg l–1 0.1551 2.077 Yes TP, mg l–1 –0.0475 –0.629 No
their graphs, along with the observed values of the data time series, are shown in Fig. 7 (Mitsiou et al., 2000).
The conclusions deriving from the previous trend analysis are: (a) the second order equation (Eqn. 7) describes the trend of the data time series better, (b) the trend of discharge (Q) is downwards, while the trends of the water quality variables (ECw and concentration of DO, SO42-, Na++K+
and NO3-) are upwards, and c) the concentrations of Ca2+,
Mg2+ and TP have no trends.
The downward trend of discharge in relation to the relatively high inverse relationship with ECw and Na++K+
(Table 3) has affected the trend of these variables. The decrease in discharge causes increase in these variables, while the weak relationship of discharge with DO, SO42-,
NO3- and TP does not influence the trend of these variables.
The year 1989 was a very significant historical year in
Table 5. Trend models which describe better the trends of the Strymon’s water quality variables, with the values of
the statistical tests for the goodness-of-fit
Variable Model ME MSE MAE MAPE
Log Q 4.49932 – 3.42274E-3*T – 4.08985E-5*T2 0.00 0.88218 0.74856 23.8301
ECw 334.772 + 0.953291*T - 3.51276E-3*T2 0.00 4,399.69 53.1991 15.5431
DO 9.04276 + 5.59813E-3*T + 3.55885E-5*T2 0.00 2.1618 1.18056 12.7407
SO42– 0.588238 + 7.95705E-3*T – 2.92094E-5*T2 0.00 0.19436 0.30573 43.8443
Na+ + K+ 0.553699 + 2.13343E-3*T – 4.31444E-6*T2 0.00 0.03990 0.16147 26.6884
NO3– 4.4258 + 0.015875*T – 5.60225E-5*T2 0.00 3.41646 1.51484 39.6041
Fig. 7. Monthly measured values of water quality parameters and discharge and the curves of the best fitted trend model. 0 0.5 1 1.5 2 2.5 3 0 24 48 72 96 120 144 168 192 216 Time in months from Jan/1980
log(Q), m 3 /sec 0 0.2 0.4 0.6 0.8 1 1.2 1.4 0 24 48 72 96 120 144 168 192 216 Time in months Na+K, me/l 0 100 200 300 400 500 600 700 0 24 48 72 96 120 144 168 192 216 Time in months ECw, μ S/cm 0 1 2 3 4 5 0 24 48 72 96 120 144 168 192 216 Time in months SO 4 , me/l 0 5 10 15 0 24 48 72 96 120 144 168 192 216
Time in months from Jan 1980
DO, mg/l 0 2 4 6 8 10 12 0 24 48 72 96 120 144 168 192 216
Time in months from Jan 1980
NO
3
the countries of upstream boundaries of Greece. It was the year with very drastic changes in the political status of Bulgaria and FYROM. The transition from the socialist to the free market status influenced the development of these countries. It is very important to study the trends in the flow and water quality of the Strymon river entering Greece during these two special periods: before the political change and after it. The examination of time series for the period of 1980 to 1989 shows that, except discharge, all the other parameters presented an upward trend. The explanation, in relation to the political status, is that the countries were in a development stage and they were likely to use the water from the river and to produce solutes that pollute the river. During the last period (1990–1997) the upstream countries have been under a stagnation and retardation growth status by stopping or reversing productivity, especially during the first years of the decade. The time series during this period show a continuous decrease in discharge, ECw and NO3, while there is an increase in the DO, Na++K+ and SO
42-.
Conclusions
Data of water quality variables and discharge at the Sidirokastro station of the transboundary Strymon River in its Greek part were analysed using statistical methods and trend analysis. The time series of monthly measured values of six water quality variables (ECw, T, SO42-, Na++K+, Mg2+
and Ca2+) over 18 years (1980–1997), and the discharge
(Q), DO, NO3- and TP over 14 years (1980–1993) are used
for this analysis.
The statistical analysis of aforementioned variables resulted that according to the K-S and χ2 tests, discharge,
specific conductivity, dissolved oxygen, Ca2+ and the nitrate
follow the Weibull distribution, while sulphates follow the Gamma distribution. According to the K-S test only, water temperature approaches the normal distribution, Mg2+ the
logistic and total phosphorus the Lognormal, while Na++K+
follows the Weibull distribution according to the χ2-test only.
Seasonal variations in stream water chemistry are strongly related to discharge variations. However, the solute concentrations were related weakly with the discharge although the solute loads were related very strongly with the discharge.
The nonparametric Spearman’s criterion was used to analyse for trends in the water quality variables and discharge time series, for the period 1980 to 1997. The Spearman’s test detected trends in discharge, dissolved oxygen, conductivity, sulphate, sodium, potassium and nitrate. The second order equation provided a better description of variables for which trends were detected.
Discharge was the only variable which showed a downward trend.
Acknowledgements
The authors wish to thank the Department of Irrigation and Water Protection of Greek Ministry of Agriculture for providing the water quality and discharge monitoring data for the Strymon River.
References
Antonopoulos, V. and Papamichail, D., 1991. Stochastic analysis of water quality parameters in streams, In: Water Resources
Management and Technology, G. Tsakiris (Ed.).Balcema, 369–
376.
Dahmen, E.R. and Hall, M.J., 1990. Screening of Hydrological
Data: Tests for Stationarity and Relative Consistency, ILRI
Publication No.49, Wageningen, The Netherlands.
Edwards, A.M.C., 1973. The variation of dissolved constituents with discharge in some Norfolk rivers, J. Hydrol., 18, 219–242. European Community, 1994. Water Quality of Surface
Waters-Common procedure for exchange of information. General
Direction XI, Environment, nuclear safety and public protection. Ferrier, R.C., Edwards, A.C., Hirst, D., Littlewood, I.G., Watts, C.D. and Morris, R., 2001. Water quality of Scottish rivers: spatial and temporal trends, Sci. Total Envir., 265, 327–342. Haan, C.T., 1977. Statistical methods in hydrology. The Iowa
University Press, Iowa, U.S.A.
Helsel, D.R. and Hirsch, R.M., 1992. Statistical Methods in Water
Resources. Elsevier, The Netherlands.
Hirsch, R.M. and Slack, J.R., 1984. A nonparametric trend test for seasonal data with serial dependence, Water Resour. Res.,
20, 727–732.
Hirsch, R.M., Slack, J.R. and Smith, R.A., 1982. Techniques of trend analysis for monthly water quality data, Water Resour.
Res. 18, 107–121.
Hirsch, R. M., Alexander, R.B. and Smith, R.A., 1991. Selection of methods for the detection and estimation of trends in water quality, Water Resour. Res., 27, 803–813.
Holder, R.L., 1985. Multiple regression in Hydrology. Institute of Hydrology, Wallingford, UK. 147pp.
Larsen, S.E., Kronvang, B., Windolf, J. and Svendsen, L.M., 1999. Trends in diffuse nutrient concentrations and loading in Denmark: Statistical trend analysis of stream monitoring data,
Water. Sci. Technol., 39, 197–205.
Lettenmaier, R.P., Hooper, E.R., Wagoner, C., and Fans, K.B., 1991. Trends in stream quality in continental United States, 1978-1987, Water Resour. Res., 27, 327–339.
Liebetrau, A.M., 1979. Water quality sampling: some statistical considerations, Water Resour. Res., 15, 1717–1728.
Littlewood, I.G., Watts, C.D. and Custance, J.M., 1998. Systematic application of United Kingdom river flow and quality databases for estimating annual river mass loads (1975-1994), Sci. Total
Envir., 210, 21–40.
Makridakis, S., Wheelwright, S.C. and Megee, V.E., 1986.
Forecasting: Methods and Application, 2nd edition. Wiley, New York.
Maybeck, M., Chapman, D. and Helmer, R., 1989. Global
Freshwater Quality - A First assessment, WHO and UNEP,
Miller J.D. and Hirst, D., 1998. Trends in concentrations of solutes in an upland catchment in Scotland, Sci. Total Envir., 216, 77– 88.
Mitsiou, K., Antonopoulos, V. and Papamichail, D., 1999. Statistical analysis of water quality parameters time series of Strymon river, Hydrotechnika, 9, 59–74 (in Greek)
Mitsiou, K., Antonopoulos, V. and Papamichail, D., 2000. Trend
analysis of water quality parameters of Strymon river.
Proceedings of 8th conference of Hellenic Hydrotechnical Chamber (EYE), Athens, 259–266 (in Greek).
Oborne, A.C., Brooker, M.P. and Edwards, R.W., 1980. The chemistry of the River Wye, J. Hydrol., 45, 233–252.
Pinol, J., Avila, A. and Roda, F., 1992. The seasonal variation of steamflow chemistry in three forested Mediterranean catchments, J. Hydrol., 140, 119–141.
Statgraphics, 1987. User’s Guide. Statistical Graphics
Corporation, S.T.S.C., Inc., USA.
van Dijk, G.M., van Liere, L., Amiraal, W., Bannink, B.A. and Cappon, J.J., 1994. Present state of the water quality of European rivers and implications for management, Sci. Total Envir., 145, 187–195.