HAL Id: hal-00968135
https://hal.archives-ouvertes.fr/hal-00968135
Submitted on 27 Nov 2018HAL is a multi-disciplinary open access archive for the deposit and dissemination of sci-entific research documents, whether they are pub-lished or not. The documents may come from teaching and research institutions in France or abroad, or from public or private research centers.
L’archive ouverte pluridisciplinaire HAL, est destinée au dépôt et à la diffusion de documents scientifiques de niveau recherche, publiés ou non, émanant des établissements d’enseignement et de recherche français ou étrangers, des laboratoires publics ou privés.
at Low Temperature
J. Jolly, B. Pavageau, J.M. Tatibouet
To cite this version:
J. Jolly, B. Pavageau, J.M. Tatibouet. High Throughput Approach Applied to VOC Oxidation at Low Temperature. Oil & Gas Science and Technology - Revue d’IFP Energies nouvelles, Institut Français du Pétrole, 2013, 68 (3), pp.505-517. �10.2516/ogst/2012053�. �hal-00968135�
Cet article fait partie du dossier thématique ci-dessous
publié dans la revue OGST, Vol. 68, n°3, pp. 403-528
et téléchargeable
ici
DOSSIER Edited by/Sous la direction de : L. Magna
Discovery and Optimization of Catalysts and Solvents for Absorption
Using High Throughput Experimentation
Découverte et optimisation de catalyseurs et d'absorbants par expérimentation haut débit
Oil & Gas Science and Technology – Rev. IFP Energies nouvelles, Vol. 68 (2013), No. 3, pp. 403-528Copyright © 2013, IFP Energies nouvelles
403 >
Editorial415 >
Cobalt Hydroformylation of Olefins in a Biphasic System Using Ionic Liquids – Development and Reaction Optimization by a Design Experiment ApproachHydroformylation des oléfines par le cobalt en milieu liquide ionique – Développement et optimisation de la réaction par plans d’expériences
L. Magna, S. Harry, A. Faraj and H. Olivier-Bourbigou
429 >
Using High Throughput Experimentation Approach for the Evaluation of Dehydrogenation Catalysts: Potential Interests and Drawbacks Utilisation d’une approche d’expérimentation à haut débit pour l’évaluation de catalyseurs de déshydrogénation intérêt et limitationsC. Bouchy, P. Duchêne and A. Faraj
445 >
Integration of an Informatics System in a High ThroughputExperimentation. Description of a Global Framework Illustrated Through Several Examples
Intégration informatique des outils d’expérimentation haut débit. Présentation d’une architecture globale via plusieurs exemples
B. Celse, S. Rebours, F. Gay, P. Coste, L. Bourgeois, O. Zammit and V. Lebacque
469 >
Graph Machine Based-QSAR Approach for Modeling ThermodynamicProperties of Amines: Applicationto CO2 Capture in Postcombustion
Approche QSAR Graph Machines pour la modélisation des propriétés thermodynamiques des amines: application au captage du CO2 en
postcombustion
F. Porcheron, M. Jacquin, N. El Hadri, D. A. Saldana, A. Goulon and A. Faraj
487 >
Knowledge Based Catalyst Design by High Throughput Screeningof Model Reactions and Statistical Modelling
Conception de catalyseur par criblage à haut débit de réactions modèles et modélisation statistique
G. Morra, D. Farrusseng, C. Bouchy and S. Morin
505 >
High Throughput Approach Applied to VOC Oxidation at Low TemperatureApproche haut débit appliquée à l’oxydation basse température des COV
J. Jolly, B. Pavageau and J.-M. Tatibouët
519 >
Development of Asymmetric Hydrogenation Catalysts via High Throughput ExperimentationDéveloppement de catalyseurs d'hydrogénation asymétrique par criblage haut débit
J.G. de Vries and L. Lefort
©
Photos:
IFPEN,
Fotolia,
High Throughput Approach Applied
to VOC Oxidation at Low Temperature
J. Jolly
1, B. Pavageau
1and J.-M. Tatibouët
21 Rhodia Laboratory of the Future (LOF), UMR 5258, 178 Av. du Docteur Schweitzer, 33608 Pessac Cedex - France 2 Laboratoire de Catalyse en Chimie Organique (LACCO), UMR CNRS 6503, Université de Poitiers, 40 Av. du Recteur Pineau,
86022 Poitiers Cedex – France
e-mail: [email protected] - [email protected] - [email protected]
Résumé — Approche haut débit appliquée à l’oxydation basse température des COV — Une approche haut debit (HD) est utilisée de la préparation jusqu’à la caractérisation de l’activité catalytique des matériaux pour l’élimination des Composés Organiques Volatils (COV) à basse température. L’intérêt des plans d’expériences (DoE, en anglais Designs of Experiments) dans le screening primaire est démontré grâce à l’identification d’une composition optimale de catalyseur prédite à l’aide des différentes températures d’ignition des catalyseurs obtenues par thermographie infrarouge. La combinaison in situ de la spectrométrie de masse et de la thermographie infrarouge s’est avérée d’une grande utilité pour confirmer et augmenter le niveau d’information concernant les propriétés catalytiques des catalyseurs provenant du screening primaire. Enfin, la spectroscopie Raman in situ couplée à la thermographie infrarouge permet de mieux comprendre l’origine des propriétés catalytiques dans le cas du catalyseur Au/CeO2. Une forte interaction entre les particules d’or et des liaisons Ce-O, impliquant
une augmentation de la réductibilité de l’oxyde de cérium, pourrait expliquer son importante réactivité vis-à-vis de l’oxydation de l’isopropanol à plus basse température.
Abstract — High Throughput Approach Applied to VOC Oxidation at Low Temperature — A High
Throughput (HT) approach is used to prepare and characterize the catalytic activity of materials for the destruction of Volatile Organic Compounds (VOC) at low temperature. The interest of the Designs of Experiments (DoE) in the primary screening is demonstrated through modeling catalysts composition according to the light-off temperature detected by infrared thermography. The combination of the mass spectrometry and the infrared thermography appears very useful to confirm and increase information about catalytic properties of the catalysts extracted to the primary screening stage. Finally, in situ Raman spectroscopy with infrared thermography allows to better understand the origin of the catalytic properties in the case of Au/CeO2 catalysts. A strong interaction between gold and Ce-O bonds leading to
an improvement of the cerium oxide reducibility could explain its high reactivity for 2-propanol oxidation at lower temperature.
Oil & Gas Science and Technology – Rev. IFP Energies nouvelles, Vol. 68 (2013), No. 3, pp. 505-517 Copyright © 2013, IFP Energies nouvelles
DOI: 10.2516/ogst/2012053
Discovery and Optimization of Catalysts and Adsorbents Using High Throughput Experimentation Découverte et optimisation de catalyseurs et d'adsorbants par expérimentations haut débit
INTRODUCTION
This work is a part of the NACOMAT project approved by the French Aerospace Valley competitiveness cluster in which the elimination of Volatile Organic Compounds (VOC) in aircraft cabin is investigated. In order to do this, the catalytic combustion appears as one of the best solutions [1-6]. The conventional catalyst development essentially relies on fundamental knowledge and know-how. It implies a complete characterisation of the catalyst in order to establish properties-activity relationship. The main drawback of this approach is to be a very time-consuming process, making and testing one material at a time. Another drawback comes from the relative importance of intuition for the initial choices of development strategy [7]. To overcome these major drawbacks, attempts to shorten this process by using High Throughput (HT) technology or experimentation have been reported for about 10-15 years. The HT approach which is more pragmatic-oriented, has become an accepted and important strategy in the development of catalysts and mate-rials [8]. However, such an approach has more success in the optimization than in the discovery [9-12]. It deals with the screening of collections of samples. However, it may be stressed that relevant parameters are usually unknown and can be hardly directly and individually controlled. In addi-tion, it is in general a combination of factors that provides outstanding properties which are today’s required to meet challenging targets. Here, it has been decided to combine both traditional and HT approaches while trying to maintain a relatively HT even for characterization, e.g. relying on fast but informative analytical techniques. This study shows a restricted examination of a search space (phase diagram at 4 components), which aimed at testing the methodology, i.e. statistics tools [13-15] and the HT apparatus both commercial
and developed in-house despite the fact that the parallel preparation of catalysts has already been used for impregnation of metallic salts on oxide supports [15, 16], while previous works have clearly demonstrated interest in using statistical tool. Concerning the HT characterization, several devices have already demonstrated their efficiency such as Gas Chromatography (GC) and Mass Spectrometry (MS) [17-23] or InfraRed Thermography (IRT) [24-28]. The latter is selected and a device is designed for a fast light-off temperature ranking of materials.
We present the High Throughput methodology applied to the screening of catalysts for VOC oxidation. The specific workflow employed in this work is presented in Figure 1. Design of experiments, especially mixture design and full factorial design are used to build the search spaces. The different stages of the methodology are described in this paper, with a concrete case of study showing the interest of each stage. First, an experimental design is presented in the primary screening part. A library containing four well-known metals selected for their good properties about VOC oxida-tion is chosen, namely Pt, Pd, Cu [29-32] and Au [1-5], while cerium oxide (CeO2) is used as support. Indeed, cerium oxide is well known for its very good reducibility [33], its high Oxygen Storage Capacity (OSC) [34] and the formation of defects such as oxygen vacancies [35, 36]. Cerium oxide with a relatively high specific surface (149 m2/g measured by
BET method) provided by Rhodia is used in this work. The HT excess-solution impregnation, precipitation-deposition, anionic/cationic adsorption are adapted on a commercialized robotic platform. The anionic/cationic adsorption consists on the monitoring of surface charges of the support to improve the impregnation of metallic salts. For instance, in the case of cerium oxide with an isoelectric point of 6.7 [37], the adding of hydrochloric acid at pH = 1 leads to the formation of
– Mixture design – Full factorial design
Design of experiments
Parallel catalytic testing by infrared thermography Primary screening Secondary screening Tertiary screening – Anionic/cationic adsorption – Excess-solution impregnation – Deposition-precipitation
Parallel catalysts preparation
Fixed bed reactor with mass spectrometry and infrared thermography
Fixed bed reactor with Raman spectroscopy and infrared thermography Figure 1
positive charges on the cerium oxide surface, which can enhance the impregnation of anionic metallic salts such as AuCl4-. The two others preparation methods are detailed
below. Concerning the catalytic testing at the first level (pri-mary screening), a home-made apparatus based on the infrared thermography is used with a fast sequential approach allowing an identical contact time between gas and solid for each catalysts. Due to the restriction on the search space dimension, this work is not expected to discover new cat-alytic materials but rather to show a complete and reliable workflow with statistical tool integrated. This methodology has been further applied to more challenging, i.e. novel mate-rials [25] and for fine tuning catalyst formulation and prepa-ration. The second stage of the HT workflow aims to validate or reject the potential candidates extracted to the primary screening. In this stage, a novel combination between mass spectrometry and infrared thermography is described. Information about selectivity and catalytic stability of ceria-based catalysts are presented allowing the identification of the best catalysts in our search space. Finally, the last stage of the HT workflow is consecrated to the understanding of the catalytic process. Results about the combination of IR ther-mography and Raman spectroscopy during the 2-propanol oxidation are detailed in the last part of this article.
1 PRIMARY SCREENING 1.1 Design of Experiments
In order to sample the search space, various methods are available. The sampling strategy in HT material science and especially heterogeneous catalysis typically embodies a chemist assessment of where might be a good location to col-lect data or is derived from the iterative optimization [13] (principally with evolutionary algorithm) of specific design criteria usually the selectivity or conversion. In this study, the sampling strategy relies on a classical DoE [38, 39] since the
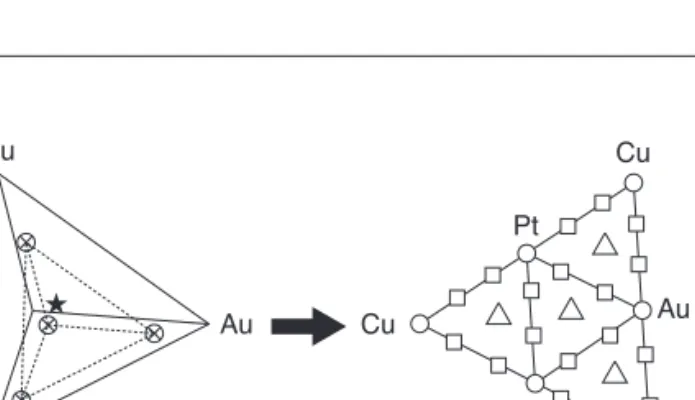
aim of this preliminary assessment of our workflow platform simply requires a restricted number of materials to be screened. The influence of metals which are impregnated on a cerium oxide with a High Surface Area (HSA) is expected to be modeled thanks to a standard mixture design and Multi-Linear Regression (MLR). A simplex lattice design, as already done by Thathagar et al. [40] with four components corre-sponding to chosen metals is built. The degree of lattice is fixed to three, e.g. {0, 1/3, 2/3, 1}. It corresponds to the “mesh-ing” of phase diagram and consequently determining the num-ber of experiments: 25 catalysts (see Tab. 1 in Sect. 1.4). Figure 2 shows the tetrahedron containing the experiments,
i.e. 5 quaternary mixtures, 4 ternary mixtures, 12 bimetallic
catalysts and 4 mono-metallic catalysts. 1.2 Preparation
The robotic platform “Accelerator SLT 100” from Chemspeed
Technologies is employed for the preparation. Various tools
are available such as stirring, solid dispensing, liquid handling, filtration, pH regulation, heating/cooling allowing the study of various parameters, e.g. the temperature, pH, stirring rate, metal loading and the support nature. The HT preparation by excess-solution impregnation is presented in Figure 3. It is performed in two arrays of 16 double-jacket reactors of 13 mL. The mass concentration of metal is fixed to 2 g/L. The distri-bution order of these solutions is as follows: HAuCl4, 3H2O;
Pd(NO3)2, 2H2O; H2PtCl6, 6H2O and Cu(NO3)2, 3H2O. The
targeted metal/CeO2 mass fraction is 1%. Then, HSA cerium oxide (149 m2/g) is dispensed in each reactor containing
metallic salts (500 mg). Then, the mixtures are stirred with vortex at 600 rpm during one hour and then dried at 140°C during 8 hours. Catalysts calcination is carried out, off-line, under atmospheric air at 350°C during 2 hours. After the step 4, each filtrated solution is collected and analyzed by UV/Visible absorption equipped with a reflection probe to estimate the adsorbed quantity of metallic salts on the cerium oxide (not presented here). No absorption peak has been observed in the filtrated solution suggesting the good adsorption of metallic salt on the cerium oxide at high specific surface area.
1.3 Characterization
Concerning the characterization, our motivation is to design an analytical method able to quickly analyze the throughput of catalysts. Thus, in order to not slow down the whole process, IRT is employed, allowing a good balance between time and quality of retrieved information. The ThermoVision A20M camera (FLIR Systems) is used to accomplish the pre-liminary screening, the spectral detection is ranged between 7.5 and 13 μm and thermal sensitivity is 90-120 mK at 25°C. Since infrared radiation is emitted by objects based on their temperatures, according to the black body radiation law,
J. Jolly et al. / High Throughput Approach Applied to VOC Oxidation at Low Temperature 507
Cu Cu Cu Au Cu Au Pt Pt Pd Pd Figure 2
Simplex design plot: mono-metallic (●●), bi-metallic (■■), tri-metallic (▲▲) and tetra-metallic (★) catalysts.
thermography allows to “see” one’s environment with or without visible illumination. Thus, heat flux due to the oxida-tion reacoxida-tion in surface is easily detected knowing that the oxidation of 2-propanol into CO2is very exothermic.
C3H8O(g)+ 9/2 O2 (g)→ 3CO2(g)+ 4H2O(g) ΔrH = – 1 874.8 kJ/mol
The IRT technique is particularly adapted for the charac-terization of gas/solid systems because the “core” of the exothermic area is thermally isolated by the gas phase (low thermal conductivity) and subsequently, a good signal/noise ratio is obtained. Figure 4 presents the HT catalytic testing developed for the project [41]. The generation of the mixture containing air and 2-propanol is accomplished by the injec-tion of a carrier gas (air) into a flask filled with 2-propanol(l). The flask temperature is maintained at 5°C leading to a composition of 8 700 ppm of 2-propanol in the gaseous mixture. The flow rate is fixed to 20 mL/min with a mass flow controller. A multiposition valve is placed just before the reactor in order to sequentially switch on each well.
The stainless steel 9-well reactor block allows the heating from room temperature up to 550°C, the 9 catalysts are loaded on stainless steel frits (2 μm porosity). The whole device is automated via a Labview interface: the molar percentage of 2-propanol in gas flow, the reactor block temperature and the electrovalves opening/closing can be easily monitored and tuned. The catalysts are ranked according to the light-off tem-perature. Iojoiu et al. [42] presents a study dealing with the HT experimentation for soot combustion where this criterion is measured by thermocouples located inside each reactor. Using the IRT technique, complete temperature cartography of the catalyst surface can be made and, moreover, the non intrusive measurement method avoids any sampling contact (easy to parallelize). 25 catalysts have been prepared leading to the realization of 3 runs in the 9-well reactor block. At first, the reactor block is heated at 120°C, the reactive gas is switched on each well (10 s per well) with the help of the multiposition valve. At the end of the switching, the block
reactor is heated at 124°C (step of 4°C) and the switching procedure is reiterated. These steps are repeated until 300°C. During this procedure, we expect to observe the beginning of the 2-propanol oxidation corresponding to the appearance of the exothermic process. In our case, the first exothermic peak observed during the characterization process is associated to
Metallic salts dispensing 1 Cerium oxide dispensing 2 Stirring (vortex) 3 Parallel filtration 4 Drying 5 9-well reactor block Multiposition valve Carrier gas a) b) Carrier gas
Carrier gas + 2-PrOH(g)
Color image Thermal image
T
230.6°C
< 50.0°C
2-PrOH(l) Figure 3
Schematic representation of the HT preparation workflow: excess-solution impregnation.
Figure 4
a) Overall view of the system used for catalysts testing, b) example of thermal image of 9-well reactor block.
J. Jolly et al. / High Throughput Approach Applied to VOC Oxidation at Low Temperature 509
the light-off temperature. In order to see the effect of the well position about the light-off temperature, the 9 wells are filled with the same sample. Three different catalysts (Pt/Al2O3, CeO2 and Au/CeO2) are used for this calibration. Moreover, in another primary screening of the global study (not totally presented here) where the effect of different dopants into cerium oxide lattice (Zr, La, Pr) is studied, the same catalysts are loaded in two different experiments in order to study the reproducibility of the home-made apparatus. The error bar about the value of the light-off temperature is +/– 2°C. The choice of a fast sequential procedure allows an identical con-tact time between the catalyst and reactive gas for each well of the reactor. Indeed, in a parallel approach, a global feeding in the reactor is carried out and if the pressure drop is not exactly the same for each catalyst, preferential ways of gas feeding could be appeared leading to eventual inaccurate results.
1.4 Results and Discussions
The light-off temperatures corresponding to the first exothermic peak observed (arrows in Fig. 5) are reported for each catalyst in Table 1. The lowest light-off temperature is obtained for the Pd0.67Au0.33/CeO2 catalyst and the highest for Pt0.67Au0.33/CeO2.
Mixture design analysis is carried out with Minitab soft-ware (LEAD Technologies). A preliminary analysis of the main effects is performed (Fig. 6). Main effects plot shows the contribution of each metal in the light-off temperature when a given metal is present with or without others metals. The slopes of the regression lines obtained with the experi-mental data show if a factor affects the response, so the steeper the slope of the line, the greater the magnitude of the
TABLE 1
Experimental design and responses
Catalyst # Pt Pd Au Cu Light-off temperature (°C)
1 1 0 0 0 224 2 2/ 3 1/3 0 0 198 3 2/ 3 0 1/3 0 226 4 2/ 3 0 0 1/3 223 5 1/ 3 2/3 0 0 217 6 1/ 3 1/3 1/3 0 204 7 1/ 3 1/3 0 1/3 211 8 1/ 3 0 2/3 0 216 9 1/ 3 0 1/3 1/3 216 10 1/ 3 0 0 2/3 223 11 0 1 0 0 204 12 0 2/ 3 1/3 0 195 13 0 2/ 3 0 1/3 215 14 0 1/ 3 2/3 0 200 15 0 1/ 3 1/3 1/3 207 16 0 1/ 3 0 2/3 211 17 0 0 1 0 204 18 0 0 2/ 3 1/3 209 19 0 0 1/ 3 2/3 209 20 0 0 0 1 224 21 1/ 4 1/4 1/4 1/4 214 22 5/ 8 1/8 1/8 1/8 211 23 1/ 8 5/8 1/8 1/8 200 24 1/ 8 1/8 5/8 1/8 214 25 1/ 8 1/8 1/8 5/8 211 “Best” 0 0.47 0.53 0 193 140 160 180 200 220 240 260 280 300 120 0 5 0 5 T e mperature variation by IR (°C)
9-well reactor temperature (°C) Pd0.33Au0.67/CeO2149
Pt0.33Cu0.67/CeO2149
Well 2
Well 5
Figure 5
Thermal profiles for two catalysts: Pt0.33Cu0.67/CeO2149 (●●)
and Pd0.33Au0.67/CeO2149 (+). 0.5 1 0 220 230 200 Tlight-of f (°C) 210 wt% metal Pt Slope = 13.2124 0.5 1 0 220 230 200 Tlight-of f (°C) 210 wt% metal Pd Slope = -13.0125 0.5 1 0 220 230 200 Tlight-of f (°C) 210 wt% metal Au Slope = -6.4492 0.5 1 0 220 230 200 Tlight-of f (°C) 210 wt% metal Cu Slope = 12.067 Figure 6
main effect. The presence of Pd or Au clearly affects the slope of line showing a decrease of the light-off temperature (negative slope) contrary to the two others metals (Pt and Cu) as already mentioned in past studies [43, 44]. However, the positive effect of gold loading could suggest that the presence of chlorine ions is not the only criterion explaining the trend, a real impact of metal nature seems appear. Multi-Linear Regression (MLR) is employed as modeling tool. Multi-linear models such as special cubic (principal terms, binary and ternary interactions) and quadratic model (only binary inter-actions with principal terms) are tested. The choice of predic-tive model is done through Fisher test determining whether two population proportions are equal. The variance of the regression model and the variance of residuals are compared and p-value is used to take the decision about the correctness of the model. If a p-value < 0.05 (α-level) rejects equality of the two variances, the statistical model can be chosen. Table 2 presents the different steps leading to the choice of the quadratic model in our case. Adjusted R2is defined as:
1 – (1 – R2)×(n–1) × (n – 1 – k)–1
where R2 is the coefficient of determination, k is the total
number of regressors in the linear model (but not counting the constant term) and n is sample size. Predicted R2indicates
how well the model fits for new observations. Predicted R2
can prevent to overfit the model and can be more useful than adjusted R2for comparing models because it is calculated
using observations not included in model estimation. Taken into account ternary interactions, no model is adequate, p-value shows that the variance of the cubic model is similar to the variance of residuals, i.e. model is rejected. Then, when binary interactions of copper with each other metals are pro-gressively removed, the variance equality is rejected for the quadratic model (step 8) and can be accepted even though the predicted R2 is relatively low. Following equation presents
the chosen quadratic model with associated coefficients: ˆ
y = 221.55× Pt + 207.03 × Pd + 204.63 × Au + 218.97 × Cu
– 38.78× Pt * Pd + 31.88 × Pt * Au – 36.93 × Pt * Au Mixture contour plots are represented according to the selected predictive model (Fig. 7). The four sides of tetrahe-dron are projected on the same plane in order to simplify the observation. The fourth component is hold to its lower value,
i.e. zero. In Figure 7a, an area (in grey) where Pd and Au
coexist in the same proportion appears to give the lowest light-off temperature. The adding of Pt progressively increases the light-off temperature. This phenomenon is more accentuated when catalysts is highly loaded with gold. The negative effect of the Platinum about light-off temperature
TABLE 2
Results of mixture design analysis:
grey cells indicate the significant model (p-value < 0.05)
Step 1 2 3 4 5 6 7 8 9 Pt x x x x x x x x x Pd x x x x x x x x x Au x x x x x x x x x Cu x x x x x x x x x Pt*Pd x x x x x x x x x Pd*Au x x x x x x x x x Pt*Au x x x x x x x x Au*Cu x x x x x x x Pd*Cu x x x x x x Pt*Cu x x x x x Pd*Au*Cu x x x x Pt*Pd*Cu x x x Pt*Pd*Au x x Pt*Au*Cu x Predicted R2 0.00% 0.00% 0.00% 0.00% 0.00% 0.00% 17.62% 25.18% 19.86% Adjusted R2 37.83% 42.89% 46.98% 50.25% 52.16% 55.11% 57.41% 58.25% 55.36%
p-value quadratic model 0.419 0.368 0.302 0.24 0.237 0.142 0.079 0.047 0.053 p-value special cubic 0.966 0.902 0.769 0.525 - - - -
-could be attributed to the choice of metallic salt H2PtCl6, no washing steps are performed to eliminate residual chlorine ions. Several works have already reported its negative effect in catalytic process [45, 46]. However, the impregnation of
gold species (form HAuCl4) on cerium oxide positively
affects the catalytic response. Consequently, the presence of chlorine ions is probably not the only reason which can explain the bad catalytic properties observed in several cases.
The presence of copper particles shows a negative effect about catalytic activity at low temperature. However,
CuO/CeO2has shown its good properties for CO oxidation
[47] but note in the case of 2-propanol oxidation suggesting an oxidation mechanism slightly different. The 2-propanol oxidation involves its adsorption on the surface and a subse-quent breaking of a lot of chemical bonds (by-products adsorbed on the surface) leading to a more complicated oxi-dation process. It would be interesting to compare the results for 2-propanol with others VOC like ethanol, toluene in order to confirm the trends.
The response optimizer tool from Minitab is used to determine the metal proportions corresponding to the mini-mum response, i.e. minimini-mum light-off temperature (Fig. 8). This tool looks for a combination of input variables that jointly minimize our response. Desirability function is used to reach minimum response, weight is fixed to one allowing an equal emphasis on the target and the bounds (between upper and lower). The desirability for the response will increase linearly. An optimal response is obtained for the Pd0.47Au0.53CeO2149 catalyst.
To confirm the prediction of the statistical model, Pd0.47Au0.53CeO2149 catalyst is prepared on the robotic platform in the same conditions as mentioned before. The same light-off detection process is employed and a light-off temperature value of 193°C is obtained which validate the prediction value (196°C in Fig. 8).
In this case of study, we demonstrate the interest of the mixture design to deeply analyze the results obtained with a
J. Jolly et al. / High Throughput Approach Applied to VOC Oxidation at Low Temperature 511
a) Pt 1 0 1 1 Au Pd 0 0 b) Pt 1 0 1 1 Cu Pd 0 0 c) Pt 1 0 1 1 Cu Au 0 0 d) Pd 1 < 200 200-205 205-210 210-215 215-220 > 220 Light-off temperature 0 1 1 Cu Au 0 0 T Targ: 150.0 y = 196.5626 d = 0.53437 Composite desirability 0.53437 Optimal D 0.53437 [ ]:Pt 1.0 [0.0] 0.0 [ ]:Pd 1.0000 [0.4681] 0.0 [ ]:Au 1.0 [0.5319] 0.0 [ ]:Cu 1.0 [0.0] 0.0 Lower bound Upper bound 1 0 Weight = 10 W eight = 1 Weight = 0.1 Target High Cur Low Desirability function for response minimization
Figure 7
Mixture contour plots for light-off temperature.
Figure 8
HT approach. In the global project, several mixture design and full factorial design have been carried out in order to study different effects such as: the nature of the doping into cerium oxide structure (La, Pr, Zr), the effect of metal loading and also the preparation method. After the global primary screening (not totally presented in this publication), gold/cerium oxide at high specific surface area prepared by deposition-precipitation have shown the best catalytic properties for 2-propanol oxidation. The deposition-precipitation method is well-known to maintain active small particles of gold (dAu< 3 nm) on surface (TiO2, Fe2O3, Co3O4) [48] but also in the case of Au/CeO2 for CO oxidation [49].
2 SECONDARY SCREENING
After the identification of the best candidates (Au/CeO2) with the primary screening, the aim of the secondary screening is to confirm and give more details about catalytic properties. In our case, information about selectivity and conversion is expected by the combination of mass spectrometry and infrared thermography. An example dealing with the effect of gold loading on cerium oxide at different specific surface is presented in this section.
2.1 Preparation
Au/CeO2 is prepared by deposition-precipitation on the
robotic platform Chemspeed (Fig. 9). At first, the pH of the aqueous solution of HAuCl4, 3H2O is adjusted with sodium hydroxide (0.1M) at 6.0-7.0 in a single double jacket reactor with pH probe maintained at 70°C. After that, each adjusted solution is transferred in a 16 double jacket reactor block and cerium oxide powder is dispensed with the solid dispensing unit. Then, the slurry is stirred during 2 hours at 600 rpm. Washing with ammonium hydroxide is performed to remove the chlorine species susceptible to be present on the catalyst surface. This washing step is crucial to avoid the gold particles
agglomeration on the surface as already mentioned in many publications [46, 50]. Slurries are finally filtrated and dried at 140°C. The obtained powders are transferred in crucibles and calcined off line at 350°C during 2 hours.
2.2 Characterization
2-propanol oxidation is simultaneously analyzed by infrared thermography and mass spectrometry (Fig. 10). The 2-propanol conversion and CO2 and acetone formation is followed in real time while temperature cartography on the catalyst surface can be tracked. The injection of the mixture of 2-propanol and air is monitored by electro valves system allowing the switching of the reactive gas (air + 2-propanol) and the car-rier gas (air). A mass capillary is placed just above the open reactor. A thermal picture is presented in Figure 4. The thermal pixels of the catalyst surface are recorded and in the same time, ion currents corresponding to CO2, 2-propanol and acetone are measured.
pH adjustment 1 Transfer info parallel reactor 2 Cerium oxide dispensing 3 Parallel filtration 4 NH4OH washing 5 Drying 6 Gas inlet
Infrared thermography Mass capillary
Catalyst
Mass spectrometer capillary Flexible heaters + thermocouple INOX frit
175.4°C
25.3°C
Figure 9
Schematic representation of the HT preparation workflow: Au/CeO2prepared by deposition-precipitation.
Figure 10
Combination of infrared thermography and mass spectrometry.
2.3 Results and Discussions
The reactor temperature is fixed to 210°C due to the good discrimination of the catalytic activities of the 3 catalysts. In the case of the Au/CeO2 149 m2/g, the temperature variation
increases dramatically and level off at 60°C. This trend is observed again for each catalytic cycle. In the case of Au/CeO2 at relatively low specific surface area, the tempera-ture variation on the catalyst surface dramatically decreases after the first catalytic cycle showing the modification of the catalytic process. Indeed, the exothermic effect is more accentuated when 2-propanol is transformed into CO2 than into acetone (ΔrH = –1 874.8 kJ/mol against –187.5 kJ/mol
respectively). The thermal responses are completely corre-lated with the mass signals obtained as presented in Figure 11,
a good agreement between CO2 formation and reaction heat
are found. Moreover, it’s important to note that no ion current corresponding to the propene formation is observed showing the basic behavior of the ceria-based catalyst [51].
3 TERTIARY SCREENING 3.1 Characterization
In situ Raman spectroscopy has already demonstrated the
interest to understand the catalytic process [52]. However, some limitations of this technique appear such as the difficulty to obtain quantitative data due to the modification of the
intensity with the temperature. Moreover, fluorescence phenomenon can sometimes occur when impurities of organic species still remain on the catalyst surface. Generally, fluores-cence can be reduced by changing the excitation frequency [52].
An open single reactor is used to easily combine the confocal raman spectroscopy and the infrared thermography
(Fig. 12). A LabRam HR 800 Raman spectrometer (Horiba-Jobin Yvon) equipped with a confocal microscope is used in
this work. The laser beam at 532 nm is vertically focused
J. Jolly et al. / High Throughput Approach Applied to VOC Oxidation at Low Temperature 513
10 5 10 15 x 10-10 20 30 40 Time (min)
Ion current 44 (a.u.) 50 60 70
10 0 20 40 60 80
Air + 2-PrOH Air Air + 2-PrOH Air Air + 2-PrOH
20 30 40 Time (min) b) a) 0.5% Au/CeO2 149 m2/g 0.5% Au/CeO2 32 m2/g 0.5% Au/CeO2 50 m2/g Δ T (°C) 50 60 70 Figure 11
a) Temperature variation of 3 catalysts where specific surface area is decreased, b) evolution of the ion current corresponding to CO2(m/z = 44) according to the catalytic cycles. Reactor temperature is maintained at 210°C.
Catalyst Gas inlet Flexible heaters + thermocouple Confocal Raman spectroscopy Infrared thermography INOX frit Figure 12
Combination of infrared thermography with Raman spectroscopy.
with an objective × 10 on the surface of the catalytic bed while infrared camera is slightly titled. Spectra are quickly collected using a 600 grooves.mm-1grating (1 cm-1 spectral
resolution) and an exposition time of 2 seconds with 2 spectra accumulations. The gas inlet is injected by the bottom of the reactor and the catalyst is filled at the top of the reactor. We decide to study the best candidate extracted after the primary and secondary screening, i.e. Au/CeO2 at high specific surface area prepared by deposition-precipitation. In the same way of the secondary screening, catalytic cycles are carried out but air carrier gas is replaced by N2 in order to observe the reducible behavior of the cerium oxide. A mixture containing N2 and 2-propanol is generated with the same composition of 2-propanol as already used in the primary and secondary screening, i.e. 8 700 ppm. The gas injection is stopped between each catalytic cycle while the reactor temperature is maintained at 210°C. The gas-hourly space velocity is fixed to 46 000 h-1. This experiment is
expected to give the prominence of the mobile surface oxygen species during N2+ 2-PrOH cycles.
3.2 Results and Discussions
At first, Raman spectra of Au/CeO2 and CeO2 are compared before the catalytic transformation of 2-propanol (Fig. 13). In
the two catalysts, we observe the band at around 450 cm-1
corresponding to the Raman-active mode of the fluorite-structure lattice (space group Fm3m). However, a strong shift of this band at lower energy (440 vs 453 cm-1) is observed
when gold species are present on the cerium oxide surface. We suggest that this shift at lower energy is due to the lattice
expansion conducing to the formation of Ce3+ species (ionic
radius larger than Ce4+) and oxygen vacancies [53]. Zhang et al. [54] also reports the dependency of the particle size with
the Raman shift at 464 cm-1 assumed to be caused by the Ce3+
ions and the increase of oxygen vacancies [54]. Moreover,
the band at 443 cm-1, in the case of Au/CeO
2, becomes
broader showing the increase of the disorder in the cerium oxide lattice.
Consequently, we decide to follow the shape of the band at 443 cm-1during successive injections of N
2and 2-propanol
at 210°C. The band is fitted with a Lorentzian function in order to extract the Raman shift position and the intensity after correction of the baseline. Figure 14 presents the intensity and the Raman shift of the band at 443 cm-1during cycles
and also the temperature variation detected at the surface of the catalyst.
The first 400 seconds correspond to the increase of the temperature until 210°C. Taking into account the Boltzmann distribution, the increase of the temperature affects the inten-sity of Raman Stokes scattering due to the increase of the anti-Stokes/Stokes ratio, i.e. high-energy state population becomes higher and consequently Raman stokes scattering is reduced [55]. The decrease of the Raman intensity can be also correlated with the de-focalization of the laser spot due to the dilatation of the sample during heating. After, reactor temperature is maintained at 210°C, consequently, thermal effects exclusively come from the catalyst reaction. During the first injection of reactant gas, the Raman intensity profile dramatically bottoms out at zero (Fig. 14a). Here, we can suggest a structural modification of the cerium oxide conducing to the surface oxygen uptake in the aim of the 2-propanol oxidation, i.e. CeO2→ CeO2-x+ x/2 O2. Within the same oxidation time slot, temperature variation detected by the infrared camera quickly rises and levels off at +10°C sug-gesting that the oxidation process is occurring (Fig. 14c). After that, the gas feeding is then stopped leading to the reap-pearance of the Raman peak as showed at 1 191 seconds in Figure 14. Keeping in mind that the reactor is open in atmos-pheric air, re-oxidation of cerium oxide can be made by using environmental oxygen species. This phenomenon is rela-tively fast and just ten seconds are necessary to find a new steady state. Concerning the thermal profile during gas switching, a strong exothermic peak (ΔT = + 34°C) appears due to the oxidation of adsorbed organic compounds which are remained on the catalyst surface. The same behavior is observed after each cycle. Now, when we observe the steady
state obtained between each injection of N2 + 2-propanol
(asterisks in Fig. 14), the intensity and the Raman peak posi-tion significantly increase leading us to suggest some hypothe-sis about the process occurring on the catalyst surface. Indeed, in the case of pure cerium oxide (results not pre-sented here), intensity and Raman peak position are identical after each injection of N2+ 2-propanol. Gold species on the ceria surface seems to evolve with the catalytic cycles. At the
700 800 600 453 cm-1 442 cm-1 Au/CeO2 CeO2 500 400 300 200
Standardized intensity (a.u.)
Raman shift (cm-1)
Figure 13
Raman spectra obtained before the catalytic transformation of 2-propanol.
J. Jolly et al. / High Throughput Approach Applied to VOC Oxidation at Low Temperature 515
beginning, the strong modification of the ceria lattice (shift of the Raman peak at higher energy) could be due to the pres-ence of Auδ+species on the ceria surface (strong interaction between Ce-O bonds and Auδ+ species). The increase of the intensity and Raman shift position with the successive cycles could suggest a progressive reduction until the metallic state. Indeed, the Raman peak of Au/CeO2 at the end of the cycles comes closer to the Raman peak associated to the pure cerium oxide. The effect of gold species on the surface could become weaker but without negative impact about catalytic activity for the 2-propanol oxidation at 210°C.
CONCLUSIONS
In this work, we demonstrate the interest of the HT methodology. Different cases of study are presented in each screening stage. In the first part of this study, an optimal composition is quickly reached by using a mixture design (Pd0.47Au0.53/CeO2149). The adaptation of classical catalysts preparations into a robotic platform allows saving time while allowing a good reproducibility. HT characterization is employed to avoid bottlenecks and, once more, the use of IRT for preliminary screening appears to be very useful for
550 500 450 400 t = 1191 s Intensity (counts/s) 350 1500 1000 500 0 550 500 450 400 t = 1823 s 350 1500 1000 500 0 550 500 450 400 t = 5 083 s 350 1500 1000 500 0 Raman shift (cm-1) 4 000 5 000 1 000 Intensity (counts/s) N2 + 2-Propanol N2 + 2-Propanol N2 + 2-Propanol N2 + 2-Propanol N2 + 2-Propanol N2 + 2-Propanol N2 + 2-Propanol N2 + 2-Propanol 0 1500 1000 500 0 Times (s) * * * *
Raman shift (cm-1) Raman shift (cm-1)
2 000 3 000 4 000 5 000 1 000 Raman shift (cm -1) 0 445 444 443 442 441 440 Times (s) a) b) c) Raman spectroscopy Infrared thermography 1 000 2 000 3 000 4 000 5 000 T emperature variation (°C) 0 40 50 30 20 10 0 -10 -20 Times (s) 2 000 3 000 Figure 14
a, b) Combination of Raman spectroscopy c) with infrared thermography during 2-propanol oxidation at 210°C in the case of Au/CeO2at high specific surface area.
the study of total oxidation reactions. In the second part, the mass spectrometry combined to infrared thermography con-firms the good activity of the candidates extracted to the full primary screening with complementary information about selectivity and catalytic stability of 2-propanol oxidation. Finally, the combination of Raman spectroscopy and infrared thermography brings light about the redox properties of Au/CeO2 catalyst during the catalytic process (disappearance and re-appearance of Raman peak). Moreover, a modifica-tion of the oxidamodifica-tion state of gold species (Auδ+→ Au0) is
suggested. A full HT methodology is investigated with the integration of the HT characterization of specific surface area and acid/base properties [56, 57].
ACKNOWLEDGMENTS
We gratefully acknowledge the financial support of NACOMAT project (Aerospace Valley competitiveness cluster). Moreover, we would like to acknowledge Rhodia and especially Emmanuel Rohart for supplying rare earth oxides and for fruitful discussions.
REFERENCES
1 Pina C.D., Dimitratos N., Falletta E., Rossi M. (2007) Catalytic Performance of Gold Catalysts in the Total Oxidation of VOCs, Gold Bull. 67-72.
2 Centeno M.A., Paulis M., Montes M., Odriozola J.A. (2002) Catalytic combustion of volatile organic compounds on Au Au/CeO2/Al2O3 and Au/Al2O3catalysts, Appl. Catal. A: Gen. 234, 65-78.
3 Minicò S., Scirè S., Crisafulli C., Galvagno S. (2001) Influence of catalyst pretreatments on volatile organic compounds oxida-tion over gold/iron oxide, Appl. Catal. 34, 277-285.
4 Minicò S., Scirè S., Crisafulli C., Maggiore R. (2000) Catalytic combustion of volatile organic compounds on gold/iron oxide catalysts, Appl. Catal. B: Env. 28, 3, 245-251.
5 Scirè S., Minicò S., Crisafulli C., Satriano C., Pistone A. (2003) Catalytic combustion of volatile organic compounds on gold/cerium oxide catalysts, Appl. Catal. B: Env. 40, 43-49. 6 McGrath M. (1995) Catalysts and Systems for the Removal of
Volatile Organic Compounds, Rev. Lit. Arts Am. 5, 3.
7 Jandeleit B., Schaefer D.J., Powers T.S., Turner H.W., Weinberg W.H. (1999) Combinatorial Materials Science and Catalysis, Angew. Chem. Int. Ed. 38, 2994-2532.
8 Senkan S. (2001) Combinatorial Heterogeneous Catalysis -A New Path in an Old Field, -Angew. Chem. Int. Ed. 40, 312-329. 9 Farrusseng D., Klanner C., Baumes L., Lengliz M., Mirodatos C., Schüth F. (2005) Design of Discovery Libraries for Solids Based on QSAR Models, QSAR Comb. Sci. 24, 78-93.
10 Klanner C., Farrusseng D., Baumes L., Lengliz M., Mirodatos C., Schüth F. (2004) The Development of Descriptors for Solids: Teaching “Catalytic Intuition” to a Computer, Angew. Chem. Int. Ed. 43, 5347-5349.
11 Klanner C., Farrusseng D., Baumes L., Mirodatos C., Schuth F. (2003) How to Design Diverse Libraries of Solid Catalysts? QSAR Comb. Sci. 22, 729-736.
12 Farrusseng D. (2008) Surface Science Reports High-throughput Heterogeneous Catalysis, Surf. Sci. Rep. 63, 11, 487-513. 13 Baumes L.A., Collet P. (2009) Examination of genetic
program-ming paradigm for high-throughput experimentation and hetero-geneous catalysis, Comput. Mater. Sci. 45, 1, 27-40.
14 Schüth F., Baumes L., Clerc F., Demuth D., Farrusseng D., Llamas-galilea J. (2006) High throughput experimentation in oxidation catalysis: Higher integration and “intelligent” software, Catal. Today 117, 284-290.
15 Rodemerck B.U., Ignaszewski P., Lucas M., Claus P. (2000) Parallel Synthesis and Fast Catalytic Testing of Catalyst Libraries for Oxidation Reactions, Chem. Eng. Technol. 117, 413-416.
16 Buyevskaya O.V., Brückner A., Kondratenko E.V., Wolf D., Baerns M. (2001) Fundamental and combinatorial approaches in the search for and optimisation of catalytic materials for the oxidative dehydrogenation of propane to propene, Catal. Today 67, 369-378.
17 Tibiletti D., de Graaf E.A.B., Teh S.P., Rothenberg G., Farrusseng D., Mirodatos C. (2004) Selective CO oxidation in the presence of hydrogen: fast parallel screening and mechanistic studies on ceria-based catalysts, J. Catal. 225, 2, 489-497. 18 Claus P., Hönicke D., Zech T. (2001) Miniaturization of
screen-ing devices for the combinatorial development of heterogeneous catalysts, Catal. Today 67, 319-339.
19 Huybrechts W., Jacobs P.A., Martens J.A. (2003) Development of a fixed-bed continuous-flow high-throughput reactor for long-chain n-alkane hydroconversion, Appl. Catal. A: Gen. 243, 1-13. 20 Lucas M., Claus P. (2003) High throughput screening in
mono-lith reactors for total oxidation reactions, Appl. Catal. A: Gen. 254, 35-43.
21 Hoffmann C., Wolf A., Schüth F. (1999) Parallel Synthesis and Testing of Catalysts Conditions, Angew. Chem. Int. Ed. 38, 18, 2800-2803.
22 Beckers J., Gaudillère C., Farrusseng D., Rothenberg G. (2009) Marrying gas power and hydrogen energy: A catalytic system for combining methane conversion and hydrogen generation, Green Chem. 11, 9, 921-925.
23 Ras E.-J., Maisuls S., Haesakkers P., Gruter G.-J., Rothenberg G. (2009) Selective Hydrogenation of 5-Ethoxymethylfurfural over Alumina-Supported Heterogeneous Catalysts, Adv. Synth. Catal. 351, 18, 3175-3185.
24 Biniwale R.B., Yamashiro H., Ichikawa M. (2005) In situ infrared thermographic analysis during dehydrogenation of cyclohexane over carbon-supported Pt catalysts using spray-pulsed reactor, Catal. Lett. 102, 1-2, 23-31.
25 Brooks C., Cypes S., Grasselli R.K., Hagemeyer A., Hogan Z., Lesik A. (2006) High throughput discovery of CO oxidation / VOC combustion and water – gas shift catalysts for industrial multi-component streams, Topics Catal. 38, 1-3, 59-62. 26 Maier W.F., Olong N.E., Stöwe K. (2007) A combinatorial
approach for the discovery of low temperature soot oxidation catalysts, Appl. Catal. B: Env. 74, 19-25.
27 Biniwale R.B., Ichikawa M. (2007) Thermal imaging of catalyst surface during catalytic dehydrogenation of cyclohexane under spray-pulsed conditions, Chem. Eng. Sci. 62, 7370-7377. 28 Reetz M.T., Becker M.H., Kühling K.M., Holzwarth A. (1998)
Time-Resolved IR-Thermographic Detection and Screening of Enantioselectivity in Catalytic Reactions, Angew. Chem. Int. Ed. 37, 19, 2647-2650.
29 Cordi E.M., Falconer J.L. (1996) Oxidation of Volatile Organic Compounds on Al2O3, Pd/Al2O3and PdO/Al2O3Catalysts, J. Catal. 162, 104-117.
J. Jolly et al. / High Throughput Approach Applied to VOC Oxidation at Low Temperature 517
30 Cordi E.M., Falconer J.L. (1997) Oxidation of volatile organic compounds on a Ag/A12O3catalyst, Appl. Catal. A: Gen. 151, 179-191.
31 Papaefthimiou P., Ioannides T., Verykios E. (1997) Combustion of non-halogenated volatile organic compounds over group VIII metal catalysts, Appl. Catal. B: Env. 13, 175-184.
32 Cordi E.M., Peter J.O., Falconer J.L. (1997) Transient oxidation of volatile organic compounds on a CuO/A12O3catalyst, Appl. Catal. B: Env. 14, 23-36.
33 Perrichon V., Laachir A., Bergeret G., Frety R., Tournayan L. (1994) Reduction of Cerias with Different Textures by Hydrogen and their Reoxidation by Oxygen, J. Chem. Soc. Faraday Trans. 90, 5, 773-781.
34 Yao H.C., Yao Yu Y.F. (1984) Ceria in automotive exhaust cata-lysts: I. Oxygen storage, J. Catal. 86, 2, 254-265.
35 Sayle T.X. ., Parker S.C., Catlow C.R.A. (1994) The role of oxy-gen vacancies on ceria surfaces in the oxidation of carbon monoxide, Surface Sci. 316, 3, 329-336.
36 Bevan D.J.M. (1955) Ordered intermediate phases in the system CeO2/Ce2O3, J. Inorg. Nucl. Chem. 1, 1-2, 49-59.
37 Brunelle J.P. (1978) Preparation of catalysts by metallic complex adsorption on mineral oxides, Pure Appl. Chem. 50, 1211-1229. 38 Tribus M., Szonyi G. (1989) Quality Progress 22, 46.
39 Montgomery D.C., Mastrangelo C.M. (1991) Some statistical process control methods for autocorrelated data, J. Qual. Technol. 23, 179-193.
40 Thathagar M.B., Beckers J., Rothenberg G. (2003) Combinatorial Design of Copper-Based Mixed Nanoclusters: New Catalysts for Suzuki Cross-Coupling, Adv. Synth. Catal. 345, 8, 979-985.
41 Jolly J., Pavageau B., Guirardel M. (2011) WO 2011/070296 A1. 42 Iojoiu E.E., Bassou B., Guilhaume N., Farrusseng D., Desmartin-Chomel A., Lombaert K., Bianchi D, Mirodatos C. (2008) High-throughput approach to the catalytic combustion of Diesel soot, Catal. Today 137, 103-109.
43 Teschner D., Wootsch A., Roder T., Matusek K., Paal Z. (2001) Ceria as a new support of noble metal catalysts for hydrocarbon reactions: chemisorption and catalytic studies, Solid State Ion. 141-142, 709-713.
44 Pino L., Vita A., Cordaro M., Recupero V. (2003) A compara-tive study of Pt/CeO2catalysts for catalytic partial oxidation of methane to syngas for application in fuel cell electric vehicles, Appl. Catal. A: Gen. 243, 135-146.
45 Knell A., Barnickel P., Baiker A., Wokaun A. (1997) CO oxida-tion over Au/ZrO2catalysts: Activity, deactivation behavior and reaction mechanism, J. Catal. 137, 306-321.
46 Ivanova S., Petit C., Pitchon V. (2004) A new preparation method for the formation of gold nanoparticles on an oxide support, Appl. Catal. A: Gen. 267, 191-201.
47 Avgouropoulos G., Ioannides T. (2006) Effect of synthesis para-meters on catalytic properties of CuO-CeO2, Appl. Catal. B: Env. 67, 1-11.
48 Haruta M. (1997) Size- and support-dependency in the catalysis of gold, Catal. Today 36, 153-166.
49 Guzman J., Carrettin S., Corma A. (2005) Spectroscopic Evidence for the Supply of Reactive Oxygen during CO Oxidation Catalyzed by Gold Supported on Nanocrystalline CeO2, J. Am. Chem. Soc. 127, 10, 3286-3287.
50 Kondarides D.I., Verykios X.E. (1998) Effect of Chlorine on the Chemisorptive Properties of Rh/CeO2Catalysts Studied by XPS and Temperature Programmed Desorption Techniques, J. Catal. 174, 52-64.
51 Dominguez M.I., Sanchez M., Centeno M.A., Montes M., Odriozola J.A. (2007) 2-Propanol oxidation over gold supported catalysts coated ceramic foams prepared from stainless steel wastes, J. Mol. Catal. A: Chem. 277, 1-2, 145-154.
52 Mestl G. (2000) In situ Raman spectroscopy – a valuable tool to understand operating catalysts, J. Mol. Catal. A: Chem. 158, 45-65.
53 Shannon R.D., Prewitt C.T. (1969) Effective ionic radii in oxides and fluorides, Acta Crystallogr. B 25, 925-946.
54 Zhang F., Chan S.-W., Spanier J.E., Apak E., Jin Q., Robinson R.D., Herman I.P. (2002) Cerium oxide nanoparticles: Size-selective formation and structure analysis, Appl. Phys. Lett. 80, 1, 127-129.
55 Maher R.C., Cohen L.F., Lohsoontorn P., Brett D.J.L., Brandon N.P. (2008) Raman Spectroscopy as a Probe of Temperature and Oxidation State for Gadolinium-Doped Ceria Used in Solid Oxide Fuel Cells, J. Phys. Chem. A 112, 1497-1501.
56 Jolly J., Pavageau B., Tatibouët J.-M. (2011) Time-resolved IR thermographic detection of gaseous molecules adsorption on oxide supports, QIRT J. 8, 2, 129-137.
57 Jolly J., Pavageau B. (2011) WO 2011/070295 A1.
Final manuscript received in May 2012 Published online in March 2013
Copyright © 2013 IFP Energies nouvelles
Permission to make digital or hard copies of part or all of this work for personal or classroom use is granted without fee provided that copies are not made or distributed for profit or commercial advantage and that copies bear this notice and the full citation on the first page. Copyrights for components of this work owned by others than IFP Energies nouvelles must be honored. Abstracting with credit is permitted. To copy otherwise, to republish, to post on servers, or to redistribute to lists, requires prior specific permission and/or a fee: Request permission from Information Mission, IFP Energies nouvelles, fax. +33 1 47 52 70 96, or [email protected].