Early Warning of Patient Deterioration in the Inpatient
Setting
by
Gregory Alan Ciccarelli
B.S., Electrical Engineering, The Pennsylvania State University, 2009
Submitted to the Department of Electrical Engineering and Computer Science in partial fulfillment of the requirements for the degree of
Master of Science
in Electrical Engineering and Computer Science at the Massachusetts Institute of Technology
February 2013
@
2013 Massachusetts Institute of Technology All Rights Reserved.Signature of Author:
Department of Electrical Engineering and Computer Science January 18, 2013 Certified by:
Thomas Heldt Principal Research Scientist Thesis Supervisor Certified by:
George C. Verghese Henry Ellis Warren Professor Professor of Electrical and Biomedical Engineering Thesis Supervisor
Accepted by:
Leslie A. Kolodziejski Professor of Electrical Engineering and Computer Science Chair, Committee for Graduate Students
ARCIHIVES
Early Warning of Patient Deterioration in the Inpatient Setting by Gregory Alan Ciccarelli
Submitted to the Department of Electrical Engineering and Computer Science on January 18, 2013, in partial fulfillment of the requirements for the degree of
Master of Science
Abstract
Early signs of patient deterioration have been documented in the medical literature. Recognition of such signs offers the possibility of treatment with sufficient lead time to prevent irreversible organ damage and death. Pediatric hospitals currently utilize simple, human evaluated rubrics called early warning scores to detect early signs of patient deterioration. These scores comprise subjective (patient behavior, clinician's impression) and objective (vital signs) components to assess patient health and are computed intermittently by the nursing staff. At Boston Children's Hospital (BCH), early warning scores are evaluated at least every four hours for each patient.
Many hospitals monitor inpatients continuously to alert caregivers to changes in physiological status. At BCH, each hospital bed is equipped with a bedside monitor that continuously collects and archives vital sign data, such as heart rate, respiration rate, and arterial oxygen saturation. Continuous access to these physiological variables allows for the definition of a continuously evaluated early warning score on a reduced rubric.
This thesis quantitatively assesses the performance of BCH's current Children's Hos-pital Early Warning Score (CHEWS). We also apply several standard machine learning approaches to investigate the utility of automatically collected bedside monitoring trend data for prediction of patient deterioration. Our results suggest that CHEWS offers at least a 6-hour warning with sensitivity 0.78 and specificity 0.90 but only with a prohibitively large uncertainty (48 hours) surrounding the time of transfer. Perfor-mance using only standard bedside trend data is no better than chance; improvement may require exploiting additional intra-beat features of monitored waveforms. The full CHEWS appears to capture significant clinical features that are not present in the monitoring data used in this study.
Thesis Supervisor: Thomas Heldt Title: Principal Research Scientist Thesis Supervisor: George C. Verghese Title: Henry Ellis Warren Professor
Professor of Electrical and Biomedical Engineering
Acknowledgments
This thesis is the product of contributions from many individuals, each of whom has been crucial to shaping its final form. Each has earned my gratitude and deserves recognition.
Thomas Heldt, my primary research supervisor, for his patience, support, and guidance.
George Verghese, for pushing me to never compromise on clarity and his eye for detail.
BCH collaborators, especially Drs. Monica Kleinman and Paul Hickey, Christine Dube, Justine Bode, and Rachel Dabek, for their clinical perspective and responsiveness to my questions.
Steve Kogon, Dan Rabideau, Jenn Watson, and the Lincoln Scholars committee, for encouraging and enabling intellectual growth.
The Computational Physiology and Clinical Inference group, especially Sho Chaudhuri and Becky Asher, for productive discussions and proof reading.
Parents and family members, for their support, confidence, and unconditional love throughout this thesis and my life.
Mary, Queen of Saints, for interceding before God in order that I may have been granted the grace of perseverance to see this thesis through to its conclusion, and God, for granting that grace.
This work is sponsored by AFLCMC/PZE under Air Force Contract FA8721-05-C-0002. Opinions, interpretations, conclusions and recommendations are those of the authors and are not necessarily endorsed by the United States Government. This work has also been sponsored in part by the Children's Hospital Anesthesia Foundation, Boston Children's Hospital.
Contents
Abstract 3
Acknowledgments 5
List of Figures 11
List of Tables 13
1 Pediatric Early Warning Scores 15
1.1 Project Background and Problem Statement ... 16
1.1.1 Medical Need ... 16
1.1.2 Early Warning Scores . . . . 17
1.1.3 Multivariate Bedside Data . . . . 19
1.1.4 Sensor Fusion . . . . 22
1.1.5 Problem Statement . . . . 23
1.2 Thesis Contributions . . . . 24
1.3 Thesis Organization . . . . 25
2 Vital Signs and Research Database 27 2.1 BCH-MIT Collaboration . . . . 27
2.1.1 Thesis-Specific Data . . . . 28
2.2 Vital Signs: A Closer Look . . . . 33
2.2.1 Heart Rate . . . . 33 2.2.2 Respiration Rate . . . . 34 2.2.3 Blood Oxygenation . . . . 36 2.2.4 Blood Pressure . . . . 38 2.2.5 Temperature . . . . 39 2.3 Physiological Models . . . . 39
2.4 Physiology of Cardiopulmonary Decompensation . . . . 42
2.4.1 Respiratory Distress and Failure . . . . 43
2.4.2 Sepsis . . . . 44
2.5 General Observations on Feature Rubrics . . . . 45
8 CONTENTS 3 Data Exploration
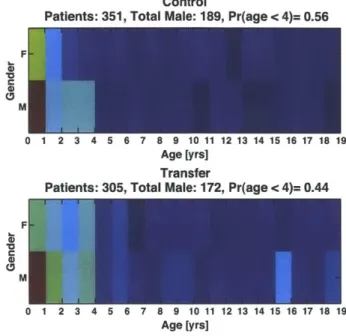
3.1 Transfer Population . . . . 3.2 Transfer Reason and Call Type
3.3 CHEWS Distribution vs. Time
3.4 CHEWS Transition Probabilities 3.5 CHEWS Underscoring . . . . 3.6 Measurement Frequency . . . . 3.7 Vital Sign Trajectories . . . . 3.8 Bisected Changes Over Time . . . 3.9 Human Classification Performance 3.10 Data Exploration Summary . . . .
4 Classification and Prediction
4.1 Feature Selection . . . . 4.2 Decision Rules . . . . 4.2.1 MAP Rule . . . . 4.2.2 Support Vector Machines . . . . 4.2.3 Decision Rule Complexity . . . . 4.3 CHEWS and rCHEWS Classification . . . . 4.3.1 MAP Classification . . . . 4.3.2 SVM Classification . . . . 4.3.3 rCHEWS Classification Method . . . . 4.3.4 Classification Results . . . . 4.4 The Prediction Problem . . . . 4.4.1 Data Window, Uncertainty Window, and Observation Window 4.4.2 Literature Survey . . . . 4.4.3 The ROC with UW and WT . . . . 4.4.4 ROC Calculation . . . . 4.4.5 ROC Discussion . . . . 4.4.6 Understanding Published Results with UW and WT . . . . 4.5 CHEWS and rCHEWS Prediction . . . . 4.5.1 SVM Training for Prediction . . . . 4.5.2 Evaluation Method . . . . 4.5.3 Prediction Results . . . . 4.6 Sum m ary . . . . 5 Modified rCHEWS
5.1 BCH Age-Normalized Trend Data 5.2 Resampling and SVM Retraining 5.3 The Misclassified Misfits . . . . 5.4 Using Age . . . . 5.5 Custom Features . . . . 49 49 52 54 56 58 61 62 64 70 73 75 76 77 78 80 84 85 86 87 87 88 90 91 94 98 100 104 108 113 113 114 115 117 119 119 124 127 128 128 8 CONTENTS
CONTENTS 9
6 Conclusion and Future Work 133
A Classification Self Test 139
CONTENTS
List of
Figures
1.1 Typical bedside monitoring data. . . . . 21 2.1 BCH Children's Hospital Early Warning Score algorithm. . . . . 31
BCH normal vital sign ranges. . . . . Standard ECG features. . . . . ECG with the derived heart rate. . . . . Oxygen hemoglobin disassociation curve. . . . . Arterial blood pressure waveform .. . . . . Windkessel model of the heart. . . . . Respiration rate from plethysmogram. . . . . Study population gender comparison. . . . . BCH control population by age over 12 months.. BCH transfer population by age over 12 months. Control and transfer male to female ratios by age. Transfer reason vs. call type . . . . Transfer patient mean time until transfer after first Control: mean score vs. time . . . . Transfer: mean score vs. time . . . . Control: score distributions vs. time . . . . Transfer: score distributions vs. time . . . . Control: selected score distributions vs time . . . . Transfer: selected score distributions vs. time . . . Mean CHEWS and
+/
- 1 standard deviation for patients. . . . . Transition probability: control patients. . . . . Transition probability: transfer patients. . . . . Control: CHEWS score evaluation frequency . . . Transfer: CHEWS score evaluation frequency . . . Decompensating transfer patient. . . . . Stable control patient. . . . .. . . . . . . . . . . . . . . . . . . . . . . . . . . . . . . . . . . . . . . . . . . . threshold crossing.
control and transfer
2.2 2.3 2.4 2.5 2.6 2.7 2.8 3.1 3.2 3.3 3.4 3.5 3.6 3.7 3.8 3.9 3.10 3.11 3.12 3.13 3.14 3.15 3.16 3.17 3.18 3.19 32 35 35 37 39 40 42 50 51 52 53 54 55 57 57 57 57 58 58 59 60 60 62 62 63 65 11
12 LIST OF FIGURES 3.20 3.21 3.22 3.23 3.24 3.25 3.26 4.1 4.2 4.3 4.4 4.5 4.6
Unstable control patient . . . . 66
Heart rate changes over time. . . . . 67
Respiration rate changes over time. . . . . 68
SpO
2 changes over time. . . . . 69Self test performance by evaluator. . . . . 71
Self test performance by patient. . . . . 71
Justification key words . . . . 72
Decision rule examples. . . . . 78
SVM rule example. . . . . 80
SVM quadratic kernel example. . . . . 83
Notional simple and complex decision rules. . . . . 84
WT and UW relative to threshold crossing. . . . . 92
Observation window with non-zero warning time. . . . . 93 4.7 Different threshold-crossing time-points with the same sensitivity. . . . . 4.8 Different threshold-crossing time-points with the same sensitivity, WT=0. 4.9 Generic ROC heat map. . . . . 4.10 Examples of correct detection of need to transfer. . . . . 4.11 Relationship of small and large UW with specificity for ROCv2. . . . . . 4.12 Algorithm sensitivity comparison under ROCv2. . . . . 4.13 ROCv2 heat map for OW=24 hours. . . . . 4.14 ROCv2 heat map for OW=48 hours. . . . . 5.1 BCH age-normalized AUC pt HR . . . . 5.2 BCH age-normalized AUC pt RR . . . . 5.3 BCH age-normalized respiration rate: overlap . . . . 5.4 BCH age-normalized heart rate and respiration rate used jointly for
pre-diction. . . . . 5.5 BCH age-normalized heart rate and respiration rate with resampling used
jointly for classification . . . . 5.6 Heart rate and respiration as vital signs, Gaussian normalized values,
age is used as a feature. . . . . 95 97 99 103 105 107 110 112 121 121 122 124 125 129 12 LIST OF FIGURES
List of Tables
1.1 Example pediatric early warning score (PEWS) rubric. . . . . 18
2.1 BCH mapping from age group name to age bracket in years. . . . . 33
3.1 CHEWS underscoring phenomenon . . . . 61
4.1 MAP and SVM classification with WT=O hours. . . . . 89
4.2 MAP and SVM classification with WT=6 hours. . . . . 89
4.3 Selected ROC Notation . . . 100
4.4 ROC performance from literature as well as ROCv2 results ("mimic") using BCH CHEWS scores. . . . .111
4.5 CHEWS prediction summary . . . 116
4.6 rCHEWS prediction summary . . . 116
5.1 Custom Feature Classification Performance via SVM . . . 131
Chapter 1
Pediatric Early Warning Scores
Patients admitted to the regular hospital ward or floor for observation or treatment commonly have a small number of physiological signals monitored continuously as part of their care. While the vast majority of these patients improve, a small subset might ex-perience adverse events that necessitate transfer of the patient to a higher level of care, usually an intensive care unit (ICU). The question then naturally arises whether the transfer could have been predicted and consequently prevented, or carried out sooner. To help in the identification of patients at risk of acute physiological deterioration, clini-cians have developed early warning scores that summarize, in a single number, the state of various organ systems. While useful, these scores still rely on intermittent human assessment of each patient. This thesis (i) quantitatively assesses the performance of a pediatric early warning score in use at a collaborating hospital, and (ii) investigates to what extent the continuously recorded physiological signals can be fused to aid in the
automatic identification of the patient at risk of transfer to the ICU.
Section 1.1 describes the context and goals for this thesis. Section 1.2 outlines the thesis's contributions, and Section 1.3 describes the organization of the remaining chapters.
16 CHAPTER 1. PEDIATRIC EARLY WARNING SCORES
0
1.1 Project Background and Problem Statement
To motivate this thesis and provide context for its contributions, Section 1.1.1 discusses the current medical need for early warning scores, and Section 1.1.2 reviews the current literature. Sections 1.1.3 and 1.1.4 summarize the data available for automatic trans-fer prediction and how that data can be processed. Section 1.1.5 defines the specific problem addressed by this thesis.
* 1.1.1 Medical Need
Physiological decompensation is a state in which the body can no longer maintain home-ostasis [1]. It can result from a variety of circumstances, such as strenuous exercise or disease progression. Studies have shown that decompensation or adverse events due to disease progression are associated with lower survival [2]. However, such decompensa-tion might be predicted. For example, early signs of cardiac arrest [3] or the need for transfer to the ICU have been reported [4-6]. Such prediction can enable more timely
and effective clinical intervention.
A study by McQuillan et al. observed that 39% of ward patients requiring transfer to the ICU were transferred late, and that suboptimal care definitely contributed to increased morbidity and mortality in 32.5% of the transfer patients [5]. Similar trends were identified in another study [4]. Therefore, if a patient is going to enter a decompen-satory state, it would be best if the patient did so while in the ICU, where appropriate support and a higher level of care are immediately available. McQuillan et al. also observed that some transfers could have been prevented completely if appropriate ac-tion had been taken ahead of the transfer [5]. This is of note because among patients transferred from the wards to the ICU, the emergency department, the operating room, or the recovery room, patients transferred from the wards were most likely to die [7].
nec-Sec. 1.1. Project Background and Problem Statement 17 essary, it may be even better to anticipate or identify a decompensatory event with sufficient lead time so its occurrence can be averted altogether. This is because ICUs themselves can be dangerous environments, perhaps because of the complexity and in-vasiveness of the interventions. Between 11.9% and 19% of patients in a pediatric ICU (PICU) have been shown to develop infections, especially of the blood stream [8,9]. A survey of 220 ICUs across twenty-nine nations found significant ICU errors at a rate of 38.8 events per 100 patient days. These errors included incorrect or inappropriate medication, equipment failures, and inappropriate monitor alarm silencing [10]. Turn-ing off alarms stems from alarm fatigue due to the abundance and frequency of monitor alarms. Vendors have erred on the side of high sensitivity at the cost of low specificity, which is borne out by less than 1% of alarms resulting in a change in patient care [11].
A further need for early identification of impending decompensation is to prevent irreversible end-organ damage. Nguyen et al. have concluded that "[t]he care provided during the [emergency department] stay for critically ill patients significantly impacts the progression of organ failure and mortality. Although this period is brief compared with the total length of hospitalization, physiologic determinants of outcome may be established before ICU admission" [12]. Early goal-directed therapy (EGDT) has also been advocated, especially for sepsis management, by Rivers et al.. They showed a decrease of in-hospital mortality for patients with severe sepsis and septic shock when EGDT was implemented [13].
0 1.1.2 Early Warning Scores
Because adverse events do have warning signatures, investigators have promoted clinical decision making aids, called Early Warning Scores (EWS), to ensure care keeps pace with patient condition [14]. The scores are a quantitative method for monitoring a patient's condition and appropriately escalating care if conditions worsen. They are an
Table 1.1: Pediatric early warning score (PEWS) rubric from Royal Alexandra Chil-dren's Hospital, Brighton, UK [15].
System Subscore 0 1 2 3
Behavior Playing/ appro- Sleeping Irritable Lethargic or
con-priate fused. Reduced
re-sponse to pain. Cardiovascular Pink or capillary Pale or capillary re- Grey or capillary Grey and mottled
refill 1-2 seconds fill 3 seconds refill 4 seconds. or capillary refill 5 Tachycardia of 20 seconds or above. above normal rate Tachycardia of 30 above normal rate or bradycardia Respiratory Within normal >10 above normal >20 above normal 5 below normal
parameters, no parameters, using parameters, recess- parameters with recession or accessory muscles, ing tracheal tug, sternal recession, tracheal tug 30+% FiO2 or 4+ 40+% FiO2 or 6+ tracheal tug or
L/min L/min grunting, 50+%
FiO2 or 8+ L/min Score 2 extras for 1/4 hourly nebulisers or persistent vomiting following surgery
example of high-level information fusion.
Pediatric early warning scores (PEWS) are a relatively recent invention and can vary in complexity [15, 16]. Like EWS rubrics, PEWS evaluate the patient in three categories: cardiovascular health, respiratory health, and neurological health. The information feeding into the categories includes vital signs such as heart rate, blood pressure, oxygenation, respiratory rate, and temperature, as well as an assessment of behavior and alertness. Fundamentally, PEWS and EWS are the same, with the only significant difference being the age-adapted ranges of normal vital signs. Deviations of the vital signs from normative values are scored based on severity, and category scores are summed to create a total score. The total score determines a particular action, such as continued four-hour assessment, increased frequency of assessment, evaluation for transfer, or immediate transfer to the PICU [17]. An example of a PEWS rubric is shown in Table 1.1.
PEWS have become widely implemented and show signs of success. A retrospective study found that 85.5% of patients transferred to the PICU showed a critical score at
Sec. 1.1. Project Background and Problem Statement 19
a median time of 11 hours and 36 minutes before transfer [18]. Duncan used a twenty-feature PEWS card specifically for identifying children in danger of cardiopulmonary arrest [161. The rubric identified such children one hour prior to an event with a sensitivity of 78% and specificity of 95%. These lead times offer strong promise for the utility of PEWS. However, a recent PEWS review paper argues that there exists a shortage of rigorous validation for many of the proposed algorithms. Furthermore, the authors argue that clincially useful tools must be simple, with low inter- and intra-user variability [17]. Nonetheless, several studies have found that aggressive care for at-risk pediatric patients, identified through some mixture of physiological indicators, can positively impact patients by reducing respiratory and cardiac code (i.e., emergency) rates and mortality on the general ward [19-21], and ICU mortality [22].
Various hospitals have either directly adopted PEWS algorithms published in the literature or adopted them with variations. These include Children's Hospital of Denver, Children's Hospital of Orange County, and Boston Children's Hospital (BCH). The BCH early warning score (CHEWS score) is especially relevant to this thesis because of the MIT-BCH collaboration that supports this research.
E 1.1.3 Multivariate Bedside Data
Prior to the early 1900s, bedside monitoring consisted of taking a patient's temperature and heart rate at regular intervals [23]. Gradually, the importance of charting these measurements over time as well as adding a quantifiable blood pressure measurement to the list became recognized. Today, the common vital signs are heart rate, temperature, blood pressure, respiration rate, and arterial oxygen saturation, many of which are monitored continuously in the hospital setting.
Bedside monitors aid in quantifying and tracking patient condition. They are preva-lent on the general floor, in the ICU, and in the operating room. A multitude of devices
20 CHAPTER 1. PEDIATRIC EARLY WARNING SCORES
that measure vital signs are plugged into the bedside monitor. In addition to tem-perature and blood pressure sensors, the electrocardiogram (ECG) and pulse oximeter are routinely employed. On the wards, the continuously-monitored vital signs that are most frequently available are heart rate, respiration rate, and arterial oxygen satura-tion. Temperature and blood pressure are assessed periodically, approximately every four hours.
The ECG is a voltage-versus-time waveform that characterizes the electrical activity of the heart, and is commonly used to calculate the heart rate. The respiration rate can also be derived from the ECG leads through measurements of the associated variation in transthoracic impedance, or through analysis of the ECG waveform itself, because the waveform is modulated by respiration [24].
The pulse oximeter primarily measures the relative amount of oxygen bound to hemoglobin, to determine arterial blood oxygenation (SpO2). The spectroscopy under-lying the pulse oximeter's function requires measuring the change in blood volume at the site of interest, for example a finger, which creates the pulse plethysmogram (PPG) waveform. This waveform can also be used to derive pulse rate and respiration rate [25]. Through the integration of the bedside monitors to a central server, the data from a dozen to two-dozen patient monitors is streamed to a central nursing station for continuous observation. The logged waveforms become part of the patient's medical record for review by clinicians.
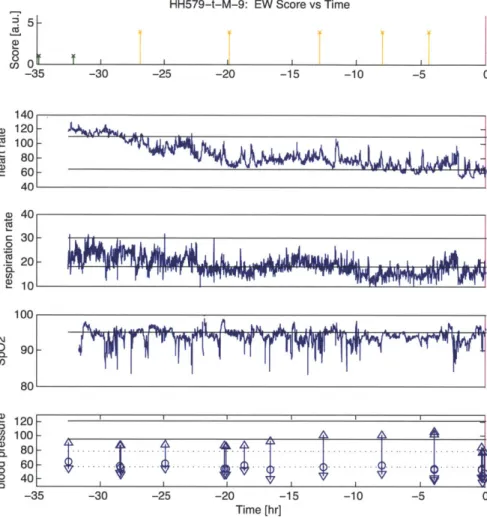
Example vital sign data from a nine-year-old male patient and associated CHEWS scores are shown in Figure 1.1. (Chapter 2 discusses interpreting the data in this figure with respect to the prediction problem.) Data is referenced to the call time at time 0 in all subplots. Call time is the time at which the decision for transfer from the general ward to the ICU is made (magenta line). The first subplot shows the CHEWS score as documented by BCH clinicians and color coded by severity. A CHEWS score between
HH579-t-M-9: EW Score vs Time -30 -25 -20 -15 -10 -5 0 a> 0% a) 40 S30-2 10 -100 80 ,D 0 120- S100-0 6 0 I -35 -30 -25 -20 -15 -10 -5 0 Time [hr]
Figure 1.1: Patient HH579. CHEWS scores and vital signs of a nine-year-old male patient on the general floor. Units for the subplots are respectively: arbitrary units, beats per minute, breaths per minute, oxygen hemoglobin saturation percentage, and millimeters mercury.
22 CHAPTER 1. PEDIATRIC EARLY WARNING SCORES
zero and two (green) denotes a stable patient; a score of three (yellow) or four (orange) indicates a patient who warrants either increased monitoring or possible evaluation for transfer to the ICU. A score greater than or equal to five (red) demands immediate transfer to the ICU. The other four subplots show the trends of heart rate, respiration rate, blood oxygenation, and intermittent blood pressure measurements. Data colored blue come from a general ward monitor, and data colored green (not shown in Figure 1.1) come from an ICU monitor. Data colored blue may persist after the call time because the patient was not transferred immediately to the ICU. Each blood pressure measurement has three values: the top and bottom triangles represent the systolic and diastolic pressure, and the circle represents the mean. Thin horizontal black lines represent the upper and lower ranges of normal physiological values for the patient's age and gender, as specified by BCH. For blood pressure in particular, the solid black lines represent the normal systolic range, and the dashed black lines represent the normal diastolic range.
0 1.1.4 Sensor Fusion
Bedside monitoring produces plentiful and diverse data, providing an ideal opportunity for sensor fusion of this data to characterize the patient. Sensor fusion is a process in which information from multiple sources is merged in order to infer characteristics of the object of interest. Sensor fusion can yield improved parameter estimation through the use of redundant measurements. Furthermore, it can offer a more complete picture as some sensors can provide information about the object of interest that others cannot provide. However, some of the advantages of sensor fusion may also be among its weak points. It is possible to corrupt "good data" with "bad data", and to formulate erroneous conclusions unless the combining framework is systematic and robust [26].
Sec. 1.1. Project Background and Problem Statement 23 actionable intelligence. Lower-level processing may analyze the raw signals separately to detect bad data, extract relevant features, or make simple logic-based decisions. Low-level features include general linear trends or abrupt departures from previous history. High-level processing considers the data jointly to extract features and to make decisions. Joint feature extraction or decision making is the first form of sensor fusion. A fusion step may use physical models that relate two or more processes to derive features, or it may look at the numerical behavior of the data such as the cross-correlation between the two processes. Both individual and joint features and decisions may then be combined at the highest level of processing to determine decisions through neural networks, Bayesian inference, or Dempster-Schafer theory, for example [26].
0
1.1.5 Problem Statement
Unfortunately, the benefits from a data-centric environment that leverages sensor fusion have not been fully realized on the general ward. The monitors themselves may at most trigger an alarm if a particular vital sign crosses a simple threshold [27,28]. The many signal feeds at the central nursing station can be overwhelming to the one or two nurses trying to convert the stream of raw data into clinically actionable decisions. In practice, clinicians may only use five-minute windows of the data in addition to their own qualitative observations when they stop to check on the patient.
This scenario highlights several problems. First, despite continuous, real-time mon-itoring of the patient, the data is only used when clinical staff are physically present to assess the patient. The data that is used therefore only comprises a small snapshot of the total. For a stable patient at BCH, CHEWS assessments are done approximately every four hours. Therefore, much data may never be utilized. Such infrequent hu-man monitoring may have been a significant cause of why an Australian study failed to find benefit in adult EWS in reducing unexpected death, cardiopulmonary arrests,
and unplanned ICU admissions [29].
Second, there is little or no interaction among the alarm algorithms for different vital signs. For example, if a blood pressure reading drops to zero, an alarm might trigger even though the patient's ECG shows a normal heart beat.
Third, pediatric early warning score algorithms rely in part on subjective assess-ment of patient health, for example skin tone, so significant inter- and intra-clinician variability is possible. Last, some algorithms simply rely on deviations from normality, where normality is defined by an average over a group of patients. These algorithms offer little insight into a patient's specific physiological condition and could be based on derived parameters that have little if any obvious connection to a patient's health [30], making concrete intervention by the clinical staff difficult.
This thesis explores two questions. First, what is the utility of the current BCH CHEWS score? Second, to what extent can continuously acquired and streamed phys-iologic data from the patient's bedside be used to improve predictions of the need for escalation of care and transfer of the patient to the ICU? The second question focuses on the standard, continuously monitored vital signs of heart rate, respiratory rate, blood oxygenation, and intermittently measured blood pressure. We seek to understand what lead times might be achieved such that the medical staff can take preventative action, so the patient does not need to be transferred to the ICU, or is transferred in a timely manner.
0 1.2 Thesis Contributions
This thesis makes three contributions. First, this thesis provides a thorough investi-gation of the BCH CHEWS score for monitoring patient health. Second, this thesis introduces a rigorous, clinically meaningful prediction metric that is lacking in the pe-diatric EWS literature. Third, this thesis uses this metric to benchmark the CHEWS
Sec. 1.3. Thesis Organization 25 predictive ability and the predictive ability of the stand-alone bedside monitoring data.
0 1.3 Thesis Organization
Chapter 2 continues discussing the basics of the relevant physiological variables avail-able for analysis, and introduces the data set under investigation. Chapter 3 describes data mining results and lays out performance benchmarks for subsequent algorithms. Chapter 4 introduces a prediction metric and compares current BCH CHEWS perfor-mance with an automated version of the BCH CHEWS algorithm on a reduced data set. Chapter 5 proposes and evaluates several modifications to the BCH CHEWS algorithm that exploit bedside monitoring data. Chapter 6 closes with a summary of this work and discusses future directions for pediatric physiological monitoring research.
Chapter 2
Vital Signs and Research Database
This thesis was done in collaboration with Boston Children's Hospital (BCH), which provided the vital signs from a subset of all patients treated over the last three years. This chapter will describe physiological models that underly these vital signs, the phys-iology captured by them, and their pathophysiological changes present under cardiopul-monary decompensation.
Section 2.1 begins with an overview of the BCH-MIT collaboration and continues with a description of the thesis data set. Section 2.2 describes in detail the vital signs available for decision making. Section 2.3 introduces several physiological models and parameters which are referenced in later chapters. Section 2.4 describes the mechanics of cardiopulmonary decompensation from respiratory distress and sepsis, which are two common causes for transfer to the ICU. Section 2.5 concludes this chapter with general observations on current early warning score (EWS) rubrics.
* 2.1 BCH-MIT Collaboration
In January 2010, a project began that laid the groundwork for the use of continuously monitored general ward data for improving early warning systems. It was a collabora-tion between the Department of Anesthesia, Critical Care, and Pain Medicine at Boston Children's Hospital (BCH) and the Computational Physiology and Clinical Inference (CPCI) group at MIT's Research Laboratory of Electronics. BCH is a tertiary care
28 CHAPTER 2. VITAL SIGNS AND RESEARCH DATABASE facility that has over 300 patient beds and specializes in treating children and even some adults if their primary condition is from childhood or development.
BCH offers an ideal opportunity for exploring the utility of long-term, frequently sampled vital signs because all of the patient beds are equipped with bedside monitors (Philips Healthcare), and the data from all bedside monitors are archived for retrospec-tive analysis. These monitors sample and digitally archive various patient vital signs as part of standard care. Specifically, the monitors usually collect three types of data: waveform data, trend data, and alarm data.
Waveform data include electrocardiogram (ECG) and pulse plethysmogram (PPG) signals sampled at 125 Hz. The waveform data are processed into trend data by Philips's algorithms. Trend data include the heart rate (HR) and respiratory rate (RR). Both are derived from the ECG and are output once per minute and possibly averaged over a longer duration. The blood oxygen saturation (SpO2) and pulse rate are derived from the PPG. In the regular hospital rooms, blood pressure is measured intermittently, usually on the order of once every several hours, by an arm cuff using the oscillometric method. Alarm data consist of the alarms generated by Philips' algorithms. These alarms are typically based on simple threshold crossings of the waveform or trend data. For example, if heart rate crosses a pre-set upper bound, an alarm for tachycardia may sound.
0 2.1.1 Thesis-Specific Data
The Philips data is logged and time-synchronized in a proprietary Philips format called the Research Data Export (RDE) format. To convert the RDE data into a format for algorithm development, Philips supplies a data viewer with data export capabilities. Furthermore, a converter was developed at MIT that reformats RDE data into waveform database (WFDB) format [24]. WFDB is an open-source format used for over twenty
Sec. 2.1. BCH-MIT Collaboration 29
years by universities around the world as a way of interacting with a large database of physiological signals, PhysioNet, which is hosted by MIT [24]. Using an additional converter from PhysioNet, the WFDB data was converted to a Matlab file format to allow algorithm development on the Matlab computing software (Version 2011b) [31].
In addition to de-identified patient RDE data, clinical researchers also provide rele-vant patient meta-data such as the patient's age, gender, height, weight, clinical notes,
call time, and Children's Hospital Early Warning Score (CHEWS). CHEWS is the BCH
early warning score. The call time is the time at which the decision for transfer from the general ward to the ICU is made. The call time is an essential piece of clinical data because it acts as the fiduciary marker against which any predictive algorithm will need to be evaluated.
Because this thesis concerns data from real patients, a plan for data use, handling, and storage needed to be approved by the Institutional Review Boards at BCH and MIT to ensure that patient safety and patient health information were properly protected. De-identification of the patient data was accomplished at BCH. Data storage of de-identified data for patients is on MIT campus computers, though original copies of patient records also remain stored on BCH servers. Data for this project dates back to August 2010, when previous CPCI group members worked through initial data logistics and format conversion.
The required thesis data concerns two groups of patients: those patients on the general ward who are ultimately transferred to the ICU (the 'transfer' patients), and those patients who are not transferred (the 'control' patients). Each month, about 30-40 transfers from the general floor to the ICU occur at BCH, so potentially this many patients could be added to the project data base each month.
Unfortunately, this potential pool of hundreds of patients per year is not realized. The potential pool is shrunk by several factors. The first and most common reason is
30 CHAPTER 2. VITAL SIGNS AND RESEARCH DATABASE
the quality of the recorded data itself. The core trend data set (HR, RR, SpO2, and blood pressure) is already an impoverished data set of physiological indicators, so if one or more of these channels is missing, the data record is critically reduced. Also, some patients have less than ten hours of data. We excluded them because we hoped to predict six hours ahead of the transfer which would mean we would have less than four hours of data with which to do the prediction. Poor data quality accounts for over 50% of the patient data sets that are unusable. The second reason is a lack of a call date and time. Because the call time is the fiduciary marker, algorithm performance cannot be assessed without it. Call time is missing in approximately 17% of the patients, irrespective of whether the data quality is acceptable. Finally, we limited our study to patients <18 years of age, so older transfer patients were excluded. However, older patients represented only a small fraction of all transfers.
With data collected over October 2010 to March 2012, approximately 50 transfer patients and 50 control patients have good trend data and the required meta data for analysis. However, certain investigations only require the meta data itself, and that allows analysis of a larger set of over 200 transfer patients and 200 control patients.
BCH also provided their CHEWS scoring algorithm pictured in Figure 2.1. The CHEWS algorithm was an essential piece of knowledge because it provided a starting point for automated algorithms and an opportunity to benchmark algorithms that only operate on a subset of the vital-sign data. A significant challenge with pediatric early warning score systems is the age dependence of normal vital signs. Application of the CHEWS rubric as well as other published pediatric scores hinges upon an auxiliary table that lists age-appropriate normal values. BCH provided their table, which is reproduced in Figure 2.2. Table 2.1 lists the age ranges associated with each age category.
The normal vital sign ranges were determined from a literature survey by BCH. The ranges are similar to those used in other pediatric early warning scores. The
Children's Hospital Boston
Children's Hospital Early Warning Score
0 1 2 3 Score
Behavior/Neuro * Playing/sleeping * Sleepy, somnolent when not * Irritable, difficult to console * Lethargic, confused, floppy appropriately disturbed * Increase in patient baseline seizure * Reduced response to pain
* Alert at patient activity * Prolonged or frequent seizures
baseline * Pupils asymmetric or sluggish
Cardiovascular * Skin tone * Pale * Grey * Grey and mottled
appropriate for * Capillary refill 3-4 seconds * Capillary refill 4-5 seconds * Capillary refill >5 seconds patient * Mild* tachycardia * Moderate* tachycardia * Severe* tachycardia * Capillary refill * Intermittent ectopy or * New onset bradycardia
5 2 seconds irregular heart rhythm (not * New onset/increase in ectopy,
new) irregular heart rhythm or heart block
Respiratory * Within normal ' Mild* tachypnea/ * Moderate* tachypnea * Severe* tachypnea
parameters * Mild increased WOB (flaring, * Moderate increased WOB (flaring, * RR below normal for age* * No retractions retracting) retracting, grunting, use of * Severe increased WOB (i.e. head
* Up to 40% supplemental accessory muscles) bobbing, paradoxical breathing) oxygen via mask * 40-60 % oxygen via mask * >60 % oxygen via mask
* Up to IL NC > patient * 1-2 L NC > patient baseline need * > 2 L NC > patient baseline need
baseline need * Nebs q 1-2 hr * Nebs q 30 minutes -I hr * Mild* desaturation (< 5 below * Moderate* desaturation (< 10 below * Severe* desaturaon (<15 below
Reiry Ran d O 10% 4 for age 25%
+
for age 5%9
for ageToddler and Older
210%
+ for age 225% + for age 50% + for ageDesaturation from patient baseline 02 saturation All ages 5 points 10 points 15 points
E-g irg- Rd> Rd
C Children's Hospital, Boston, 2011
CHEWS Heart Rate and Respiratory
Rate Reference Tool
0Heart Rates for Children and Adults
Age Nonnal Heart Norml Heart
Rates when Rats When
Awake (permin) W lepng (per Win)
Neonate (full-term) 100-180 176 184 200 80-160 176 184 200 Infant (6 mo) 100-160 176 184 200 75-160 176 184 200 Toddler 80-110 121 137 165 60-90 99 112 135 Pro-School 70-110 121 137 165 60-90 99 112 135 School-Age 65-110 121 137 165 60-90 99 112 135 Adolescent 60-90 99 112 135 50-90 99 112 135 Adult 55-90 99 112 135 50-90 99 112 135
Respiratory Rates for Children and Adults
Age Nonal Respiratry Rat
(per minute) Neonate (full-term) 30-60 66 69 75 Infant (6 mo) 30-60 66 69 75 Toddler 24-40 44 50 60 Pre-School 22-34 37 42 51 School-Age 18-30 33 37 45 Adolescent 12-16 117 20 124 Adult 12-16 17 20 24
Respiratory Rate and Heart Rate Infant | 10% + for age > 15% + for age 25% $for age
Toddler and Older 10% + for age 25% $ for age 50% +forage
Desaturation from patient's baseline 02 saturation All ages 5 points 10 points 15 points
@Children's Hospital, Boston, 2012 All rights reserved 9 Publication Date 09/02/10
Page 1 of I
Sec. 2.2. Vital Signs: A Closer Look 33
Table 2.1: BCH mapping from age group name to age bracket in years. Age Category Lower Bound [yrs] Upper Bound [yrs]
Neonate 0 0.82 Infant 0.82 2 Toddler 2 4 Pre-School 4 6 School-Age 6 12 Adolescent 12 18
interaction of the age-based vital signs and the CHEWS score can lead to substantial scoring swings if ranges are strictly followed. For example, if a toddler's heart rate is 79 bpm (below normal by one bpm) he automatically rates a CHEWS of 3 in the cardiovascular category. However, if his birthday the next day places him in the pre-school category, suddenly his CHEWS score is 0; he is perfectly healthy. The question naturally arises if there are not data driven ranges that could better classify patients.
0 2.2 Vital Signs: A Closer Look
This section provides a closer exposition of common vital signs used in clinical moni-toring. In particular, we present the underlying measurement modalities for acquisition of physiologic waveforms from which the vital sign trend data are derived. We also provide some physiological background for why monitoring HR, RR, and SpO2 might
allow us to determine which patients are at risk of decompensation.
0 2.2.1 Heart Rate
The heart rate, HR, can be derived from the ECG waveform. The ECG is a time series of the heart's electrical activity. A single heartbeat contains a sequence of electrical signatures that are labeled chronologically as P,
Q,
R, S, and T as shown in Figure 2.3. The P wave is the depolarization of the atria. The QRS complex is the depolarization of the ventricles. The atria repolarize during this time, but the signature is buried by34 CHAPTER 2. VITAL SIGNS AND RESEARCH DATABASE
the large-amplitude ventricular depolarization. The T wave is the repolarization of the ventricles.
Because the R peak is prominent, it is commonly used as the temporal marker for calculating heart rate. The time between two R-R peaks is the R-R interval. The reciprocal of the R-R interval is the instantaneous HR. The HR signal is held between R-R intervals, as shown in Figure 2.4.
Heart rate is thus the beating frequency of the heart; it is one of several effectors that can change to maintain a constant blood pressure. A constant blood pressure level is necessary for proper perfusion of the body. The autonomic feedback control loop that maintains constant blood pressure is called the baroreflex [32]. If blood pressure falls, the baroreflex triggers an increase in heart rate, and total peripheral resistance, among other responses, and if blood pressure rises, the baroreflex triggers a decrease in these. Therefore, heart rate deviations from normal may indicate a compensatory response because of challenges to blood pressure. For example, if stroke volume is reduced, heart rate must increase to compensate for what otherwise would be a decrease in cardiac output and a concomitant decrease in blood pressure in the absence of changes in peripheral resistance [32].
There is significant research that links reduced variability in instantaneous HR with decreased autonomic function and poor patient outcome [35]. The variability may be measured at the beat-to-beat level via an analysis of R-R intervals [35] but also on the minute level [36].
M 2.2.2 Respiration Rate
Respiration rate, RR, is the frequency of the inspiratory/expiratory cycle. In our data, a high-frequency current is injected across the ECG leads in order to measure the impedance change of the chest with time, as chest volume changes cyclically. The
0ECOND stos S -T S$GM T :SGMENT P:__ ;- P-R S-T L INTEltVAL N1*ERVAL -QRS.j ITiRVAL Q-T
t
INTERVAL'Figure 2.3: The standard features of an ECG trace with normal values [33].
Heart Rate
RR Interval EC Tr.ce
Figure 2.4: An ECG with heart rate derived as the reciprocal of the interval between R peaks [34].
36 CHAPTER 2. VITAL SIGNS AND RESEARCH DATABASE
injected signal frequency is outside the ECG frequency band. From the respiratory waveform, a Philips monitor derives the respiratory rate and displays the respiratory rate as a vital-sign trend, possibly averaged over several breaths.
Respiration rate is a controlled variable that is primarily sensitive to the partial pressure of arterial carbon dioxide, PaCO2. Only if the partial pressure of arterial oxygen, PaO2, drops significantly will oxygen chemoreceptors drive breathing. The
alveolar ventilation equation quantifies how RR and PaCO2 are inversely related, and
PaCO2 is related to blood pH through the Henderson-Hasselbalch equation [32]. A
serious respiratory rate indicator is if the respiratory rate falls below normal. While that might be a pH-compensatory response, it might also mean that the patient has become tired and can no longer maintain the breathing rate necessary for his oxygen demands.
M 2.2.3 Blood Oxygenation
Blood oxygenation is the average percentage of oxygen bound to hemoglobin relative to its maximum (of four oxygen atoms per hemoglobin molecule). It is measured non-invasively through a pulse oximeter instead of a direct blood gas measurement, so the value is labeled SpO2 instead of SaO2, which has been the traditional designation of
blood oxygenation by direct arterial sampling. However, SpO2 generally is a valid surrogate for SaO2 for specific applications, and it is the most widely used physiological
measurement in clinical practice.
While SpO2 is frequently monitored because it is so accessible, it presents a number of practical difficulties for predictive use. Because of the sigmoidal shape of the relation-ship between oxygen saturation and arterial partial pressure of oxygen, PaO2 (Figure 2.5), the PaO2 can actually be substantially reduced before there is a significant drop
Sec. 2.2. Vital Signs: A Closer Look 37 100
90-70 at60
~40
~30
~20
10 10 20 30 40 50 0 70 80 90 100 PaO 2 (mmHg)Figure 2.5: Sigmoidal oxygen hemoglobin disassociation curve causes relative
indepen-dence of SpO2 at moderate to high levels of arterial partial pressure of oxygen [37].
Even more unhelpful from the diagnostic perspective is how SpO2 can be a mislead-ing indicator of respiratory health if the fraction of inspired oxygen is unknown. For example, a patient might have an oxygen saturation of greater than 98% only because he is breathing 100% oxygen. This patient's respiratory system would be significantly compromised compared to a patient with the same oxygenation levels, but breathing room air.
CHEWS scores as well as other rubrics take into account both the absolute SpO2 value and the amount of inspired oxygen support. Unfortunately, the latter information
is not available from the bedside monitors. A normal SpO2 value may only exist because of oxygen therapy whose presence is unknown to us. Therefore, the SpO2 trend data may overestimate a patient's health. On the other hand, acute or chronic declines or sustained depressions of SpO2 or intermittent desaturations are strong indicators of respiratory distress.
38 CHAPTER 2. VITAL SIGNS AND RESEARCH DATABASE
U 2.2.4 Blood Pressure
Blood pressure (BP) is the force per area exerted by blood on the vessel wall. It changes with location in the body and as a function of time. In our data set, arterial BP is collected every four hours via an automated arm cuff that uses the oscillometric method to automatically detect systolic, mean, and diastolic pressures. More generally, arterial blood pressure is a waveform that varies characteristically over the course of a cardiac cycle (Figure 2.6). The systolic pressure, Ps, is the peak pressure obtained during the cardiac cycle. The diastolic value, Pd, is the minimum pressure during the cardiac cycle. Their difference, termed pulse pressure, is roughly proportional to stroke volume and therefore a surrogate for it. Systolic and diastolic values can be used to approximate the mean blood pressure using the 1/3 P
+
2/3 Pd rule.Blood pressure is a controlled variable. Therefore, the body will use effectors such as the heart rate, venous tone, total peripheral resistance, cardiac contractility, and fluid retention to maintain sufficient blood pressure to perfuse all organs. A low blood pressure has more severe immediate consequences than a high blood pressure because blood pressure is the driving force for organ perfusion. If blood pressure is high, local arteriolar resistance may be increased to reduce local blood flow. However, if blood pressure is too low, compensatory mechanisms might become exhausted. If perfusion is inadequate, the organ can suffer acute and sometimes irreversible damage [32]. Con-sequently, an acute decrease in mean BP is dangerous in itself. It also is an indicator because that the body is no longer able to hold it at a normal level [32].
One challenge associated with the arterial pressure measurement in our work is how to interpret two, near-simultaneous readings that are significantly different. Addition-ally, blood pressure in our study is taken only approximately every four hours, and sometimes even less frequently, thus limiting our ability to leverage this important vital sign for early detection of acute physiological decompensation.
Sec. 2.3. Physiological Models 39 P systolic 120 BP [mmHd 80[ P diastolic 80 lime
Figure 2.6: Arterial blood pressure waveform with typical adult values for systolic and diastolic pressures [38]
0 2.2.5 Temperature
Temperature is not available electronically from BCH, and it is included in only some published early warning score rubrics. In children, it has been found that temperature independently increases heart rate by 10 beats per minute (bpm) for each increase of 1 degree Celsius [39]. An elevated heart rate may therefore be a surrogate marker, though a non-specific one, for an elevated temperature. An elevated temperature is a key indicator for systemic inflammatory response syndrome (a precursor to sepsis) [40].
* 2.3 Physiological Models
In addition to leveraging trend data features, we hope to exploit known relationships among organ systems to aid meaningful data fusion. One method includes using estab-lished physiological models. As an example, the Windkessel model is a simple model for the systemic circulation. It is shown in the form of an electrical circuit analog in Figure 2.7.
The heart is modeled as a current source that generates impulses at the frequency of cardiac contraction. The impulse area is the stroke volume (SV), which is the amount of blood ejected from the left ventricle per beat. The average volume of blood pumped
40 CHAPTER 2. VITAL SIGNS AND RESEARCH DATABASE
Figure 2.7: Windkessel model of heart (current source), arterial compliance, Ca, and resistive peripheral vasculature, R. Cardiac stroke volume is represented by SV.
by the heart per unit time is the cardiac output (CO) and is equal to the stroke volume times the heart rate (HR):
CO=SV-HR (2.1)
The blood enters the systemic circulation, which can be modeled as a capacitor or compliance in parallel with a resistor. The compliance represents the storage ability of the arteries. The resistor represents the resistance of the arterioles and capillaries. Stroke volume in this impulsive model is equal to arterial capacitance (Ca) times the pulse pressure (PP), where the pulse pressure is the systolic pressure, Ps, minus the preceding diastolic pressure, Pd:
SV = Ca - PP = Ca - (Ps - Pd). (2.2)
The physiological analog of Ohm's law states that pressure is equal to blood flow times resistance. Assuming steady state, which ensures no average flow through the compliance, we can now write
P=CO-R. (2.3)
Combining the above relationships yields several useful results. For example, though
Sec. 2.3. Physiological Models 41
Ca is unknown, a quantity proportional to SV and therefore CO can be estimated, which
in turn can be used to estimate a quantity proportional to total peripheral resistance, TPR or R [33]:
CO=CA-PP-HRocPP-HR (2.4)
and
MABP MABP
CO PP-HR
The mean arterial blood pressure (MABP) is computed approximately from a blood pressure cuff measurement as
1 2
MABP = -P9 + -P. (2.6)
3 3
Cardiac output (CO) reflects in part how well the heart is working as a pump, and TPR reflects the state of the patient's vasculature. For example, constricted arterioles substantially increase TPR because arterial resistance scales inversely with the fourth power of vessel radius [32].
One manifestation of the coupling between the respiratory system and the cardio-vascular system is the modulation of the pulse pressure waveform at the respiration rate. During inspiration, the pulse pressure decreases, and during expiration, the pulse pressure increases. (When the increase is unusually high, this phenomenon is called pul-sus paradoxus [41].) If the coupling is absent or changes substantially over a patient's stay, then presumably a pathological stimulus has altered the cardiovascular system's response to breathing. Furthermore, the relative change in amplitude of the modulation may suggest possible clinical treatments, because it has been shown that large ampli-tude modulation correlates with hypovolemia in ventilated patients [42]. Unfortunately,
42 CHAPTER 2. VITAL SIGNS AND RESEARCH DATABASE
0 0.6 1 1.5 2
Freq[Hz]
Figure 2.8: Power spectral density of pulse plethysmogram after envelope detection over one hour of data, estimated with Welch periodogram. Peak occurs at 16.5 events/minute. Philips respiratory rate trend data for this time is 16.3 breaths/min.
a continuous arterial pulse pressure reading is not available, as this requires an invasive measurement of arterial blood pressure. However, the pulse plethysmogram provides alternative access to the continuous pulse amplitude information. Using the PPG wave-form, envelope detection, artifact removal, and basic spectral analysis, a distinct peak is present in the example shown in Figure 2.8. This peak agrees well with the respiratory rate from the respiratory rate trend data for this patient during this time period.
M 2.4 Physiology of Cardiopulmonary Decompensation
The two primary motivations for closely monitoring vital signs are to quickly identify signs of cardiopulmonary decompensation and to evaluate response to treatment [43]. Early detection and treatment is crucial. While full recovery happens in 80% of patients with respiratory failure, if the condition deteriorates to cardiac failure, recovery prob-ability is drastically reduced to 9% [44]. The sharp change in prognosis highlights the
Sec. 2.4. Physiology of Cardiopulmonary Decompensation 43
presence of a physiological tipping point beyond which recovery is improbable. Unlike in adults where cardiac arrest is primarily caused by ischemia to the heart, in chil-dren cardiac arrest is generally secondary to respiratory failure and/or severe, adverse metabolic changes such as those associated with sepsis [43]. Because respiratory distress and sepsis are two primary reasons for transfer, a basic overview of their physiology and trajectory to cardiopulmonary decompensation will be reviewed.
0 2.4.1 Respiratory Distress and Failure
Respiratory distress is any condition that entails an increased work of breathing, even though oxygenation requirements may still be met [44]. By contrast, respiratory failure is insufficient ventilation and delivery of oxygen to meet the body's needs. Respiratory arrest is the absence of breathing [44]. While respiratory distress may not always proceed to respiratory failure, both are precursors for cardiac arrest in children, and therefore demand prompt treatment [44]. Additionally, respiratory distress is estimated to contribute to approximately 50% of pediatric ICU admissions [45].
The anatomy and physiology of children makes children especially prone to respi-ratory problems. Very young children have a disproportionately large tongue, smaller airways, and a more cartilaginous chest compared to children above eight years old (at age eight, the pediatric respiratory system is similar to an adult system, though it is still smaller in scale). Young children also have fewer alveoli and surface area for gas exchange than adults. Additionally, they have an oxygen demand per unit mass greater than adults which leads to hypoxia in about half the time as adults upon cessation of breathing. Upon cessation of breathing, a drop in oxygen saturation from 100% to 95% in infants takes less than two minutes, for toddlers it takes 2.5 minutes, and for children greater than three it takes 4 minutes [46] (Recall from Figure 2.5 that a 5% drop in saturation is associated with a very significant decrease in PaO2). Finally,


![Figure 2.3: The standard features of an ECG trace with normal values [33].](https://thumb-eu.123doks.com/thumbv2/123doknet/14755475.582290/35.918.270.657.248.575/figure-standard-features-ecg-trace-normal-values.webp)
![Figure 2.6: Arterial blood pressure waveform with typical adult values for systolic and diastolic pressures [38]](https://thumb-eu.123doks.com/thumbv2/123doknet/14755475.582290/39.918.179.753.164.343/figure-arterial-pressure-waveform-typical-systolic-diastolic-pressures.webp)