The MIT Faculty has made this article openly available.
Please share
how this access benefits you. Your story matters.
Citation
Kwasnieski, Jamie C. et al. "Early genome activation in Drosophila
is extensive with an initial tendency for aborted transcripts and
retained introns." Genome Research 29, 7 (June 2019): 1188-1197 ©
2019 The Authors
As Published
http://dx.doi.org/10.1101/gr.242164.118
Publisher
Cold Spring Harbor Laboratory
Version
Final published version
Citable link
https://hdl.handle.net/1721.1/125971
Terms of Use
Creative Commons Attribution NonCommercial License 4.0
Early genome activation in
Drosophila is extensive
with an initial tendency for aborted transcripts
and retained introns
Jamie C. Kwasnieski,
1,2,3Terry L. Orr-Weaver,
2,3and David P. Bartel
1,2,31
Howard Hughes Medical Institute, Whitehead Institute for Biomedical Research, Cambridge, Massachusetts 02142, USA;
2Department of Biology, Massachusetts Institute of Technology, Cambridge, Massachusetts 02139, USA;
3Whitehead Institute for
Biomedical Research, Cambridge, Massachusetts 02142, USA
Control of metazoan embryogenesis shifts from maternal to zygotic gene products as the zygotic genome becomes
tran-scriptionally activated. In
Drosophila, zygotic genome activation (ZGA) has been thought to occur in two phases, starting
with a minor wave, in which a small number of genes become expressed, and progressing to the major wave, in which
many more genes are activated. However, technical challenges have hampered the identification of early transcripts or
ob-scured the onset of their transcription. Here, we develop an approach to isolate transcribed mRNAs and apply it over the
course of
Drosophila early genome activation. Our results increase by 10-fold the genes reported to be activated during what
has been thought of as the minor wave and show that early genome activation is continuous and gradual.
Transposable-element mRNAs are also produced, but discontinuously. Genes transcribed in the early and middle part of ZGA are short
with few if any introns, and their transcripts are frequently aborted and tend to have retained introns, suggesting that
in-efficient splicing as well as rapid cell divisions constrain the lengths of early transcripts.
[Supplemental material is available for this article.]
In nearly all animals, the earliest stages of embryogenesis take place in the absence of transcription, and development is instead con-trolled by maternally deposited RNAs and proteins. As develop-ment progresses, its regulation is handed over to zygotically encoded RNAs and proteins, during a process referred to as the ma-ternal-to-zygotic transition (MZT) (Tadros and Lipshitz 2009). Although the timing of the MZT can differ, nearly all metazoans undergo an MZT. The MZT is defined by two important events: the degradation of maternal RNAs and the transcriptional activa-tion of the zygotic genome (Tadros and Lipshitz 2009). The timing and regulation of zygotic genome activation (ZGA) is critical for the developing embryo because many genes required for sex determi-nation, pattern formation, and gastrulation need to be transcribed from the zygotic genome prior to the onset of gastrulation. The ac-tivation of the zygotic genome is thought to occur in two phases, starting with a minor wave, in which a small number of genes be-come expressed, and progressing to a major wave, in which many more genes are activated (Tadros and Lipshitz 2009).The onset of genome activation takes place in a unique regu-latory paradigm in which some genes must be activated in the context of an otherwise quiescent genome. For animals whose em-bryos undergo external development, such as zebrafish, Xenopus, and Drosophila, the earliest gene activation occurs as the embryo is undergoing multiple rounds of rapid, synchronized cell divi-sions that slow as embryogenesis continues (Yuan et al. 2016). These cell divisions are regulated by a modified cell cycle that oscil-lates between DNA synthesis and mitosis, without gap phases, and in flies, these divisions take place in a shared cytoplasm (Yuan et al. 2016). Previous studies have proposed that the rapid cell cycles limit the time available for transcription, thereby limiting the
size of the genes that can be fully transcribed (Edgar and Schubiger 1986; Shermoen and O’Farrell 1991) or the size of the al-ternative isoforms that can be produced (Sandler et al. 2018).
Experiments monitoring incorporation ofα-P32-UTP into
na-scent transcripts of Drosophila embryos first detect transcription during nuclear cycle (NC) 11 (Edgar and Schubiger 1986), al-though later experiments using in situ hybridization demonstrat-ed that the minor wave of ZGA begins as early as NC 8 for several genes (Supplemental Table S1; Erickson and Cline 1993; Pritchard and Schubiger 1996). Studies using high-throughput methods to identify genes transcribed early in ZGA found that these genes, in addition to being short in length with few introns, are also en-riched in binding motifs for the transcription factor Zelda (ten Bosch et al. 2006; De Renzis et al. 2007; Li et al. 2008; Liang et al. 2008; Ali-Murthy et al. 2013). Zelda is a pioneer transcription factor capable of binding DNA even in areas of high nucleosome occupancy, and as a result, it is able to activate transcription in the otherwise quiescent genome (Sun et al. 2015). In addition to standard nuclear genes, mitochondrial genes and transposable el-ements (TEs) are also transcribed early (Edgar and Schubiger 1986; Lécuyer et al. 2007).
The major wave of ZGA occurs later, during NC 14 (Edgar and Schubiger 1986; De Renzis et al. 2007). At this embryonic stage, the cell cycle becomes longer, with the addition of a gap (G2) phase be-tween DNA synthesis and mitosis, which provides time for the cell membranes to invaginate between nuclei and produce a cellu-larized blastoderm (Yuan et al. 2016). Cellularization is the first morphological event that requires zygotic transcription. Multiple
Corresponding authors: weaver@wi.mit.edu, dbartel@wi.mit.edu Article published online before print. Article, supplemental material, and publi-cation date are at http://www.genome.org/cgi/doi/10.1101/gr.242164.118.
© 2019 Kwasnieski et al. This article is distributed exclusively by Cold Spring Harbor Laboratory Press for the first six months after the full-issue publication date (see http://genome.cshlp.org/site/misc/terms.xhtml). After six months, it is available under a Creative Commons License (Attribution-NonCommercial 4.0 International), as described at http://creativecommons.org/licenses/by-nc/4.0/.
transcription factors, including Zelda, regulate transcription in the major wave, and splicing is also required (Liang et al. 2008; Guilgur et al. 2014).
To learn about the onset of ZGA and the molecular character-istics of early zygotic transcription, zygotic transcripts must be identified, which can be difficult because they are low in abun-dance compared to the large amount of maternally deposited RNA in the embryo. Nonetheless, previously developed approach-es have been informative. In situ hybridization methods can iden-tify zygotic transcripts from a gene without maternally deposited transcripts, and this method has been used to detect zygotic tran-scription of 10 genes prior to NC 10 (Supplemental Table S1; Erick-son and Cline 1993; Pritchard and Schubiger 1996; ten Bosch et al. 2006; Ali-Murthy and Kornberg 2016). This method is limited by low throughput and can have difficulty distinguishing mature mRNAs from either abortive transcripts or incompletely processed intermediates. A second approach identifies zygotic transcripts us-ing microarrays to measure gene-expression differences between wild-type embryos and those with systematic deletions of chromo-some arms (De Renzis et al. 2007). This approach has implicated 57 genes as transcribed in NC 10–13 (Supplemental Table S1). A limitation of this approach is that indirect expression changes re-sulting from removing large chromosomal arms from the embryo can introduce some false positives. A third approach uses allele-specific expression, as monitored by sequence polymorphisms, to distinguish paternal transcripts, which must be zygotic, from maternal transcripts (Lott et al. 2011; Ali-Murthy et al. 2013). A limitation of this approach is that it can only detect zygotic transcripts from genes with polymorphisms that distinguish the two parental alleles. Nonetheless, one study reports 70 genes ex-pressed prior to NC 9 (Ali-Murthy et al. 2013), although, as de-scribed below, our evaluation of the data behind this study has called into question such early transcription of most of these genes.
Because of these potential limitations, we reasoned that a di-rect-labeling approach that can isolate and interrogate all of the newly transcribed mature RNAs for analysis by high-throughput sequencing could provide more sensitive and accurate detection of the onset of ZGA and the molecular characteristics of early tran-scription. Accordingly, we developed a method to capture and se-quence the nascent zygotic mRNA of early Drosophila embryos. Using this approach, we found that early genome activation is much more extensive than previously appreciated. In addition, analysis of transcripts identified disruptions in mRNA production and pre-mRNA processing that influence the earliest zygotic transcripts.
Results
Isolation of zygotically transcribed mRNAs
To characterize transcripts that are expressed during activation of the zygotic genome, we used metabolic labeling of nascent RNA followed by a click chemical reaction to tag the labeled RNA for specific and efficient capture (Fig. 1A). Embryos were injected with either 50 mM or 250 mM 5-ethynyl uridine (5-EU) just after fertilization and then allowed to develop at room temperature, during which time 5-EU was incorporated into newly synthesized RNA. RNA was then harvested from hand-sorted embryos that had developed to the desired morphological stage (Wieschaus and Nusslein-Volhard 1986). This RNA was poly(A)-selected to enrich for full-length mRNAs and reacted with a biotin-azide reagent to
biotinylate the 5-ethnylyl uridine bases. This approach is concep-tually similar to the strategy employed in Heyn et al. (2014) but takes advantage of a copper-catalyzed reaction between an ethynyl and an azide group that is highly specific and efficient (Jao and Salic 2008). Biotinylated RNAs were then captured and sequenced in parallel with the input and flowthrough samples, reasoning that zygotic transcripts would be enriched in the eluate, whereas mater-nally deposited RNA would be enriched in the flowthrough (Fig. 1A). Unlike commercially available kits, this approach used a bio-tinylation reagent with a disulfide bond enabling 5-EU-labeled RNA to be specifically eluted from the streptavidin beads with a reducing agent.
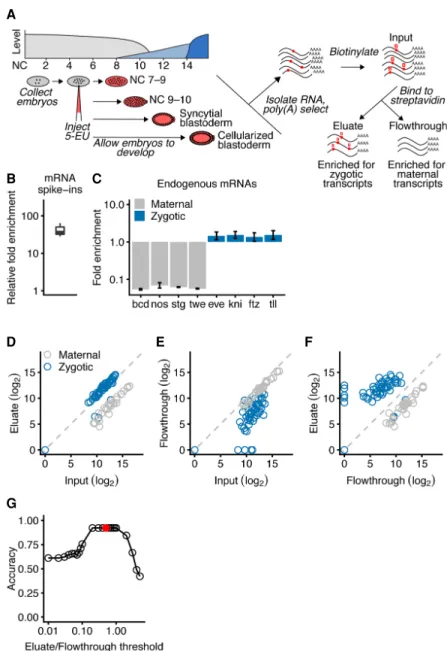
As more genes became activated, samples from later develop-mental stages were expected to contain more labeled RNA. Therefore, two sets of spike-ins were added to enable measure-ments to be normalized for quantitative comparisons. First, we added two in vitro-transcribed mRNAs to the input samples. One of these mRNAs was transcribed with some 5-ethynyl UTP, and the other was transcribed with only the natural NTPs. After captur-ing the biotinylated RNA, the relative abundance of these internal controls was measured, thereby indicating the enrichment of 5-EU-containing RNA, which was substantial (median, 47-fold) (Fig. 1B). Second, we added poly(A)-selected RNA isolated from HEK293 cells to each sample at the beginning of library prepara-tion. The fraction of reads that aligned to the human genome was used to normalize the expression measurements across se-quencing libraries.
To confirm that our method isolated zygotic transcripts, we examined the behavior of known sets of zygotically transcribed and maternally deposited mRNAs in RNA isolated from embryos at the syncytial-blastoderm stage. All but four of the 57 mRNAs re-ported to be zygotically transcribed by the syncytial-blastoderm stage (De Renzis et al. 2007) were modestly enriched in the eluate compared to the input, whereas 35 mRNAs reported to be mater-nally deposited with no zygotic transcription by the syncytial-blas-toderm stage (Dworkin and Dworkin-Rastl 1990; Semotok and Lipshitz 2007) were substantially depleted (Fig. 1C,D). Because the zygotic transcripts also were depleted from the flowthrough samples (Fig. 1E), even greater discrimination between zygotic and maternal transcripts was achieved when examining the ex-pression in the eluate with respect to the flowthrough (Fig. 1F). We empirically determined that an eluate-to-flowthrough ratio of 0.5 observed in two biological replicates reliably discriminated between zygotically transcribed and maternally deposited tran-scripts (Fig. 1G).
Identification of genes transcribed early in ZGA
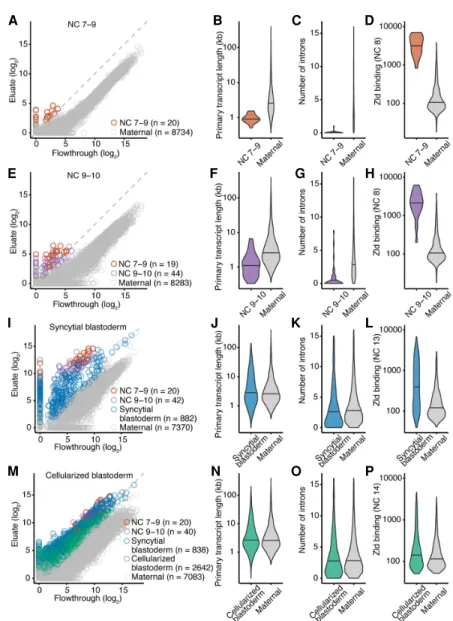
In situ hybridization studies indicate that some transcription oc-curs prior to NC 11 (Erickson and Cline 1993; Pritchard and Schubiger 1996; Ali-Murthy and Kornberg 2016), which is the on-set of transcription as detected by radiolabeling (Edgar and Schubiger 1986). To test whether our approach could provide addi-tional evidence for transcription occurring prior to NC 11, we com-pared the eluate and flowthrough samples from embryos collected from NC 7 to the beginning of NC 9 but before pole-cell formation, which occurs later in NC 9. Analysis of these data identified 20 genes that were transcribed at this early period of development (Fig. 2A; Supplemental Fig. S1A; Supplemental Table S1). The 20 genes included sisA and sc, for which transcripts had been ob-served at NC 8 and NC 9 using in situ hybridization (Erickson and Cline 1993; Pritchard and Schubiger 1996).
These 20 genes were transcribed when nuclei were dividing every 8 min, prior to any slowing of the cell cycle, which presumably imposed a time con-straint on transcript production and pro-cessing. Indeed, compared to genes with maternally deposited transcripts, these genes had a significantly shorter medi-an primary-trmedi-anscript length (P < 10−9, Mann–Whitney U test) (Fig. 2B), and most (19 of 20) were intronless (P < 10−9, Mann–Whitney U test) (Fig. 2C). These observations resembled those of previous analyses showing that genes transcribed during early ZGA in Drosophila and zebra-fish are short and tend to have few in-trons (De Renzis et al. 2007; Ali-Murthy et al. 2013; Heyn et al. 2014).
Zelda is a major regulator of ZGA in Drosophila and activates the expression of hundreds of genes (Liang et al. 2008; Harrison et al. 2011; Nien et al. 2011). To evaluate if Zelda might also be activat-ing expression of these very-early-tran-scribed genes, we looked at the binding of Zelda to the promoter and enhancer regions of these genes, using Zelda chro-matin immunoprecipitation sequencing (ChIP-seq) data (Harrison et al. 2011) and functional annotations of enhancer regions (Kvon et al. 2014). All 20 genes had overlapping Zelda ChIP-seq signal in their promoter or enhancer regions, and the ChIP-seq signals in these regions were some of the highest in the data set (Fig. 2D). Together, these results indicat-ed that ZGA begins with the transcrip-tional activation of at least 20 genes during NC 7–9 and that Zelda might be a transcriptional regulator of these genes. To determine if this set of genes might have related functions, we ana-lyzed its Gene Ontology enrichment. Sex determination was one of the few sig-nificantly enriched Gene Ontology pro-cesses, which was enriched based on the presence of sisA and sc in the gene set (Supplemental Table S2). Early transcrip-tion of sex-determining genes has been previously noted (Lott et al. 2011). Perhaps genes involved in sex determina-tion are transcribed early because sex determination driven by differences in the number of X Chromosomes in the zy-gote is one of the few processes that can-not be directed by maternally deposited transcripts.
A previous study involving analysis of allele-specific expression reported the identification of 70 genes transcribed pri-or to NC 9 (Ali-Murthy et al. 2013), which raised the question of why we identified
A
B
C
D
G
E
F
Figure 1. Isolation of zygotic RNAs using metabolic labeling. (A) Schematic of Drosophila ZGA and the protocol used to isolate zygotic RNAs. At the top left is a diagram of Drosophila ZGA, redrawn from Tadros and Lipshitz (2009) but labeling the x-axis using NC number. Maternal transcripts (gray) dominate early, prior to the minor and major waves (light blue and dark blue, respectively) of zygotic transcription. Below the ZGA diagram is a schematic of the protocol. Embryos were collected just after fertilization, injected with 5-EU, given time to develop, and then RNA was harvested at four morphologically defined stages. Total RNA containing both zygotically transcribed RNA, which was labeled with 5-EU (red dots), as well as maternal RNA, which was unlabeled, was isolated and reacted with a biotin-azide reagent. Reacted RNA was incubated with streptavidin beads, and sequencing libraries were prepared from bound RNA (elu-ate), unbound RNA (flowthrough), and input RNA. (B) Enrichment of 5-EU-containing RNA. For each experiment, the fold enrichment observed in the eluate compared to the input was calculated for a 5-EU-containing standard and normalized to that of the unlabeled standard (line, median; box, quartiles; whiskers, fifth and 95th percentile). (C ) Enrichment of zygotic mRNAs (blue) and depletion of maternal mRNAs (gray) in the eluate compared to the input. Analysis is from RNA of embryos in the syncytial-blas-toderm stage (error bars, range from two biological replicates). (D) Enrichment of most annotated zygot-ic mRNAs (blue) and depletion of maternal mRNAs (gray) in the eluate of RNA analyzed from embryos in the syncytial-blastoderm stage. The 57 zygotic transcripts are those annotated by De Renzis et al. (2007); the 35 maternal transcripts were curated from the literature. (E) Depletion of zygotic transcripts from the flowthrough. Otherwise, this panel is as in D. (F) The relationship between transcript level in the eluate compared to that in the flowthrough. Otherwise, this panel is as in D. (G) Discrimination of annotated maternal and zygotic transcripts as a function of their levels in the eluate and flowthrough. Accuracy is calculated as the fraction of the 92 mRNAs assigned an annotation matching that of the literature. The reason it did not reach 1.00 can be attributed to four misannotated mRNAs in the set of zygotic tran-scripts. The red dot represents the eluate/flowthrough threshold of 0.5, which was used to identify zygot-ic transcripts in subsequent analyses.
only 20 genes transcribed in this develop-mental period. To answer this question, we examined data and information gen-erously provided by the authors of the previous study (Supplemental Table S3). Of the 70 genes, 43 had been identified because of the apparent inclusion of RNA from older embryos, and six ap-peared to be false positives for other rea-sons (Supplemental Table S3). Of the 21 genes with the most compelling evidence of expression prior to NC 9 in the data from Ali-Murthy et al. (2013) ( Supple-mental Table S3), 11 were also identified in our analysis as being transcribed prior to pole-cell formation, nine were identi-fied as transcribed in the next develop-mental stage that we profiled (NC 9–10), and one was identified as zygotically tran-scribed later in the syncytial blastoderm (Supplemental Table S1).
Gradual, continuous, and widespread
activation of the zygotic genome
We extended our analyses to results from embryos collected after pole-cell forma-tion through NC 10. Analyses of these data from NC 9–10 embryos identified 63 genes transcribed by the end of this developmental period (Fig. 2E; Supple-mental Fig. S1B; Supplemental Table S1), including 19 of the 20 that were de-tected in NC 7–9. As with the 20 initially transcribed genes, the 44 additional genes had a median primary-transcript length that was significantly shorter than that of maternally deposited tran-scripts (P < 10−10, Mann–Whitney U test) (Fig. 2F), significantly fewer introns than maternally deposited transcripts (P < 10−10, Mann–Whitney U test) (Fig. 2G), and substantial overlap (40 of 44 genes) with Zelda ChIP-seq signal in their promoter or enhancer regions (Fig. 2H).Gene Ontology analysis showed that this gene set was enriched for many biological functions, including the regulation of transcription, embryon-ic pattern specifembryon-ication, and cell fate determination (Supplemental Table S2). Moreover, two additional genes that regulate sex determination, runt (run) and unpaired 1 (upd1), were transcribed, which together with the previously acti-vated genes sisA and sc comprise the pri-mary determinants of X Chromosome dosage (Salz and Erickson 2010). Female sex is determined when the levels of the proteins encoded by these genes exceed the threshold needed to overcome
A
B
C
D
E
F
G
H
I
J
K
L
M
N
O
P
Figure 2. Gradual, continuous, and widespread activation of the zygotic genome. (A) Identification of 20 genes transcribed before pole-cell formation. Plotted for each gene is the level of mRNA in the eluate as a function of its level in the flowthrough. Genes passing the threshold for annotation as zygotically transcribed are indicated (red), as are those with detected transcripts that did not pass the threshold (gray). (B) Comparison of primary-transcript lengths of genes transcribed during NC 7–9 (red, n = 20) with those of genes with maternal transcripts (gray, n = 4873). Genes with maternal transcripts are those expressed in stage 14 oocytes (Kronja et al. 2014) and not annotated as zygotically transcribed in our study. (C ) Comparison of intron numbers for genes transcribed during NC 7–9 (red, n = 20) with those for genes with maternal transcripts (gray, n = 4873). Maternal genes with intron numbers exceeding that of the 99th percentile were excluded. (D) Analysis of Zelda ChIP-seq signal, comparing the distribution of signals for genes transcribed during NC 7–9 (red) with that for genes with maternal transcripts (gray). Zelda ChIP-seq data were from embryos in NC 8 (Harrison et al. 2011). Of the genes transcribed during NC 7–9, all 20 had Zelda ChIP-seq signal, and of the set of 4873 genes with maternal transcripts, 494 had Zelda ChIP-seq signal. (E) Identification of 44 additional genes transcribed at NC 9–10. Points for genes identified as zygotically transcribed in two biological replicates are colored, indicating in purple those not identified in the previous stage. Otherwise, this panel is as in A. (F–H) As in B–D but comparing results of the additional genes transcribed at NC 9–10 (purple) with those of genes with maternal transcripts. Of the 44 genes newly transcribed during NC 9–10, 40 had Zelda ChIP-seq signal. (I) Identification of 882 additional genes transcribed in NC 11–13 (blue). Otherwise, this panel is as in E. (J–L) As in B–D but ex-amining the additional genes transcribed in the syncytial blastoderm (blue). Zelda ChIP-seq data were from embryos at NC 13. Of the 882 genes newly transcribed in the syncytial blastoderm, 336 had Zelda ChIP-seq signal at NC 13, and of the set of 4873 genes with maternal transcripts, 567 had Zelda ChIP-seq signal. (M) Identification of 2642 additional genes transcribed in NC 14 (green). Otherwise, this panel is as in I. (N–P) As in B–D examining the additional genes transcribed in the cellu-larized blastoderm (green). Zelda ChIP-seq data were from embryos at NC 14. Of the 2642 genes newly transcribed in the cellularized blastoderm, 511 had Zelda ChIP-seq signal, and of the set of 4873 genes with maternal transcripts, 679 had Zelda ChIP-seq signal. All pairs of violin plots were scaled to have the same area. Horizontal line denotes median.
maternally deposited repressors, permitting transcription of Sex-le-thal (Sxl) in XX embryos. The observation that these genes were ac-tivated in NC 7–10 suggested that selection has maximized the time for transcription to enable superthreshold levels of SisA, Run, Upd1, and Sc to be achieved before Sxl is required during cellularization.
To identify genes transcribed after NC 10 and before the onset of the major wave of ZGA, we analyzed results from embryos col-lected at the syncytial-blastoderm stage (NC 11–13), in which the cell-cycle duration progressively lengthens from 10 to 25 min (Yuan et al. 2016). Our analysis identified 944 genes tran-scribed by this stage, including 62 of the 64 that were trantran-scribed in earlier stages (Fig. 2I;Supplemental Fig. S1C). Indeed, the repre-sentation of these 62 genes in the eluate increased compared to earlier stages (Fig. 2A,E), which indicated that the early-activated genes continued to be transcribed in the syncytial blastoderm. This observation showed that early genome activation is continu-ous, in that once activated, genes tended to remain activated, which agrees with results from previous studies (Harrison et al. 2011; Lott et al. 2011).
The median primary transcript length of the 882 genes newly transcribed in the syncytial blastoderm was not significantly dif-ferent than that of maternally deposited transcripts (P = 0.05, Mann–Whitney U test) (Fig. 2J). Moreover, although these newly transcribed transcripts had significantly fewer introns when com-pared to maternal transcripts (P < 0.05, Mann–Whitney U test) (Fig. 2K), the numbers of introns approached that of maternal tran-scripts. These results were consistent with the idea that increased cell-cycle length alleviated the need for expressed genes to be short.
As with genes expressed earlier in ZGA, we observed overlap between the promoter or enhancer regions of these genes and Zelda ChIP-seq signal. Although a smaller fraction of genes (336 of 882) overlapped with ChIP-seq signal, the statistical significance of the overlap was high (P < 10−15,χ2test), and the intensity of the
binding remained substantial (Fig. 2L).
The 882 genes were enriched for many common developmen-tally related biological processes, including anatomical structure, morphogenesis, pattern specification, and cell-fate specification. Indeed, some prominent developmental regulators were tran-scribed during this period, including zelda (which is produced from the zygotic genome in addition to being maternally depos-ited), several gap genes (kni, Kr, hb, gt, hkb), several pair-rule genes ( ftz, odd, opa, prd), and primary transcripts of the miR-309 microRNA family, which targets maternal RNAs for decay (Tadros and Lipshitz 2009). Although quantitative PCR evidence has sug-gested that engrailed (en) might be transcribed as early as NC 6 (Ali-Murthy et al. 2013), our results indicated that en was one of the 882 genes newly transcribed in the syncytial blastoderm (Supplemental Table S1).
To identify genes that are transcribed during what has been considered as the major wave, we analyzed RNA from embryos col-lected at the cellular blastoderm stage, which had undergone the elongated 14th cell cycle. This analysis identified an additional 2642 zygotically transcribed genes, as well as 898 of the 946 genes transcribed in earlier stages (Fig. 2M; Supplemental Fig. S1D;
Supplemental Table S1), bringing the number of zygotically activat-ed genes identifiactivat-ed in our study to 3588, of which 1934 overlappactivat-ed with previous studies (De Renzis et al. 2007; Lott et al. 2011) and 1654 represented novel annotations (Supplemental Fig. S6).
Similar to genes that are first transcribed in the syncytial blastoderm, the 2642 genes that were first transcribed in the
cellu-larized blastoderm did not have significantly longer primary tran-scripts than maternal trantran-scripts (Fig. 2N), or significantly fewer introns than maternal transcripts (Fig. 2O), but they did have a small but significant overlap with Zelda ChIP-seq signal (511 of 2642 genes, P < 10−8, χ2test) (Fig. 2P). Gene Ontology analysis identified multiple biological processes enriched in these genes in-cluding cell–cell adhesion, ectoderm development, and metal-ion transport (Supplemental Table S2). Together, these results suggest that genes transcribed during the later phase of ZGA are not under selection to have short or intronless gene structures and constitute a gene-expression program that equips the embryo for cellulariza-tion and gastrulacellulariza-tion.
Two bursts of TE transcription during ZGA
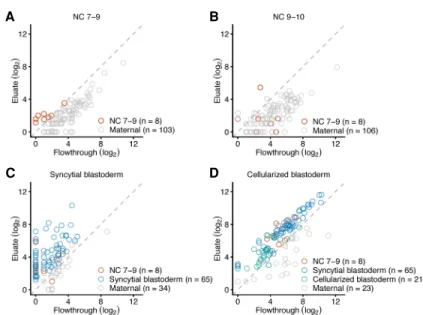
A study using in situ hybridization reports that transcripts of TEs are among the earliest zygotic transcripts detected (Lécuyer et al. 2007), which prompted us to examine the timing and extent of TE transcription during ZGA. Accordingly, we summed the reads for each annotated isoform of each TE family and used the ap-proach described for host RNAs to identify zygotically transcribed TE families. This analysis identified eight retrotransposon families that were transcribed during NC 7–9 and prior to pole-cell forma-tion (Fig. 3A;Supplemental Table S4). Unlike the pattern observed for host RNAs, no additional transcribed TE families were identi-fied in NC 9–10 embryos (Fig. 3B). Indeed, signal for all eight TE families diminished in NC 9–10, with none of them surpassing the threshold for annotation as zygotically transcribed in both rep-licates (Supplemental Table S4), which suggested that these tran-scripts were targeted for degradation, presumably by the piRNA pathway. This discontinuous pattern of expression contrasted with the pattern of host RNA expression, in which most genes ac-tivated during NC 7–9 had even higher abundance in the eluate of NC 9–10 embryos.
In the syncytial blastoderm stage, a second burst of TE tran-scripts was observed, with zygotic transcription of six of the origi-nal eight transcribed families, as well as 65 additioorigi-nal TE families (Fig. 3C;Supplemental Table S4). These newly transcribed TE fam-ilies included 11 DNA transposons and 54 retrotransposons (Kaminker et al. 2002). In cellularized-blastoderm embryos, zygot-ic transcripts were observed for 92 TE families, including all eight detected in NC 7–9 and 63 of the 65 families first transcribed in the syncytial blastoderm (Fig. 3D;Supplemental Table S4).
Evidence of abortive transcripts
The prevailing model of ZGA hypothesizes that the short cell-cycle length of early stages restricts the time available for transcription, such that transcription is disrupted before RNA polymerase II reaches the end of the gene (Shermoen and O’Farrell 1991). A pre-diction of this model is that aborted transcripts would be more prevalent at the early stages with shorter cell cycles. To detect the presence of aborted transcripts, we repeated the sequencing, starting with rRNA depletion rather than poly(A) selection, reason-ing that the poly(A) selection performed prior to the original sequencing would have depleted any aborted transcripts ( Supple-mental Table S5). The normalized sum of read densities was plot-ted across the lengths of all zygotically expressed mRNAs (Fig. 4A,C,E,G). Read density of zygotic transcripts was compared to those of maternal-transcript cohorts that were each chosen to match both the number and the primary-sequence length of the zygotic transcripts. Reads mapping to maternal transcripts were present, albeit depleted, in the samples of labeled RNA (Fig. 1D).
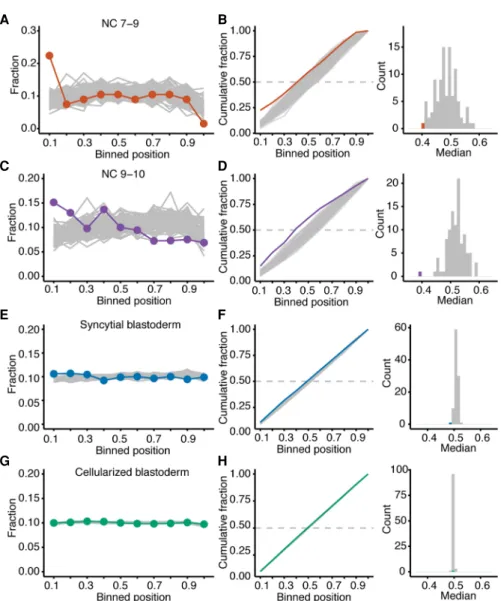
In samples with abundant abortive zygotic transcripts, we ex-pected zygotic transcripts to have greater read density at their 5′ ends compared to maternal transcripts. Indeed, in RNA harvested from NC 7–9 embryos, we observed a greater 5′bias for the zygotic
transcripts than for maternal transcripts (Fig. 4A). By comparing the position of the median read density of the zygotic transcripts to those of the maternal-transcript cohorts, which served as the null distribution, we empirically estimated a P-value of <0.01 (Fig. 4B). We also observed a 5′bias in read coverage for zygotic transcripts from embryos in NC 9–10 (P < 0.01) (Fig. 4C,D) and the syncytial blastoderm (P < 0.01) (Fig. 4E,F), although the magni-tude of this bias decreased as embryonic development proceeded. By the cellularized blastoderm, a 5′bias in read density for zygotic transcripts was no longer observed (Fig. 4G,H). Resolution of the abortive-transcription defect in the oldest embryos examined, which were grown in the presence of 5-EU for the longest time, al-leviated concern that 5-EU incorporation might have caused abor-tive transcription.
The 5′ biases in read density suggested that aborted tran-scripts comprised 60% of the zygotic trantran-scripts from NC 7–9 em-bryos, 50% of the zygotic transcripts from NC 9–10 emem-bryos, 11% of the zygotic transcripts from the syncytial-blastoderm embryos, and <0.5% of the zygotic transcripts from cellularized-blastoderm embryos. To the extent that aborted transcripts were preferentially degraded, these fractions underestimated the true fractions of aborted transcripts.
We also searched for evidence that nonproductive trans-cription might occur before the stage in which the full-length
mRNAs were produced. Accordingly, we identified genes with evidence of tran-scription in rRNA-depleted samples prior to the stage in which mature mRNAs are detected in poly(A)-selected samples. This analysis identified 23 genes with ev-idence for abortive transcription in NC 7– 9 and full-length transcription at later stages (seven in NC 9–10, nine in the syncytial blastoderm, and seven in the cellular blastoderm). However, a signifi-cant 5′ bias in read density across the gene body was not observed at NC 7–9 (Supplemental Fig. S2), perhaps because of the sparsity of reads from these tran-scripts, although the possibility of false positives cannot be excluded. Likewise, 89 genes were identified with evidence for abortive transcription in NC 9–10 and full-length transcription later (72 in the syncytial blastoderm, 17 in the cellu-lar blastoderm); these had a significant 5′ bias in read density at NC 9–10 ( Supple-mental Fig. S2). Compared to genes with maternally deposited transcripts, genes that appeared to be primarily transcribed as abortive transcripts at early stages tend-ed to have shorter primary-transcript length, fewer introns, and more overlap with Zelda ChIP-seq signal. However, these trends were not as strong as those observed for genes with full-length mRNAs detected in the same stage ( Sup-plemental Fig. S2).
The abundance of newly transcribed genes in the syncytial-blastoderm and cellularized-syncytial-blastoderm stages allowed analysis of only genes with longer primary transcripts. The 5′bias in read coverage was more pronounced for the longest transcripts newly made at the syncytial-blastoderm stage but not for the longest transcripts newly made at the cellularized-blastoderm stage (Supplemental Fig. S3). We also observed strong evidence for abor-tive TE transcripts at NC 7–9 (P < 0.01), which was no longer signif-icant in the syncytial blastoderm, the stage of the second burst of TE transcription (Supplemental Fig. S4). Our observation of a 5′ bias in read density for zygotic transcripts produced at stages with short cycles, which diminished and then disappeared in the stages at which the cell cycle lengthened, supported the pro-posal that fast cell-cycle divisions limit the length of genes that can be productively transcribed in the early embryo.
Defect in splicing during ZGA
Because introns were nearly absent from genes activated during NC 7–9 and severely depleted from genes activated during NC 9–10, we hypothesized that splicing might be limited during ZGA. Evidence of intron retention in the kuk transcript prior to cellularization (Guilgur et al. 2014) and that an intronless cDNA gene can be expressed more effectively than its intron-containing counterpart during NC 13 (Rothe et al. 1992) support this idea.
To determine whether the early-transcribed transcripts had retained introns suggestive of inefficient splicing, we used the
A
B
C
D
Figure 3. Two bursts of TE family expression. (A) Identification of eight TE families transcribed before pole-cell formation. Plotted for each gene is the level of mRNA in the eluate as a function of its level in the flowthrough when analyzing RNA harvested from embryos that spanned NC 7–9, prior to pole-cell formation. Results for eight TE families passing the threshold for annotation as zygotically transcribed are indicated (red), as are those with detected transcripts that did not pass the threshold (gray). All TE families with expression detected in NC 7–9 are plotted. (B) No additional TE families are transcribed when analyzing RNA harvested from embryos that spanned NC 9–10. Points for all TE families tran-scribed in the previous stage are shown in red and all TE families with expression detected in NC 9– 10 are plotted. (C ) Identification of 65 additional TE families transcribed in the syncytial blastoderm using RNA harvested from syncytial-blastoderm embryos. Points for TE families identified as zygotically transcribed in two biological replicates are colored, indicating in blue those not identified in a previous stage. (D) Identification of 21 additional TE families transcribed in the cellularized blastoderm using RNA harvested from cellularized-blastoderm embryos. Points for TE families identified as zygotically transcribed in two biological replicates are colored, indicating in green those not identified in a previ-ous stage.
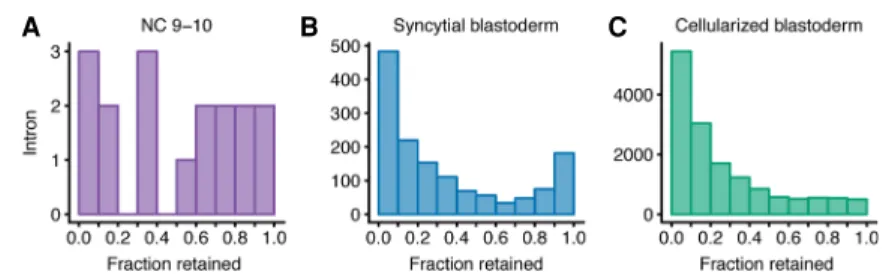
Mixture of Isoforms framework (Katz et al. 2010) to analyze our RNA-seq reads from the metabolically labeled fractions. For each intron in each zygotically transcribed gene, we calculated the percentage of transcripts in which that intron was retained, fo-cusing on the three later stages (NC 9–10, syncytial blastoderm, and cellularized blastoderm) because only one intron-containing gene was transcribed during NC 7–9. Substantial intron reten-tion was observed in poly(A)-selected RNA from NC 9–10, with 53.0% of introns retained in >50% of their transcripts (Fig. 5A). Similarly, in poly(A)-selected RNA from the syncytial-blastoderm, 27.6% of introns were retained in >50% of their transcripts (Fig. 5B), whereas this fraction dropped to 18.0% in RNA from the cellularized blastoderm (Fig. 5C). Reduced defec-tive splicing in the oldest embryos examined, which were grown
in the presence of 5-EU for the longest time, alleviated concern that 5-EU incorporation might have caused intron retention.
We examined several intron features including intron length, intron order, transcript expression, the contribution of intron-defined versus exon-defined splicing (RIME) (Pai et al. 2017), and the quality of splice sites (Yeo and Burge 2004) to determine if any features could distinguish spliced introns from retained introns. For transcripts from the syncy-tial-blastoderm and cellularized-blasto-derm stages, we observed that poorly spliced introns (those retained in >75% of transcripts) were somewhat shorter than well-spliced introns (those retained in <25% of transcripts) and had slight-ly lower-quality splice sites (P < 0.01, Mann–Whitney U test with Bonferroni correction) (Supplemental Fig. S5), but no other features helped explain the in-tron retention we observed. Nonetheless, our results revealed defective splicing of many introns during ZGA, which mostly resolved by the time the embryo cellularized.
Discussion
Using our approach to label and isolate zygotic transcripts directly, we substan-tially expanded the known scope of early ZGA, identifying 946 genes that were transcribed by NC 13. Of the nine genes reported to be transcribed in early embry-os based on in situ analyses (Erickson and Cline 1993; Pritchard and Schubiger 1996), our work indicated that they are indeed transcribed during early ZGA as full-length polyadenylated mRNAs. Of the 21 genes that appear to be transcribed before NC 9 based on global analysis of paternal-allele expression (Supplemental Table S3; Ali-Murthy et al. 2013), we con-firmed that all 21 were transcribed at some point in early ZGA. Of the 57 genes reported to be transcribed within NC 10–13 (De Renzis et al. 2007), we found that 16 were activated prior to pole-cell formation, 26 were activated in NC 9–10, and 11 were activated in the syncytial blastoderm (NC 11–13). The remaining four were not identified as zygotically transcribed by NC 14 in our analysis and thus might represent false positives. Indeed, none of these four fulfill the crite-ria for zygotic transcription when the authors examine the effects of deleting chromosome arms from the embryo (De Renzis et al. 2007). When considering the overlap of genes identified in previ-ous studies, 67 unique genes were confirmed by our analyses to be transcribed prior to NC 14, a number that increases to 83 when including genes identified by Ali-Murthy et al. (2013) based on inclusion of embryos that were older than NC 8 but presumably still younger than NC 14 (Supplemental Table S1). Thus, the 946
A
B
C
D
G
H
E
F
Figure 4. Evidence for abortive transcription in early ZGA. (A) Analysis of read density across tran-scripts, comparing results for zygotic and maternally deposited transcripts. The fraction of reads map-ping to genes transcribed during NC 7–9 are plotted across the binned transcript bodies (red). For comparison, the fraction of reads mapping to 100 equal-sized cohorts of maternal transcripts are plotted across their binned transcribed bodies (gray). (B) Distributions of the normalized read densities plotted in A. At the left are the cumulative distributions, indicating results for the zygotic transcripts (red) and ma-ternal cohorts (gray). Dashed line indicates median. At the right is the distribution of median values, plot-ting in red the median value of the zygotic cumulative distribution. (C,D) As in A,B but for genes that become activated in NC 9–10 embryos. (E,F) As in A,B but for genes that become activated in syncy-tial-blastoderm embryos. (G,H) As in A,B but for genes that become activated in cellularized-blastoderm embryos.
genes identified in our study represent a 10-fold increase in the genes reported to be transcribed by NC 13, in what has convention-ally been considered the minor wave of ZGA.
A reanalysis of the expression data of Lott et al. (2011) also in-dicates that more than 83 genes are transcribed prior to NC 14, with a summary of this reanalysis stating that 206 genes are acti-vated by NC 13 (Li et al. 2014). However, because the identities of these early-activated genes are not disclosed, this study does not add to the list of genes reported to be transcribed by NC 13.
We also expanded the number of TE families known to be transcriptionally active in early ZGA by 35-fold. Studies using in situ hybridization had identified that the TE families copia and Doc were transcribed in the early embryo (Lécuyer et al. 2007). We identified the Doc family plus another seven families tran-scribed prior to pole-cell formation and the copia family plus an ad-ditional 64 families transcribed by the end of NC 13. Moreover, we found that TEs are transcribed in two bursts during early ZGA, in which eight families are transcribed prior to pole-cell formation and most TE families are transcribed in the second burst, which be-gins in the syncytial blastoderm.
Although we substantially expanded the known scope of early ZGA, our approach presumably missed some of the genes ac-tivated during this period. For example, genes with a large mater-nal contribution that overwhelmed the mRNA transcribed in the zygote might not have been classified as zygotically transcribed in our analysis. For cases in which the zygotic and maternal mRNAs were produced as different isoforms, our approach might be extended to focus on unique features of the zygotic isoform and thereby identify some of these false negatives.
Of the 21 genes with evidence for very early transcription in our reanalysis of data from Ali-Murthy et al. (2013), 11 were inde-pendently identified in our study as transcribed in NC 7–9, but 10 were not detected until later (nine in NC 9–10). A likely explana-tion for this discrepancy is that our method, when applied to only 250 embryos, lacked the sensitivity to detect low transcrip-tion of these 10 genes prior to NC 9. Indeed, although reads for these genes did not pass our threshold in both replicates, we did detect at least one read for nine of these genes in NC 7–9 samples. Another possible explanation is that these genes are transcribed af-ter NC 9 but are prematurely identified by the previous study, due to either inclusion of RNA from older embryos or a permissive an-notation threshold. With respect to the nine genes identified as transcribed in NC 7–9 in our analysis but not by Ali-Murthy et al. (2013), most have one or fewer polymorphisms that differ be-tween the parental strains and thus would have been difficult to identify based on analysis of paternal-allele expression.
The observation that pre-mRNAs of genes activated in early ZGA tend to be short has led to a model in which fast cell cycles limit the time for transcription in early development (Shermoen and O’Farrell 1991; Tadros and Lipshitz 2009). Our results support this model and provide additional insight regarding the influence of this effect over the course of early development. For exam-ple, the model predicts that aborted tran-scripts might be produced as the short window for transcription abruptly closes, and our results provide direct, genome-wide evidence that transcription during early ZGA produces aborted transcripts. Such transcripts had previously been shown for two genes in NC 13 (Shermoen and O’Farrell 1991; Rothe et al. 1992). We expanded the number of genes and developmental stages in which the abor-tive transcripts occur and found that the fraction of reads attribut-able to abortive transcripts is greatest before pole-cell formation. We also confirmed that pre-mRNAs of genes activated in early ZGA tend to be short and provided developmental resolution to this phenomenon. In addition, our observation that, compared to genes activated in NC 14, a greater fraction of genes activated in early ZGA tend to have regulatory regions bound by Zelda agrees with reports that Zelda plays a prominent role in opening the ge-nome and priming enhancers for regulation by other transcription factors (Schulz et al. 2015; Sun et al. 2015).
A recent report estimates that the RNA Pol II elongation rate is 2.4 kb/min in the syncytial blastoderm, which is considerably fast-er than previous estimates and hypothesized to be sufficiently fast such that elongation would not be the rate-limiting step (Fukaya et al. 2017). Our observation that pre-mRNAs approaching 100 kb are transcribed in the syncytial blastoderm, in which the cell cy-cle is no more than 25 min, indicates that elongation can be even more rapid at this stage. Nonetheless, a rapid elongation rate can be reconciled with the original model of rate-limiting elongation if the time required for other processes that can impact or impede elongation, such as RNA Pol II initiation, collisions with the repli-cation machinery, or condensation of the chromosomes in mito-sis, substantially constrains the window available for elongation. For instance, if this window was <0.5 min in the 8-min cycles ob-served before pole-cell formation, it could expand by >30-fold in the 25-min cycle observed at the end of the minor wave ([25– 7.5]/[8–7.5] = 35), allowing much longer genes to be transcribed. Such a short initial time window for elongation, together with the widespread splicing defect that we observed early in genome activation, would help to explain the differences in pre-mRNA length and intron number that we observed for genes activated in the beginning compared to the end of ZGA.
What might be the function of the earliest transcription if it is prone to defects in transcription and pre-mRNA processing that lower the yield of mature mRNA? At some loci, the primary func-tion of early transcripfunc-tion might be to activate the genomic region to facilitate later transcription of translationally competent mRNAs. However, the strong selection for short genes with few in-trons suggests a function for the mature mRNAs that are produced, despite lower yield, as the genome is first activated. Prominent among these early-transcribed genes are those that encode compo-nents of the sex-determination pathway. The protein products of these genes act before cellularization, supporting the idea that
A
B
C
Figure 5. Introns retained in polyadenylated zygotic transcripts. (A) Analysis of intron retention within transcripts of genes activated during the NC 9–10. For each intron with >20 informative reads, the frac-tion retained was calculated (Katz et al. 2010), and the number of introns falling within each bin of re-tention were plotted. A value of 0.0 describes a completely spliced intron and a value of 1.0 reflects a 100% retained intron. (B) As in A but analyzing zygotically transcribed RNA isolated at the syncytial-blas-toderm stage. (C ) As in A but analyzing zygotically transcribed RNA isolated at the cellularized-blasto-derm stage.
the production of their mature transcripts is necessary for embryo-genesis and that their short, intronless nature allows a greater frac-tion of transcripts to be processed into mature mRNAs.
The increased sensitivity of our results shows that much of the genome is activated earlier than previously reported. The reso-lution of our embryonic staging and associated findings contribute to a model of ZGA in which the number of activated genes gradu-ally increases as embryogenesis progresses, in contrast to a model in which the genome is activated in discrete waves of transcrip-tion. Moreover, activation is continuous, in that nearly all genes activated at the onset of ZGA continued to be transcribed later. These conclusions agree with those from studies of ZGA in frog and fish, which also used techniques with improved sensitivity to identify earlier transcription (Collart et al. 2014; Heyn et al. 2014), suggesting that continuous and gradual ZGA may be a wide-spread feature of the animal MZT.
Methods
Embryo collection, injection, and staging
Embryos were collected from Oregon R (OrR) flies that had been fattened for 2 d with wet yeast at 22°C. Embryos were collected for 20 min (15 min for embryos being harvested at NC 7–9) on ap-ple juice-agar plates, and the first two collections were discarded to avoid collecting embryos that had been held within females for a prolonged time. After collection, embryos were dechorionated for 90 sec with 50% bleach, washed once with 0.02% Triton X-100, and washed twice with deionized water.
To prepare the dechorionated embryos for injection, embryos were arranged into an end-to-end line on a molasses–agar plate then transferred to a coverslip previously coated with tape glue. Uncovered embryos were desiccated at 18°C for∼7 min then cov-ered with halocarbon oil. Embryos were injected with either 50 mM or 250 mM 5-ethynyl uridine (Jena Biosciences) using a PLI-100 Plus Pico-Injector (Harvard Apparatus) adjusted such that the injected volume was approximately equal to one-fifth the volume of a single embryo (∼40 psi).
After injection, embryos were aged at room temperature in a humid chamber. Embryos were morphologically staged according to Wieschaus and Nusslein-Volhard (1986), and this staging no-menclature was converted to nuclear cycle numbers using Foe et al. (1993) as follows: NC 7–9 (stage 2, no pole-cell formation), NC 9–10 (stage 3, with pole cells), NC 11–13 (stage 4), NC 14 (stage 5). Embryos corresponding to the wrong stage were removed from the slide with forceps, the remaining halocarbon oil was drained, and embryos were liberated from the slide with heptane.
Isolation of 5-EU-containing RNA and library preparation
Injected embryos were transferred to a 1.5-mL tube, homogenized in TRI-reagent, and frozen at−80°C. Once approximately 250 in-jected embryos were collected for each stage, lysates were thawed and combined appropriately. RNA was extracted with TRI-reagent (Thermo Fisher Scientific) as directed by the manufacturer’s proto-col. Approximately 3.0 µg of total RNA was poly(A)-selected using a Dynabeads mRNA purification kit (Thermo Fisher Scientific), or alternatively, for one sample at each time point, rRNA was de-pleted from 1.0 µg of total RNA using the Ribo-Zero Gold kit (Illumina).5-EU-labeled RNA was biotinylated with a biotin-azide re-agent in a typical copper(II)-catalyzed click chemical reaction. The biotinylated RNA was isolated with a streptavidin pull-down. The unbound RNA was collected from the beads as the flowthrough, and to elute the bound RNA, the disulfide linkage
binding the RNA to the beads was reduced with 0.5 M Tris(2-car-boxyethyl)phosphine hydrochloride (TCEP), pH 7.0. RNA from the eluate, flowthrough, and input samples were prepared for se-quencing using the SMARTer Stranded RNA-seq kit (Takara Bio).
RNA-seq analysis
When annotating transcribed genes, genes were first filtered to re-move those with an expression level <2 RPKM in the eluate. The ratio of expression in the poly(A)-selected eluate compared to that in the matched flowthrough was calculated for each of the re-maining genes, and those with eluate/flowthrough > 0.5 in both biological replicates were annotated as transcribed. For the RNA harvested from NC 7–9 embryos, transcribed genes were annotated as those above the threshold in the poly(A)-selected sample and the rRNA-depleted sample. Intron number, intron length, intron order, and primary-transcript length were calculated using the lon-gest transcript isoform model. Gene Ontology analysis was done using GOrilla (Eden et al. 2009). Methods for sequencing and map-ping all reads and for detecting TE expression are described in the
Supplemental Material.
Calculating read density across the transcript body
Aligned reads from rRNA-depleted libraries were assigned to ORF annotations and deduplicated with SAMtools (Li et al. 2009). Each transcript ORF was divided into 10 equally sized bins, and the number of reads was summed within each bin. For each ORF with a total read number greater than the median, the read num-bers in each bin were down-weighted such that their total matched the median read number. For each set of zygotic genes, an equal number of genes with maternal transcripts were sampled (with re-placement) to match the primary-transcript length distribution of the zygotic set. This sampling procedure was conducted 100 times. A modified approach was used to plot the read density of TE-mapping reads. Pseudoaligned reads from rRNA-depleted libraries were assigned to TE isoforms as part of the kallisto output (Bray et al. 2016). Each TE isoform was divided into 10 equally sized bins, and binned reads were summed for all isoforms of a family. Normalization and sampling was as described for host mRNAs. Because some TE isoforms are not full length, for each family we only included reads that mapped to isoforms that were 70% of the length of the longest isoform.
Estimating splicing efficiency
Alternative event annotations were generated from the longest transcript isoform of each gene (GFF format, UCSC dm6 reference assembly) using the gff_make_annotation.py script from the rna-seqlib package (http://github.com/yarden/rnarna-seqlib) ( Supplemen-tal Code) with the“--flanking-rule commonshortest” parameter. This package was modified to quantify the retention of every in-tron, regardless of whether or not the intron was annotated as an alternatively spliced intron. To quantify the splicing efficiency of each intron in each zygotic transcript, the MISO software (Katz et al. 2010) was run in“exon-centric” mode on poly(A)-selected el-uate samples, and only retained intron events with more than 20 reads were considered.
Data access
Raw RNA-seq reads and processed data files from this study have been submitted to the NCBI Gene Expression Omnibus (GEO; https://www.ncbi.nlm.nih.gov/geo/) under accession number GSE125575. Code used for estimating splicing efficiency has
been submitted to GitHub (https://github.com/jkwasnieski/) and is available asSupplemental Code.
Acknowledgments
We thank S. Eichhorn, H. Kashevsky, other members of the Bartel and Orr-Weaver labs, and M. Tworoger for helpful discussions. We also thank M. Eisen, T. Kornberg, and S. Lott for sharing unpub-lished information. This work was supported by grants from the National Institutes of Health to J.C.K. (GM120984), T.L.O.-W. (GM118098), and D.P.B. (GM118135). D.P.B. is an investigator of the Howard Hughes Medical Institute.
References
Ali-Murthy Z, Kornberg TB. 2016. Bicoid gradient formation and function in the Drosophila pre-syncytial blastoderm. eLife 5: e13222. doi:10 .7554/eLife.13222
Ali-Murthy Z, Lott SE, Eisen MB, Kornberg TB. 2013. An essential role for zy-gotic expression in the pre-cellular Drosophila embryo. PLoS Genet9: e1003428. doi:10.1371/journal.pgen.1003428
Bray NL, Pimentel H, Melsted P, Pachter L. 2016. Near-optimal probabilistic RNA-seq quantification. Nat Biotechnol34: 525–527. doi:10.1038/nbt .3519
Collart C, Owens ND, Bhaw-Rosun L, Cooper B, De Domenico E, Patrushev I, Sesay AK, Smith JN, Smith JC, Gilchrist MJ. 2014. High-resolution analysis of gene activity during the Xenopus mid-blastula transition. Development141: 1927–1939. doi:10.1242/dev.102012
De Renzis S, Elemento O, Tavazoie S, Wieschaus EF. 2007. Unmasking activation of the zygotic genome using chromosomal deletions in the Drosophila embryo. PLoS Biol5: e117. doi:10.1371/journal.pbio .0050117
Dworkin MB, Dworkin-Rastl E. 1990. Functions of maternal mRNA in early development. Mol Reprod Dev 26: 261–297. doi:10.1002/mrd .1080260310
Eden E, Navon R, Steinfeld I, Lipson D, Yakhini Z. 2009. GOrilla: a tool for discovery and visualization of enriched GO terms in ranked gene lists. BMC Bioinformatics10: 48. doi:10.1186/1471-2105-10-48
Edgar BA, Schubiger G. 1986. Parameters controlling transcriptional activa-tion during early Drosophila development. Cell44: 871–877. doi:10 .1016/0092-8674(86)90009-7
Erickson JW, Cline TW. 1993. A bZIP protein, Sisterless-a, collaborates with bHLH transcription factors early in Drosophila development to deter-mine sex. Genes Dev7: 1688–1702. doi:10.1101/gad.7.9.1688 Foe VE, Odell GM, Edgar BA. 1993. Mitosis and morphogenesis in the
Drosophila embryo: point and counterpoint. In The development of Drosophila melanogaster (ed. Bate BM, Martinez-Arias A). Cold Spring Harbor Laboratory Press, Cold Spring Harbor, NY.
Fukaya T, Lim B, Levine M. 2017. Rapid rates of Pol II elongation in the Droso-phila embryo. Curr Biol27: 1387–1391. doi:10.1016/j.cub.2017.03.069 Guilgur LG, Prudêncio P, Sobral D, Liszekova D, Rosa A, Martinho RG. 2014.
Requirement for highly efficient pre-mRNA splicing during Drosophila early embryonic development. eLife3: e02181. doi:10.7554/eLife.02181 Harrison MM, Li XY, Kaplan T, Botchan MR, Eisen MB. 2011. Zelda binding in the early Drosophila melanogaster embryo marks regions subsequently activated at the maternal-to-zygotic transition. PLoS Genet7: e1002266. doi:10.1371/journal.pgen.1002266
Heyn P, Kircher M, Dahl A, Kelso J, Tomancak P, Kalinka AT, Neugebauer KM. 2014. The earliest transcribed zygotic genes are short, newly evolved, and different across species. Cell Rep 6: 285–292. doi:10 .1016/j.celrep.2013.12.030
Jao CY, Salic A. 2008. Exploring RNA transcription and turnover in vivo by using click chemistry. Proc Natl Acad Sci105: 15779–15784. doi:10 .1073/pnas.0808480105
Kaminker JS, Bergman CM, Kronmiller B, Carlson J, Svirskas R, Patel S, Frise E, Wheeler DA, Lewis SE, Rubin GM, et al. 2002. The transposable elements of the Drosophila melanogaster euchromatin: a genomics per-spective. Genome Biol 3: research0084.1. doi:10.1186/gb-2002-3-12-research0084
Katz Y, Wang ET, Airoldi EM, Burge CB. 2010. Analysis and design of RNA sequencing experiments for identifying isoform regulation. Nat Methods7: 1009–1015. doi:10.1038/nmeth.1528
Kronja I, Yuan B, Eichhorn SW, Dzeyk K, Krijgsveld J, Bartel DP, Orr-Weaver TL. 2014. Widespread changes in the posttranscriptional landscape at the Drosophila oocyte-to-embryo transition. Cell Rep 7: 1495–1508. doi:10.1016/j.celrep.2014.05.002
Kvon EZ, Kazmar T, Stampfel G, Yáñez-Cuna JO, Pagani M, Schernhuber K, Dickson BJ, Stark A. 2014. Genome-scale functional characterization of Drosophila developmental enhancers in vivo. Nature512: 91–95. doi:10 .1038/nature13395
Lécuyer E, Yoshida H, Parthasarathy N, Alm C, Babak T, Cerovina T, Hughes TR, Tomancak P, Krause HM. 2007. Global analysis of mRNA localiza-tion reveals a prominent role in organizing cellular architecture and function. Cell131: 174–187. doi:10.1016/j.cell.2007.08.003
Li XY, MacArthur S, Bourgon R, Nix D, Pollard DA, Iyer VN, Hechmer A, Simirenko L, Stapleton M, Luengo Hendriks CL, et al. 2008. Transcrip-tion factors bind thousands of active and inactive regions in the Droso-phila blastoderm. PLoS Biol6: e27. doi:10.1371/journal.pbio.0060027 Li H, Handsaker B, Wysoker A, Fennell T, Ruan J, Homer N, Marth G,
Abecasis G, Durbin R; 1000 Genome Project Data Processing Subgroup. 2009. The Sequence Alignment/Map format and SAMtools. Bioinformatics25: 2078–2079. doi:10.1093/bioinformatics/btp352 Li XY, Harrison MM, Villalta JE, Kaplan T, Eisen MB. 2014. Establishment of
regions of genomic activity during the Drosophila maternal to zygotic transition. eLife3: e03737. doi:10.7554/eLife.03737
Liang HL, Nien CY, Liu HY, Metzstein MM, Kirov N, Rushlow C. 2008. The zinc-finger protein Zelda is a key activator of the early zygotic genome in Drosophila. Nature456: 400–403. doi:10.1038/nature07388
Lott SE, Villalta JE, Schroth GP, Luo S, Tonkin LA, Eisen MB. 2011. Noncanonical compensation of zygotic X transcription in early Drosophila melanogaster development revealed through single-embryo RNA-seq. PLoS Biol9: e1000590. doi:10.1371/journal.pbio.1000590 Nien CY, Liang HL, Butcher S, Sun Y, Fu S, Gocha T, Kirov N, Manak JR,
Rushlow C. 2011. Temporal coordination of gene networks by Zelda in the early Drosophila embryo. PLoS Genet7: e1002339. doi:10.1371/ journal.pgen.1002339
Pai AA, Henriques T, McCue K, Burkholder A, Adelman K, Burge CB. 2017. The kinetics of pre-mRNA splicing in the Drosophila genome and the in-fluence of gene architecture. eLife6: e32537. doi:10.7554/eLife.32537 Pritchard DK, Schubiger G. 1996. Activation of transcription in Drosophila
embryos is a gradual process mediated by the nucleocytoplasmic ratio. Genes Dev10: 1131–1142. doi:10.1101/gad.10.9.1131
Rothe M, Pehl M, Taubert H, Jäckle H. 1992. Loss of gene function through rapid mitotic cycles in the Drosophila embryo. Nature359: 156–159. doi:10.1038/359156a0
Salz HK, Erickson JW. 2010. Sex determination in Drosophila: the view from the top. Fly (Austin)4: 60–70. doi:10.4161/fly.4.1.11277
Sandler JE, Irizarry J, Stepanik V, Dunipace L, Amrhein H, Stathopoulos A. 2018. A developmental program truncates long transcripts to temporal-ly regulate cell signaling. Dev Cell47: 773–784.e6. doi:10.1016/j.devcel .2018.11.019
Schulz KN, Bondra ER, Moshe A, Villalta JE, Lieb JD, Kaplan T, McKay DJ, Harrison MM. 2015. Zelda is differentially required for chromatin accessibility, transcription factor binding, and gene expression in the early Drosophila embryo. Genome Res25: 1715–1726. doi:10.1101/gr .192682.115
Semotok JL, Lipshitz HD. 2007. Regulation and function of maternal mRNA destabilization during early Drosophila development. Differentiation75: 482–506. doi:10.1111/j.1432-0436.2007.00178.x
Shermoen AW, O’Farrell PH. 1991. Progression of the cell cycle through mi-tosis leads to abortion of nascent transcripts. Cell67: 303–310. doi:10 .1016/0092-8674(91)90182-X
Sun Y, Nien CY, Chen K, Liu HY, Johnston J, Zeitlinger J, Rushlow C. 2015. Zelda overcomes the high intrinsic nucleosome barrier at enhancers during Drosophila zygotic genome activation. Genome Res 25: 1703– 1714. doi:10.1101/gr.192542.115
Tadros W, Lipshitz HD. 2009. The maternal-to-zygotic transition: a play in two acts. Development136: 3033–3042. doi:10.1242/dev.033183 ten Bosch JR, Benavides JA, Cline TW. 2006. The TAGteam DNA motif
con-trols the timing of Drosophila pre-blastoderm transcription. Development 133: 1967–1977. doi:10.1242/dev.02373
Wieschaus E, Nusslein-Volhard C. 1986. Looking at embryos. In Drosophila: a practical approach (ed. Roberts DB), pp. 199–228. IRL Press Limited, Oxford.
Yeo G, Burge CB. 2004. Maximum entropy modeling of short sequence mo-tifs with applications to RNA splicing signals. J Comput Biol11: 377–394. doi:10.1089/1066527041410418
Yuan K, Seller CA, Shermoen AW, O’Farrell PH. 2016. Timing the Drosophila mid-blastula transition: a cell cycle-centered view. Trends Genet32: 496– 507. doi:10.1016/j.tig.2016.05.006