E. FLUCKIGER, D.Sc, AND F. VERZAR, M.D.
(From the Physiological Institute, University of Basel, Basel, Switzerland)
Adaptation to a barometric pressure of about half an atmosphere, or the equivalent low partial oxygen pressure, necessitates vari-ous adjustments in the animal body. Respira-tion and circulaRespira-tion, as well as erythrocyte and hemoglobin production, are changed.
We found (1) it to be a very characteristic phenomenon that, in rats, after lowering the atmospheric pressure to 350 mm. Hg (cor-responding to 6,500 M. simulated altitude), the rectal temperature drops several degrees in a few hours. In about 4 or 5 days body temperature is restored to normal, although the pressure was kept low. It was also demonstrated (2) that rats kept at 350 mm. Hg for a fortnight developed a status, which we called "retained adaptation," i. e., if these animals were brought to atmospheric pres-sure (732 mm. Hg at Basel) and within a few days returned to 350 mm. Hg, only a slight decrease in rectal temperature was observed. At 732 mm. Hg this status of retained adapta-tion slowly returned to the full reacadapta-tion, until, 10 days later, when exposed to 350 mm. Hg, the same drop of rectal temperature was seen as originally.
This drop of temperature and its restora-tion to normal is an objective sign of
adapta-tion which can easily be observed. We have
used this phenomenon in the present publica-tion to investigate whether this adaptapublica-tion to low pressure is the same in young, adult, and aged animals.
METHODS
The technique of these experiments was similar to that employed in our earlier studies (1). Sixty-four white male rats of our labora-tory stock, 45 to 570 days old, were used in groups of 4 animals for each age level, giving a total of 16 groups. Of these, 2 groups were tested more than once: 1 group was studied when 2?2 and 4?2 months (70 and 135 days) old (experiments 74b and 79b), and 1 grxip was tested at the age of 12, 14, and 20 months (360, 420, and 600 days) (experiments 74a, 79a, and 85a).
Submitted for publication December 15, 1954.
Published on a grant from the Forest Park Foundation to the Journal of Gerontology.
The rats were fed with a standard diet ad libitum. They were placed in a tank of about 125 L. capacity, in which the pressure was diminished to 350 mm. Hg and kept constant at about ± 10 mm. Hg. At 350 mm. Hg there was an air flow through the tank of about 4.5 L. per minute. The temperature within the tank was about 22 C. During the first 24 hours the tank was opened several times in order to observe the drop in rectal temperature. During the next days the tank was only opened once daily, the animals taken out for about 20 minutes, and their rectal temperature measured with a mercury ther-mometer. This was done regularly at about 10 to 11 a.m., 24 hours after the last feeding. Afterwards the rats were placed back into the tank, with fresh food and water. The tank was equipped with a window allowing ob-servation of the behavior of the rats. The weight of the animals was taken at regular intervals and in several series also blood hemo-globin was measured by the Sahli method.
Retained adaptation was tested in 13 of the 16 groups. This was done in the follow-ing way: After a period of about 14 days of adaptation to 350 mm. Hg the rats were kept at 730 mm. Hg for 48 hours and then exposed again to 350 mm. Hg. Since retained adapta-tion never lasts longer than about a fortnight, there is no danger that the reaction at a later trial was influenced by the first exposure to low barometric pressure. However, the re-sults in these groups were checked with tho other groups which were only used once.
RESULTS
The results of our experiments are tabu-lated as mean values for each group in table 1. There are always individual differences in each group. The drop of body temperature and the time in which normal body tempera-ture is restored should be compared. Ex-amples of temperature curves of different age groups are shown in figure 1 and 3.
Table 1 shows that there is no difference in the initial drop of rectal temperature be-tween young and old animals; their maximal value was 5.3 C. in 6 weeks (42 days) old 306
TABLE 1. BODY TEMPERATURE ADAPTATION OF RATS TO REDUCED BAROMETRIC PRESSURE. Series 93 07 83 b 88 91 S i b 74 b 90 79 b 85 b 80 74 a S3 a 79 a 89 85 a Age and Number of Animals hx/i weeks n = 7 6 weeks 8 weeks n = 4 S weeks 9 weeks 9 weeks 2V2 months 3 months 4^2 months 5 months 7 months 12 months 14 months 14 months 19 months n = 4 20 months Adaptation Rt*at Beginning CC.) 37.5 37.6 37.2 37.4 37.3 37.6 38.0 37.3 38.1 73.2 37.2 38.1 37.4 38.0 37.6 37.2 Maximal Drop of Rt CC.) 4.7 5.3 3.4 5.2 4.1 3.4 4.5 4.6 4.9 3.4 4.2 4.7 3.5 5.2 5.3 4.9 Rt Restored Day 3.-4. 4. 3. 7. 5. 4. 5. 5. 5. 4. 4. 5. 10. 5. 10. 5. 10. 5. 10. 16. 5. 11. Rt CC) 37.2 37.4 37.2 37.4 37.2 37.8 37.9 37.3 38.0 37.2 37.3 36.9 36.3 35.8 36.0 36.3 36.0 35.2 36.1 36.1 36.6 35.4 R t a t Beginning CC) — 37.2 37.4 37.0 — 37.5 37.6 — 38.0 37.2 36.4 37.7 37.3 37.4 37.4 37.2 Retained Adaptatioi Maximal Drop of Rt CC) — 2.2 1.8 2.7 — 3.2 0.8 — 3.3 1.9 1.0 2.3 2.6 4.1 3.8 3.8 1 Rt Restored Day — 4. 1. 2. — 2. 1. — 2. 2. 1. 3. 3. 2. 3. 3. Rt CC) — 37.0 37.2 36.9 — 37.4 37.7 — 37.8 37.1 36.5 37.3 36.0 35.6 35.4 35.6 Remarks 72 hours at 730 mm. Hg no restoration! no restoration no restoration no restoration no restoration *1U fNo
= Rectal temperature in °C. at 10:00 to 11:00 a.m.
(group 67) as well as in 19 months (570 days) (group 89) old rats.
The difference between young and old rats lies in the ability to restore the original body temperature. In 40 to 210 day (7 months) old animals, restoration is complete in 3 to 5 days; on the third day of low pressure their rectal temperature is mostly above 37 C. and often as high as 37.8 to 38.0 C. Figure 1 shows one of these groups. The 20 rats of 12, 14, 19, and 20 months of age (groups 74a, 83a, 79a, 89, 85a) were unable to restore their body temperature, and figure 3 is an example of how restoration of the body temperature is often at first attempted and how later it again falls. On the tenth day at low pressure body temperature was between 35.4 and 36.3 C.
Thus, in the course of aging, the rats lose the ability to restore normal body tempera-ture at low oxygen pressures.
Retained adaptation, i. e., the reaction to 350 mm. Hg of formerly adapted rats after 2 to 3 days of a pressure of 732 mm. Hg to a new decreased pressure of 350 mm. Hg was also different in old animals. The oldest groups (79a, 89, 85a) showed the largest drop in body temperature, as much as without a previous adaptation. More characteristic is that while the young animals restored body temperature within one to two days (fig. 2)
in the rats of 14, 19, and 20 months of age there was no return to normal body tempera-ture, even after the third day of exposure to low barometric pressure. Some of the old animals died after exposure to low atmos-pheric pressure (fig. 4), which never oc-curred with young animals.
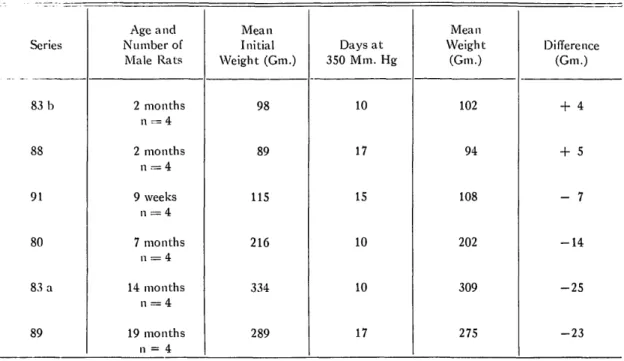
It is known that exposure to low barometric pressure, especially during the first few days, results in a decrease of body weight, or in-hibits growth in young animals through a de-crease of food intake (4) and the body water content (3). The data shown in table 2 are examples.
In order to characterize the influence of low barometric pressure on the different age groups by another criterion, the hemoglobin of the blood from the tip of the tail was de-termined in several series. In rats 2 months
• 1 - H 1 1—+•
-35
-34
-33
-32
-31
-30
0 2 4 6 8 12h 1 2FIG. 1. Series 74b, 4 male rats, 2x/> months old, adaptation to 350 mm. Hg in 2 days.
0 2 4 6 8 12h 1 2d
FIG. 2. Retained adaptation of the same animals (Series 74b) after 48 hours at 730 mm. Hg and then again at 350 mm. Hg.TABLE 2. CHANGES IN WEIGHT OF MALE RATS OF DIFFERENT AGES EXPOSED TO LOW OXYGEN PRESSURE. Series 83 b 88 91 80 83 a 89 Age and Number of Male Rats 2 months 2 months 9 weeks 7 months n = 4 14 months 19 months n = 4 Mean Initial Weight (Gm.) 98 89 115 216 334 289 Days at 350 Mm. Hg 10 17 15 10 10 17 Mean Weight (Gm.) 102 94 108 202 309 275 Difference (Gm.) + 4 + 5 - 7 - 1 4 - 2 5 - 2 3
old the hemoglobin changes were followed during the first 5 days by daily deteiTninations (group 83b). It was found that an increase in hemoglobin started only on the fifth day of exposure, reaching 130-142 per cent on the tenth day (100 per cent = 16 Gm. hemo-globin per 100 c c ) . In table 3 hemohemo-globin values estimated after different periods of ex-posure to 350 mm. Hg are shown. The mean
hemoglobin content at 732 mm. Hg of 14 rats 2 to 14 months old was found to be 106 per cent (range 99-115) when 100 per cent = 16 Gm. Hb per 100 ml. From the table
30-0 2 4 6 8 12h 1 2 4 6 9 1113d
FIG. 3. Series 89b, 4 male rats, 19 months old, incomplete adaptation to 350 mm. Hg.
0 2 4 6 8 12h 1 2 4 6d
FIG. 4. No retained adaptation of the same ani-mals (Series 89b) after 48 hours at 730 mm. Hg and then again at 350 mm. Hg.
TABLE 3. CHANGES IN MEAN BLOOD HEMOGLOBIN IN MALE RATS AT DIFFERENT AGES, EXPOSED TO LOW OXYGEN PRESSURE.
Series Controls at 732 mm. Hg 83 b 81 70 83 a 85 a Age and Number of Animals 2-14 months n = 14 2 months n = 4 9 weeks n = 4 3^2 months n = 4 14 months n = 4 20 months n = 4 Days at 350 Mm. Hg 10)
1
10 [
J
14 10 11 Mean Hemoglobin % (100 = 16 Gm. %) 106 137 166 158 149 Lowest and Highest Value 99-115 125-145 146-180 155-166 146-152it follows that the capacity of the rats to in-crease the blood hemoglobin did not diminish up to 20 months of age (table 3).
DISCUSSION
It is not definitely known what causes the drop of body temperature at the beginning of the exposure to low partial oxygen pressure. Since there are no proofs of altered blood cir-culation under low pressure, the most prob-able explanation is a diminished heat produc-tion. Then in the course of adaptation of the young animals, the metabolism which is neces-sary for normal heat production is increased. In aged animals, however, this increase in metabolic activity to restore and maintain normal body temperature, i. e., their adapta-tion capacity, is diminished; they are also barely able to reach a state of adaptation which can be retained when kept at 732 mm. Hg.
This inability to adapt to low oxygen pres-sure is an astonishingly early sign of aging. It is, so far, the only example of functional adaptation which disappears with age that we were able to observe.
Our experiments show at the same time that the reactivity of the bone marrow in re-spect to hemoglobin production under low oxygen pressure was not decreased in the
old animals. This finding is in line with the results of other experiments, where no de-crease in compensatory hypertrophy of the kidney or of the adrenal cortex could be seen in old animals (5).
From this point of view the demonstration of a decrease of metabolic adaptation to low oxygen pressure in aging rats becomes an es-pecially interesting sign of aging.
SUMMARY
1. Adaptation to low barometric pressure (350 mm. Hg) was studied in 64 male rats between the ages of 45 to 570 days (2 to 20 months).
2. Adaptation was tested by the decrease and the restoration of body temperature dur-ing 15 days' continuous exposure to a low atmospheric pressure of 350 mm. Hg. In addition retained adaptation was also tested after an additional study of 48 hours at nor-mal barometric pressure (732 mm. Hg at
Basel).
3. Fourteen to 20 month old rats are com-pletely unable to restore the normal body temperature after the initial drop during the first few hours of exposure to low barometric pressure. They also show a decreased
re-tained adaptation. This is in contrast to the findings in young animals.
4. There is no significant difference in the increase of blood hemoglobin between young and old rats in response to a 10 to 15 day exposure to 350 mm. Hg.
REFERENCES
1. Fliickiger E., and Verzar, F.: Senkung und Res-titution der Korpertemperatur bei niedrigem at-mospharischem Druck und der Einfluss von Thy-reoidea, Hypophyse und Nebennierenrinde auf dieselbe. Helvet. physiol. et pharmacol. acta, 10: 349-359, 1952.
2. Fliickiger, E., and Verzar, F.: Ueberdanern der Adaptation an niedrigen atmospharischen Druck, nachgewiesen an der Warmeregulation. Helvet. physiol. et pharmacol. acta, 11: 67-72, 1953. 3. Picon-Reategui, E., Fryers, G. R., Berlin, N. I.,
and Lawrence, J. H.: Effect of Reducing the At-mospheric Pressure on Body Water Content of Rats. .Am. J. Physiol, 172: 33-36, 1953.
4. Sundstrom, E. S., and Michaels, G.: The Ad-renal Cortex in Adaptation to Altitude, Climate and Cancer. University of California Press, Berk-eley and Los Angeles, 1942, p. 47
5. Verzar F., and Fliickiger, E.: Adaptation to Low Atmospheric Pressure. Symposia and Abstracts, International Association of Gerontology, Third Congress, 1954, p. 263.