Cortical Surface Area and Cortical Thickness Demonstrate Differential Structural
Asymmetry in Auditory-Related Areas of the Human Cortex
Martin Meyer1,2, Franziskus Liem1,3, Sarah Hirsiger2, Lutz Jäncke2,3and Jürgen Hänggi3
1
Neuroplasticity and Learning in the Healthy Aging Brain (HAB LAB), Institute of Psychology,2International Normal Aging and Plasticity Imaging Center and3Division of Neuropsychology, Institute of Psychology, University of Zurich, Zurich, Switzerland Address correspondence to Martin Meyer, Neuroplasticity and Learning in the Healthy Aging Brain (HAB LAB), Institute of Psychology, University of Zurich, Sumatrastrasse 30, CH-8006 Zurich, Switzerland. Email: [email protected]
This investigation provides an analysis of structural asymmetries in 5 anatomically defined regions (Heschl’s gyrus, HG; Heschl’s sulcus, HS; planum temporale, PT; planum polare, PP; superior temporal gyrus, STG) within the human auditory-related cortex. Volumetric 3-dimensional T1-weighted magnetic resonance imaging scans were collected from 104 participants (52 males). Cortical volume (CV), cor-tical thickness (CT), and corcor-tical surface area (CSA) were calculated based on individual scans of these anatomical traits. This investi-gation demonstrates a leftward asymmetry for CV and CSA that is observed in the HG, STG, and PT regions. As regards CT, we note a rightward asymmetry in the HG and HS. A correlation analysis of asymmetry indices between measurements for distinct regions of in-terest (ROIs) yields significant correlations between CT and CV in 4 of 5 ROIs (HG, HS, PT, and STG). Significant correlation values between CSA and CV are observed for all 5 ROIs. The findings suggest that auditory-related cortical areas demonstrate larger left-ward asymmetry with respect to the CSA, while a clear rightleft-ward asymmetry with respect to CT is salient in both the primary and the secondary auditory cortex only. In addition, we propose that CV is not an ideal neuromarker for anatomical measurements. CT and CSA should be considered independent traits of anatomical asymmetries in the auditory-related cortex.
Keywords: auditory-related cortex, cortical surface area, cortical thickness, hemispheric asymmetry
Introduction
The human auditory cortex should be considered a region of specific interest for cognitive neuroscience as its functioning may be linked to the language network. Even though the functional circuits, as well as the micro- and macroscopic ar-chitecture of the auditory cortex in nonhuman primates, namely macaques and chimpanzees, have been thoroughly in-vestigated (Pandya 1995;Rauschecker et al. 1995,1997;Kaas and Hackett 2000; Hackett et al. 2001; Hackett and Kaas 2004), it is not yet clear whether this knowledge is applicable to the human brain. According to cytoarchitectonic and macroscopic studies, the neuroanatomy of the auditory-related cortex of humans and nonhuman primates is substan-tially different (Hackett et al. 2001; Fullerton and Pandya 2007), for example, with respect to the position and borders of the auditory core region (Da Costa et al. 2011). Further-more, previous research has demonstrated that, in comparison with the functionally defined auditory cortex in macaques, the area pertaining to the functionally defined auditory cortex in humans has expanded by 10-fold when compared with apes during the course of evolution (Woods et al. 2010). Thus, it is more than plausible that the evolution of speech primarily accounts for the differences found in the
auditory-related cortical architecture of humans and nonhu-man primates. In addition, the hunonhu-man auditory cortex demon-strates structural asymmetries pertaining to the microscopic organization of neuronal microcolumns, which are not ap-parent in chimpanzees and macaques (Buxhoeveden and Casanova 2000; Galuske et al. 2000; Buxhoeveden et al. 2001). Attempts to relate hemispheric differences in neuroa-natomical architecture to functional lateralization suggest that the leftward structural macroscopic asymmetry of particular one auditory-related cortical region, namely the planum tem-porale (PT), should be considered the left hemisphere’s domi-nant “speech” neural substrate (Galaburda et al. 1978). In addition, findings from a multitude of reports illustrate a human auditory-related cortex consisting of distinct portions that exhibit a strong leftward structural asymmetry (Penhune et al. 1996;Beaton 1997;Shapleske et al. 1999;Eckert 2004; Josse et al. 2006, 2009; Eckert et al. 2008; Schneider et al. 2009). Nevertheless, a systematic and comparative evaluation of these recent neuroanatomical studies is problematic for several reasons. First, different magnetic resonance imaging (MRI)-based techniques were used to measure the asymmetry of various brain structures associated with language mechan-isms, namely (semi-) manual in vivo morphometry (Jancke and Steinmetz 1993;Foundas et al. 1994,1995,2002;Jancke et al. 1994;Penhune et al. 1996;Knaus et al. 2006) and post-mortem morphometry (Galaburda et al. 1978;Anderson et al. 1999; Harasty et al. 2003). One major shortcoming of the time-consuming measurements employed by those morpho-metric studies is that only data from single, distinct portions of the auditory-related cortex, for example, the PT (Dorsaint-Pierre et al. 2006; Dos Santos Sequeira et al. 2006; Eckert et al. 2006) were reported. This form of methodology becomes problematic if one aims to learn more about the neu-roarchitectonic differences and similarities of the adjacent regions (Heschl’s gyrus, HG; Heschl’s sulcus, HS; PT; planum polare, PP; and lateral superior temporal gyrus, STG) that form the auditory-related cortex. Secondly, it has been em-phasized that considerable interindividual anatomical variabil-ity of auditory-related perisylvian regions (Rademacher et al. 2001;Tzourio-Mazoyer et al. 2004;Desai et al. 2005) enhance the difficulty of finding consistent and reliable results in the relatively small samples that postmortem studies typically consist of (Westbury et al. 1999). Thirdly, due to a lack of compatibility, there was no agreement regarding the extent to which researchers should compare, evaluate, and interpret macroscopic or microscopic measurement data pertaining to structural architecture (Hackett et al. 2001). Thus, it came as no surprise when an automatic and observer-independent approach, namely voxel-based morphometry (VBM), was suggested as an ideal tool to investigate gray matter (GM) and © The Author 2013. Published by Oxford University Press. All rights reserved.
Cerebral Cortex October 2014;24:2541–2552 doi:10.1093/cercor/bht094
white matter (WM) architecture in large samples of in vivo collected brain scans (Ashburner and Friston 2000). In recent years, this method explores local differences in cortical struc-ture between groups that vary either as a function of learning-dependent plasticity (Golestani et al. 2007), life-span sensory deprivation (Penhune et al. 2003; Mühlau et al. 2006), or brain pathology (Vargha-Khadem et al. 1998;Watkins et al. 2002). Based on a voxel-by-voxel comparison methodology, the VBM approach allows researchers to identify global, regional, or local hemispheric differences in GM and WM within or between groups. In particular, studies employing the automated VBM technique are considered appropriate for revealing local structural cortical asymmetries in GM volume that reflect functional lateralization (Good et al. 2001;Watkins et al. 2001). Nevertheless, this proposal has been challenged, recently, primarily for methodological reasons. Notably, one should be aware that the vast majority of VBM-based studies rely on cortical volume (CV) as an anatomical marker for brain asymmetry. However, asPanizzon et al. (2009)recently argued, CV is the product of surface and thickness. Therefore, if these variables run in the opposite direction, CV measure-ments could be confounded and asymmetry measuremeasure-ments might be obscured. Among others, Lyttelton et al. (2009) empirically disentangled surface area measurements from the quantification of thickness. In sustenance of this view, Bermudez et al. (2009) demonstrated that the perisylvian brain anatomy of musicians vary as a function of the particu-lar measurement methodology being used (VBM vs. measure-ment of cortical thickness [CT]). These studies provide strong evidence that CV is confounded by the incompatibility of thickness and surface.
Cortical surface area (CSA) has increased enormously during the evolution of primates, while the thickness of the cortex has remained relatively constant. According to the radial unit hypothesis (Rakic 1988,1995), the amount of CSA possessed by a distinct area is driven by the number of columns; CT is influenced by the number and the size of cells within a column, packing density, as well as by the number of connections and the extent of their myelination (Rakic 1988; Eickhoff et al. 2005). Hence, we consider CT and CSA as neu-roanatomical traits, which must be measured separately, when investigating the neuroarchitecture of the human cortex and its asymmetry.
After considering the aforementioned issues, we decided to perform an MRI study that measures GM architecture in an ensemble of anatomically confined and distinct bilateral auditory-related regions in 104 human brains. For this purpose, we decided to apply an automated surface-based morphometric measurement with the FreeSurfer software (Dale et al. 1999; Fischl, Sereno, Dale 1999), which has several advantages over VBM measurements. First, it allows the separate analysis of CT, CSA, and CV. Secondly, it provides a complete set of predefined anatomical regions that guaran-tee precise anatomical assignment of results. Thirdly, the algorithm implemented in FreeSurfer allows a finer spatial accuracy at the subvoxel level. Furthermore, it has been shown that the SPM-based (Statistical Parametric Mapping, www.fil.ion.ucl.ac.uk/spm/) VBM approach falls victim to noise and mis-segmentation of GM, WM, and cerebrospinal fluid and is significantly affected by partial volume effects (Clarkson et al. 2011). By means of FreeSufer analysis tech-nique, a recent study has identified regional CV asymmetries
between the 2 hemispheres (Goldberg et al. 2013). As our particular interest targets the investigation of structural asym-metries in the auditory-related cortex, we selected 5 distinct regions of the auditory-related cortex. Akin to a former study bySigalovsky et al. (2006)who used the MR-based longitudi-nal relaxation rate (R1) to elaborate on myelin content of se-lected distinct auditory core and auditory association areas, we collected CV, CT, and CSA values from an ensemble of auditory-related regions, namely the HG, HS, lateral STG, PT, and PP. The following description of the aforementioned se-lected regions’ anatomical positions and borders are partly taken fromDestrieux et al. (2010, pp. 8–9).
HG or the transverse temporal gyrus accommodates the primary auditory cortex (Penhune et al. 1996;Morosan et al. 2001; Rademacher et al. 2001; Leonard et al. 2008). “It is a small swelling containing primary auditory cortex, just anterior and parallel to the transverse temporal sulcus” (Destrieux et al. 2010, p. 8). The initial level of the cortical processing of spoken language traverses here, before entering the next step involved in the hierarchical speech processing stream (Hickok and Poeppel 2007). A leftward volume asym-metry of the HG has been previously introduced bySchneider et al. (2002)andTakao et al. (2011).
HS or otherwise known as the transverse temporal sulcus “is an important landmark at the superior aspect of the tem-poral lobe since it divides the PT ( posteriorly) from the trans-verse temporal gyrus (anteriorly); it originates at the posterior segment of the lateral sulcus, runs anterior and lateral, and joins the lateral aspect of the temporal lobe” (Destrieux et al. 2010, p. 8). The PT adjoins the formation of the HG/HS caud-ally (Westbury et al. 1999).
“The PT is the part of the superior aspect of the STG, pos-terior to the transverse temporal sulcus” (Destrieux et al. 2010, p. 8). It mediates auditory and elemental speech proces-sing (Jancke et al. 2002;Zaehle et al. 2004;Price 2012) and has hence been dubbed the major “computational hub” for spectro-temporal analysis of acoustic signals (Griffiths and Warren 2002). Numerous studies have shown leftward volume and size asymmetry of the PT in humans (Geschwind et al. 1968; Chance et al. 2006; Dorsaint-Pierre et al. 2006; Takao et al. 2011) and in apes (Gannon et al. 1998).
The PP “is the part of the superior aspect of the STG located anterior to the transverse temporal gyrus. This flat area reaches the temporal pole anteriorly, and the parahippo-campal gyrus medially” (Destrieux et al. 2010, p. 8). Little is known about the particular function of the PP so far. Several neuroimaging studies that explicitly used auditory tasks report responses of the PP bilaterally (Meyer et al. 2000; Patterson et al. 2002;Warren et al. 2003;Brown et al. 2004; Baumann et al. 2007). To the best of our knowledge, data about volume, thickness, and surface area asymmetry of this cortical area in human brains have yet to be published.
The STG (or T1)“constitutes the temporal operculum and faces the frontal and parietal opercula. Its medial limits are: The inferior segment of the circular sulcus of the insula (ante-romedially) and the posterior segment of the lateral sulcus ( posteromedially). Its lateral limit was drawn on the “pial” view at the junction between the lateral and superior aspects of the STG” (Destrieux et al. 2010, p. 8). Here, our anatomical analysis focused on the lateral aspect of the STG, which “is the only part of the STG visible on the“pial” view and is con-nected posteriorly to the inferior parietal lobule” (Destrieux
et al. 2010, p. 9). The bilateral STG is recruited during non-primary auditory processing of speech and nonspeech sounds (Binder et al. 2000; Meyer, Zysset, et al. 2005;Zaehle et al. 2008). A leftward asymmetry of GM myelination in the STG has been reported bySigalovsky et al. (2006).
Even though the above-mentioned findings of leftward asymmetry in auditory-related cortical regions appear to paint a consistent picture, the relationship between adjacent auditory-related cortical regions has not yet been systemati-cally investigated. Thus, we present an investigation of the different aspects of GM architecture asymmetry (CV, CT, and CSA) in 5 auditory-related regions, as well as their interdepen-dence on one another. Previous studies claim that CV is a less appropriate parameter, for example, Panizzon et al. (2009, p. 2732) state,“measurements of GM volume conflate the con-tributions of thickness and surface area and therefore, may not capture the basic structural elements of the cerebral cortex.” Indeed, a study byWinkler et al. (2010, p. 1141) un-derlines that volume is strongly correlated with surface area and concludes“… that GM volume, which is a composite of 2 other traits (surface area and thickness), might not be the best choice.” Thus, we predict that we will find an independent relationship between CSA and CT. In addition, we expect that CSA will strongly predict CV. Furthermore, in agreement with foregoing functional studies, we expect tofind leftward asym-metric measurements in the CSA dedicated to speech-related auditory structures (Meyer, Zaehle, et al. 2005,Meyer, Zysset, et al. 2005), such as the PT (Jancke et al. 2002). We make these predictions because the amount of CSA is influenced by the number and spacing of neuronal columns. As indicated by Galuske et al. (2000)andRosen (1998), the spacing between columns as well as the sheer number of neurons account for the leftward asymmetry of posterior temporal regions. The leftward functional dominance of speech functions should be reflected by a structural substrate, namely the extension of distinct cortical portions. Furthermore, we expect to find an asymmetric relationship between the left and right CT. It is conceivable that the asymmetry index (AI) for CT could de-monstrate a rightward asymmetry, because the speech-related areas in the left superior temporal region might be thinner due to stronger myelineation (Sigalovsky et al. 2006; Sowell et al. 2007).
To contribute to the ongoing discussion about the exist-ence of sex differexist-ences in hemispheric asymmetry (Luders et al. 2004,2009;Im et al. 2006;Sowell et al. 2007;Leonard et al. 2008;Ihnen et al. 2009), we collected brain scans from a sufficiently large sample of male and female individuals. This enables us to run comprehensive and robust analyses, in order to test putative sex-related differences. Although some compu-tational neuroanatomy studies report differences in global and local perisylvian neuroarchitecture that varies as a function of sex (Im et al. 2006;Sowell et al. 2007), we do not anticipate discovering differences in asymmetry measurements, as we maintain that cortical asymmetry has evolved equally in men and women for the sake of lateralized auditory functions.
Materials and methods Participants
Fifty-two women with a mean age of 26.2 years (SD: 8.0 years) and 52 men who were matched for both age (28.3 ± 7.1 years) and
handedness participated in this study. Given that most of the partici-pants in both groups had attended university, their years of education were closely matched. According to the Annett handedness inventory (Annett 1970), all participants were consistently right-handed. All par-ticipants declared that they had no history of neurological, neuropsy-chological, or psychiatric disease, and that they did not use drugs or take medication. Each volunteer gave informed written consent. The local ethics committee (SPUK, Medical School, University Hospital of Zurich) approved this study.
MRI Data Acquisition
MRI scans were acquired using a 3.0-T Philips Intera whole-body scanner (Philips Medical Systems, Best, The Netherlands), which is equipped with a transmit-receive body coil and a commercial 8-element sensitivity-encoding (SENSE) head coil array. A volumetric 3-dimensional (3D) T1-weighted gradient-echo sequence (turbo field echo) scan with a spatial resolution of 0.86 × 0.86 × 0.75 mm (matrix 256 × 256 pixels, 180 slices) was conducted for each of the 104 partici-pants. Further imaging parameters were: Field of view = 220 × 220 mm, echo time = 2.3 ms, repetition time = 20 ms,flip angle (α) = 20°.
Surface-Based Morphometry
The reconstruction of cortical surface and volumetric segmentation were performed with the FreeSurfer image analysis suite (version 4.1.0). This software is documented online and is available for down-load free of charge (http://surfer.nmr.mgh.harvard.edu/). The techni-cal details of these procedures are described in prior publications (Dale et al. 1999; Fischl, Sereno, Dale 1999;Fischl, Sereno, Tootell, et al. 1999;Fischl et al. 2001,2002;Fischl, Salat, et al. 2004). Briefly, the 3D structuralT1-weighted MRI scan was used to construct models of each volunteer’s cortical surface in order to measure brain anatomy traits, such as CT, CSA, and CV. This is a fully automated procedure that involves segmentation of the cortical WM (Dale et al. 1999), tes-sellation of the GM/WM junction, inflation of the folded surface tessel-lation patterns (Fischl, Sereno, Dale 1999), and automatic correction of topological defects in the resulting manifold (Fischl et al. 2001). This surface is then utilized as the starting point for a deformable surface algorithm that is designed to find the gray/white and pial (GM/cerebrospinal fluid) surfaces with submillimeter precision (Fischl and Dale 2000). The procedures for measuring CT have been validated against histological analysis (Rosas et al. 2002) and manual measurements (Kuperberg et al. 2003;Salat et al. 2004). This method uses both intensity and continuity information from the surfaces in the deformation procedure in order to interpolate surface locations for regions in which the MRI image is ambiguous (Fischl and Dale 2000). For each participant, CSA and CT of the cortical ribbon were computed on a uniform grid (comprised by vertices). CT is defined by the shortest distance between the gray/white and pial surface models. The thickness maps produced are not limited to the voxel resolution of the image and are thus sensitive to submillimeter differ-ences between any groups at issue (Fischl and Dale 2000). Thickness, surface area, and volume measures were mapped to the inflated surface of each participant’s brain reconstruction, thus allowing the visualization of data across the entire cortical surface (i.e. gyri and sulci) without the data being obscured by cortical folding. Each par-ticipant’s reconstructed brain was then morphed to an average spheri-cal surface representation that optimally aligned sulspheri-cal and gyral features across participants (Fischl, Sereno, Tootell, et al. 1999). This procedure provides accurate matching of morphologically homolo-gous cortical locations among participants on the basis of each indi-vidual’s anatomy, while nevertheless minimizing metric distortions.
The cerebral cortex was parcellated into units based on the gyral and sulcal structure (Fischl, van der Kouwe, et al. 2004;Desikan et al. 2006;Destrieux et al. 2010) and a variety of surface-based data, in-cluding maps of CV, CT, and CSA, were created.
Cortical Parcellation of Auditory-Related Brain Areas
One of FreeSurfer’s implemented parcellation schemes (aparc.a2005s) was used to compute total CT, total CSA, and total CV in 154
anatomical structures across both cortical hemispheres (Destrieux et al. 2010). From these 154 anatomical structures, the following auditory-related brain regions were selected: HG, HS, PT, PP, and the lateral aspect of STG (Fig.1).
Statistical Analysis
Statistical analyses were performed to test for global sex-related differ-ences, as well as both global and local patterns of neuroanatomical asymmetry for the pooled sample. First, we compared the global ar-chitectonic measures of women with those of men by using analysis of covariance models with total intracranial volume as covariates of no interest. Secondly, we tested for sex-related differences in asymme-try in whole-brain measurements. Thirdly, we calculated differences between the left and right measurements of global CV, CT, and CSA for the total sample. Fourthly, for each neuroanatomical trait, we com-pared architectonic measures of the left hemispheric structure with those of the right hemispheric homolog using pairedt-tests for each individual ROI. Furthermore, an AI according to the formula AI = ( left− right)/(left + right) was calculated for each ROI and for each trait. After which we applied 1-samplet-tests against zero to test for significant asymmetry. To explore the relationship between the regions and the traits, we utilized a comprehensive correlation analy-sis. Accordingly, we correlated the AI between all ROIs for each trait individually. Finally, we separately analyzed the correlation of AIs between all traits for each region. Where appropriate, the Bonferroni procedure was applied in order to correct error probability for mul-tiple comparisons.
Results
Age and global brain anatomy traits are summarized in Table 1. There is no statistically significant age difference between women and men (P = 0.21). The results portray several differences between male and female brains in global
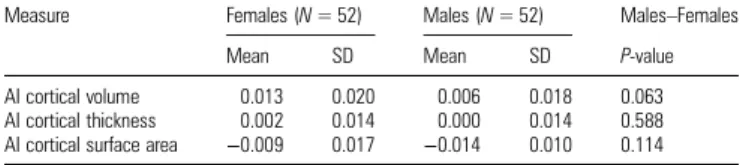
neuroanatomical parameters. In particular, male brains de-monstrate a larger global surface area in both the left and right hemispheres. However, according to our predictions, we found no global significant differences of structural asymme-try between male and female brains (cf. Table 2). Thus, we proceeded with statistical analyses based on local indices of asymmetry that are pooled across participants’ sex.
Table3summarizes the global measurement of cortical pa-rameters for the pooled sample. The table displays the calcu-lations of hemispheric measurements of CV, CT, and CSA. We also tested for differences between the left and right hemisphere and consequently observed a significant (Bonferroni cor-rected) leftward asymmetry for total CV (P << 0.0001) and a rightward asymmetry for total CSA (P << 0.0001).
With respect to selected regions of the auditory-related cortex, we noted CSA, which was pooled across sex, to be in-creased in the left (compared with the right) HG, HS, PT, and STG. No significant asymmetry is noted for the PP. Analysis of CT traits reveals a significant rightward asymmetry for HG and HS and a leftward asymmetry for PP. Akin to surface area measurement, the calculation of CV results in leftward asym-metry for HG, PT, and STG (cf. Table4). Thesefindings indi-cate that CT and CSA should actually be considered as independent traits (Fig.2).
Furthermore, we assessed whether the asymmetry of a region depends on the asymmetry of its neighboring regions (cf. Table 5) and performed correlation analyses of AI between all 5 regions. With respect to thickness and volume, STG and PT are significantly lateralized towards the left. No correlations between adjoining regions were found for CSA.
Figure 1. Parcellation scheme of 5 selected auditory-related brain areas projected onto the inflated surface of FreeSurfer’s average template (rotated by 50°, to enable a better view on the supratemporal plane).
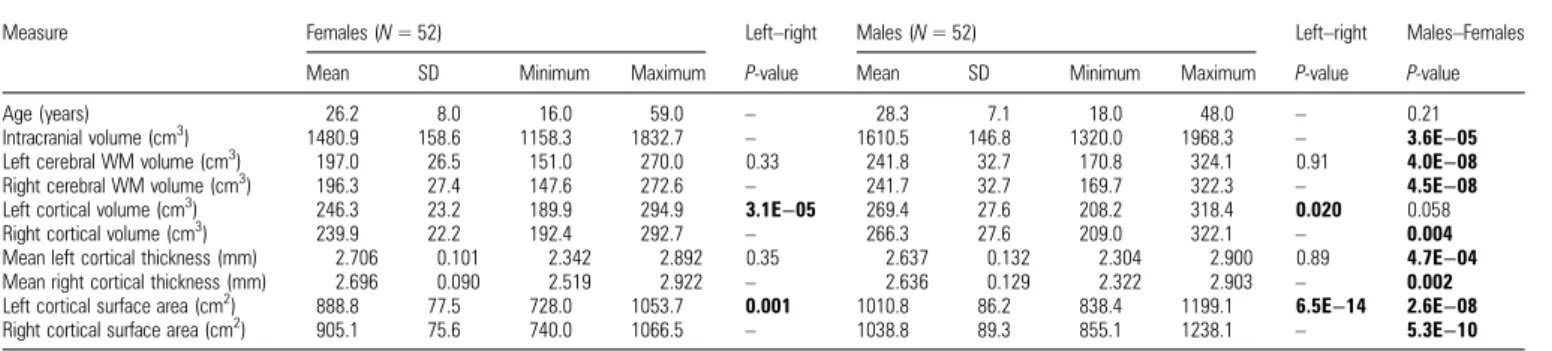
Table 1
Demographic data and global neuroanatomical traits are presented separately for male (N = 52) and female (N = 52) participants
Measure Females (N = 52) Left–right Males (N = 52) Left–right Males–Females Mean SD Minimum Maximum P-value Mean SD Minimum Maximum P-value P-value Age (years) 26.2 8.0 16.0 59.0 – 28.3 7.1 18.0 48.0 – 0.21 Intracranial volume (cm3
) 1480.9 158.6 1158.3 1832.7 – 1610.5 146.8 1320.0 1968.3 – 3.6E−05 Left cerebral WM volume (cm3
) 197.0 26.5 151.0 270.0 0.33 241.8 32.7 170.8 324.1 0.91 4.0E−08 Right cerebral WM volume (cm3
) 196.3 27.4 147.6 272.6 – 241.7 32.7 169.7 322.3 – 4.5E−08 Left cortical volume (cm3
) 246.3 23.2 189.9 294.9 3.1E−05 269.4 27.6 208.2 318.4 0.020 0.058 Right cortical volume (cm3
) 239.9 22.2 192.4 292.7 – 266.3 27.6 209.0 322.1 – 0.004 Mean left cortical thickness (mm) 2.706 0.101 2.342 2.892 0.35 2.637 0.132 2.304 2.900 0.89 4.7E−04 Mean right cortical thickness (mm) 2.696 0.090 2.519 2.922 – 2.636 0.129 2.322 2.903 – 0.002 Left cortical surface area (cm2
) 888.8 77.5 728.0 1053.7 0.001 1010.8 86.2 838.4 1199.1 6.5E−14 2.6E−08 Right cortical surface area (cm2
) 905.1 75.6 740.0 1066.5 – 1038.8 89.3 855.1 1238.1 – 5.3E−10 P-values in bold indicate statistical significance (P < 0.05).
Table 6 depicts results produced by a correlation analysis of AIs between measurements for distinct ROIs. These calcu-lations resulted in significant correlations between CT and CV in 4 of 5 ROIs (HG, HS, PT, and STG). Significant correlation values between CSA and CV are observed for all 5 ROIs. No significant correlations between CSA and CT were found. In 3 of 5 regions (HG, HS, and PP), we found a negative relation-ship between CT and CSA. Even though the correlation is not significant after applying a correction, we note that the uncor-rectedP-value of the negative correlation between CT and CS
for the HS and PP is actuallyP < 0.05. This pattern functions as additional evidence that CT and CSA are negatively related or are at least independent traits.
Discussion
Based on an automated surface-based morphometry approach (Dale et al. 1999;Fischl et al. 2002), the present study delin-eates local asymmetries of CV, CT, and CSA in 5 auditory-related perisylvian regions, namely HG, HS, PT, PP, and lateral STG. This study consists of 3 goals. First of which is to provide a comprehensive description of structural asymme-tries of auditory-related cortical regions. Second of which is to critically discuss the empirical validity of how CV is both measured and interpreted as an appropriate neuroanatomical trait for investigating morphological brain asymmetry. The third goal is to contribute to the ongoing discussion about sex-related differences in the auditory-related regions that are crucially involved in speech processing. Relating the present findings of local structural asymmetries to potential functional differences between the left and right auditory-related cortical regions would be interesting; however, the question remains as to whether cognitive and sensory processes should indeed be mapped onto macroanatomy. Recent publications have de-monstrated that higher-level cognitive processes, when com-pared with lower-level sensory functions, such as auditory perception, are less reliably linked to macroanatomically dis-tinct and confined cortical regions (Frost and Goebel 2012; Tahmasebi et al. 2012). Since the data regarding structural asymmetries do not provide a solid foundation for the discus-sion of potential relationships between speech functions and specific findings of asymmetries in thickness and surface area, we will refrain from speculating about a relationship between this work’s results and the functional architecture of language.
Most importantly, our analyses demonstrate a consistent and reliable pattern of the relationships between CT, CSA, and
Table 3
Demographic data and global neuroanatomical traits are pooled across all participants (N = 104), irrespective of sex.
Measure Pooled sample (N = 104) Left–right Mean SD Minimum Maximum P-value Age (years) 27.1 7.4 16.0 59.0 – Intracranial volume (cm3
) 1545.7 165.5 1158.3 1968.3 – Left cerebral WM volume (cm3
) 219.4 37.2 151.0 324.1 0.49 Right cerebral WM volume (cm3
) 219.0 37.7 147.6 322.3 – Left cortical volume (cm3
) 257.9 27.9 189.9 318.4 3.2E−06 Right cortical volume (cm3
) 253.1 28.2 192.4 322.1 – Mean left cortical thickness (mm) 2.671 0.122 2.304 2.900 0.44 Mean right cortical thickness (mm) 2.666 0.115 2.322 2.922 – Left cortical surface area (cm2
) 949.8 102.0 728.0 1199.1 2.7E−13 Right cortical surface area (cm2
) 972.0 106.3 740.0 1238.1 – P-values in bold indicate statistical significance (P < 0.05).
Table 2
Global AIs of brain anatomy traits, namely CV, CT, and CSA, are presented separately for male (N = 52) and female (N = 52) participants
Measure Females (N = 52) Males (N = 52) Males–Females Mean SD Mean SD P-value AI cortical volume 0.013 0.020 0.006 0.018 0.063 AI cortical thickness 0.002 0.014 0.000 0.014 0.588 AI cortical surface area −0.009 0.017 −0.014 0.010 0.114
Table 4
Mean values for neuroanatomical traits in the left and right auditory-related cortical regions
Pooled sample (N = 104) P-value Effect size AI Left hemisphere Right hemisphere >0 = left
Mean SD Mean SD <0 = right
Cortical volume (mm3
)
Heschl’s gyrus 1105 266 872 220 8.1E−16 0.947 0.12
Heschl’s sulcus 532 120 498 130 0.029 0.218 0.04
Planum temporale 2157 601 1797 525 6.2E−08 0.575 0.09
Planum polare 1624 403 1627 448 0.95 −0.006 0.002
Superior temporal gyrus 6616 1323 5693 1025 7.0E−14 0.876 0.07 Cortical thickness (mm)
Heschl’s gyrus 2.43 0.28 2.53 0.29 3.7E−04 0.361 −0.02 Heschl’s sulcus 2.56 0.33 2.94 0.37 5.7E−15 −0.899 −0.07
Planum temporale 2.74 0.22 2.76 0.27 0.35 −0.092 −0.004
Planum polare 3.48 0.41 3.26 0.37 5.2E−09 0.628 0.03
Superior temporal gyrus 3.27 0.22 3.21 0.28 0.018 0.242 0.01 Cortical surface area (mm2
)
Heschl’s gyrus 452 95 344 76 1.3E−21 1.211 0.14
Heschl’s sulcus 209 48 171 46 4.8E−10 0.675 0.10
Planum temporale 780 212 649 173 1.5E−08 0.609 0.09
Planum polare 467 107 497 121 0.028 −0.219 −0.03
Superior temporal gyrus 1983 352 1728 262 4.4E−15 0.941 0.07 Note: The table shows results of pairedt-tests, effect sizes, and AI for the comparison between mean values. Results are corrected for multiple comparisons (nominal P = 0.05, Bonferroni corrected P = 0.05/5 = 0.01).
CV. We observed that mean values of CSA and CT asymmetry in auditory-related regions are independent, while both CT and CSA asymmetry partially correlate with CV measure-ments. Thesefindings pose serious implications for the reeva-luation of previous morphological studies, which based their interpretations on CV—a combined measurement of CT and CSA. In the following discussion, we start by exploring this issue in light of ourfindings related to structural asymmetries in auditory-related areas. Subsequently, we discuss local asymmetries and their potential implications for functional lateralization.
Global Asymmetries
To evaluate the impact of global measurements on local asym-metries, we compared global CV, CT, and CSA measurements between the left and right hemisphere. The sole significant differences are found for CV (leftward asymmetry) and CSA
(rightward asymmetry). We shall refrain from interpreting the global leftward asymmetry in CV as our paper outlines why it is disadvantageous to interpret CV, when compared with CT and CSA. Our findings of global rightward CSA asymmetry conflict with the observation of local leftward CSA asymmetry in auditory-related cortical regions. Hence, we do not argue that our results regarding local asymmetry are biased by global patterns in asymmetry.
Relationship Between CV, CT, and CSA
How neuroanatomical traits are frequently used in present computational neuroanatomy is a critical issue. While the analysis of CV has long been viewed as the“gold-standard” in computational neuroanatomy, recent publications suggest an alternative approach. As apparent from Table6, CSA and CV show a significant positive correlation, whereas the corre-lation between CT and CV is statistically less prominent suggesting a complex relationship between these traits; this pattern of results challenges the present understanding of CV as an ideal marker. One may wonder how the relationship between CSA and CT can be described. Intuitively, one would assume that CSA and CT might run into opposite directions. A larger surface might function to house a greater number of WM afferents, but this could be at the expense of CT. Indirect evidence for this view was provided by a postmortem study that measured a greater posterior superior temporal lobe WM volume in the left compared with the right hemisphere (Anderson et al. 1999). An additional postmortem study re-ported a thinner and longer cortex in the left PT with the con-tralateral area demonstrating a shorter and thicker cortex (Harasty et al. 2003). Differential developmental lines may explain this difference because in order to house the greater volume of regional WM the left PT expands tangentially in volume and becomes both larger in area and thinner. Accord-ing toHarasty et al. (2003, p. 257), these particular differences between left and right auditory-related cortex architecture may have functional implications: “in this case specific to speech perception.” Because of the larger stretching of neur-onal columns in the left PT, they are more widely spaced apart; this might correspond to a better differentiation of Figure 2. Schematic illustration of AIs for neuroanatomical traits, namely CV, CT, and
CSA (horizontal lines indicate the 95% confidence interval; asterisks denote a significant asymmetry at P < 0.05).
Table 5
Results of correlation analyses between adjacent regions for differential neuroanatomical traits
Heschl’s gyrus P-value Heschl’s sulcus P-value Planum temporale P-value Planum polare P-value Cortical volume
Heschl’s gyrus
Heschl’s sulcus −0.059 0.553
Planum temporale 0.05 0.611 −0.121 0.219
Planum polare 0.042 0.671 −0.022 0.824 0.174 0.077
Superior temporal gyrus 0.037 0.713 0.09 0.362 0.330 0.001 0.165 0.093 Cortical thickness
Heschl’s gyrus
Heschl’s sulcus 0.217 0.027
Planum temporale 0.088 0.375 0.131 0.183
Planum polare −0.113 0.255 0.145 0.143 0.009 0.932
Superior temporal gyrus −0.097 0.329 −0.18 0.067 0.303 0.002 −0.034 0.732 Cortical surface area
Heschl’s gyrus
Heschl’s sulcus 0.117 0.239
Planum temporale 0.103 0.298 0.023 0.819
Planum polare 0.089 0.37 −0.006 0.953 0.183 0.062
Superior temporal gyrus −0.015 0.882 0.196 0.046 0.222 0.024 0.097 0.327 Note: Results are corrected for multiple comparisons (nominalP = 0.05, Bonferroni corrected P = 0.05/5 = 0.01).
incoming signals. Columns found on the right auditory-related cortex may act together in sets under some circumstances because their functional units exhibit reduced spacing (Harasty et al. 2003). This result holds for the PT only and needs verification for a larger number of auditory-related regions. Other neuroimaging studies also noticed that mean values of thickness and surface area are independent, which indirectly supports the findings of Harasty and colleagues (Panizzon et al. 2009). In addition, Hogstrom et al. (2012, p. 1) reason that“regional increases in surface area during the ontogeny may be driven or facilitated by plastic processes in-ducing cortical thinning, suggesting regional negative corre-lations between area and thickness originating from early childhood.” In their study, significant negative relationships between CT and CSA were found in several brain regions, but were absent in the auditory-related regions. This observation concurs with our pattern of results. Similarly, Winkler et al. (2010)examined the relationship between CSA and CT in a number of predefined regions in the adult human brain and reported only weak or a total absence of correlations between these 2 structural neuromarkers. They thereby concluded: “surface area and CT measurements should be considered separately” (p. 1135). Thus, CSA “is distinct from CT in its contribution in volume” (Eyler et al. 2011, p. 2313). Our results are in line with previous observations, which consider CV as a less ideal marker for anatomical measurements, because it is the product of 2 independent factors.
Neuroanatomical Relationship Between Auditory-Related Regions
Another of our a priori assumptions pertained to the direct relationship between anatomical asymmetry and cortical regions that reside beside one another. It is plausible that neighboring regions of the auditory-related cortex demon-strate the same patterns of asymmetry, as is portrayed in Table5, in the form of a correlation between the neighboring regions of PT and the lateral STG, and the traits CT and CV. It is not surprising that directly adjoining cortical areas demon-strate equivalent patterns of morphological asymmetry. However, this result is not compelling and systematic evi-dence for our initial assumption. Perhaps, the reasoning about the similar pattern of cortical architecture occurring in auditory-related areas should be abandoned.
Theoretical Embedding of Present Results
According to our data, CSA and CT should be considered in-dependent neuroanatomical traits that are likely to be in flu-enced by different factors during brain development (Frye et al. 2010). In agreement with this view, Panizzon et al.
(2009)propose that CSA and CT have different origins. While CSA increases during late fetal development due to cortical folding, CT alters dynamically across the entire life span as a consequence of training, experience, and disease. A compre-hensive explanation for the independent status of CSA and CT is provided by the “radial unit hypothesis” (Rakic 1988, 2000), which considers the cortical column as a fundamental unit of cortical architecture. All cells within a vertical column have a common origin and migrate to their final destination during prenatal development (Rakic 1995). The radial unit hypothesis further postulates that the size of CSA is deter-mined by the number of vertical columns, whereas the CT is driven by the number of neurons within each column. Thus, the radial unit hypothesis also outlines why the human ce-rebral cortex has expanded that much more immensely during phylogeny than size of the cortical sheet in other animals (Rakic 2009). During evolution, there has been an “expansion of cortical surface without the expansion of corti-cal width” (Rakic 2007, p. 213). Not only phylogeny plays a role, “ontogenetic increases in CV are largely driven by in-creasing gyrification and associated surface area expansion rather than increased CT” (Hogstrom et al. 2012, p. 1). In more detail,Rakic (2007, p. 214) describes the independent development of CSA and CT:“The increase in the number of founder cells lead to larger number of radial columns (…). In contrast, over-expression of cyclin-dependent kinase (cdk) inhibitor, p27, increases the production of neurons that form radial columns, thus increasing the thickness of the superficial layers of the cortex, without increasing its surface area.” Taken together, the radial unit hypothesis provides a reason-able framework, which buttresses our conclusion that there is an independent relationship between CSA and CT in the auditory-related cortex.
Our finding of larger CSA and thinner CT in the left auditory-relatedfields, as well as results from other volumetric studies can be aligned with recent microscopicfindings. Ac-cording to Chance et al. (2006, p. 1041), the asymmetry of CSA in the posterior supratemporal plane “is a function of minicolumn spacing” in that “minicolumn spacing and mini-column number were greater” in the left auditory-related regions. Along these lines,Hutsler and Galuske (2003, p. 433) propose that wider spacing between neuronal microcolumns could be an“important advantage of the left hemisphere for extracting crucial temporal information from the incoming stream of auditory inputs and, thus, analyzing these inputs under different conditions than the right hemisphere.” More specifically, larger CSA of posterior auditory-related areas in the left hemisphere“may be related to the temporal demands of auditory processing” (Hutsler and Galuske 2003, p. 238). The lateralized processing of auditory cues that comprised different temporal duration and spectral complexity evident in an array of functional imaging studies are interpreted as being a function of the structural microanatomical asymmetry of auditory-related cortical areas (Zatorre and Belin 2001; Jamison et al. 2006).
Apparently, apes and monkeys do not show this micro-scopic difference (Buxhoeveden et al. 2001), which may im-plicate a particular involvement of these regions in speech processing. Supporting evidence comes from data demon-strating interhemispheric differences in the microcircuitry ar-chitecture of the posterior portion of the STG (Galuske et al. 2000; Hutsler and Galuske 2003). These differences are
Table 6
Results of correlation analyses between differential neuroanatomical traits for 5 superior temporal regions are presented separately
CV × CT P-value CT × CSA P-value CV × CSA P-value Heschl’s gyrus 0.313 0.001 −0.135 0.173 0.895 1E−37 Heschl’s sulcus 0.293 0.003 −0.199 0.043 0.876 4E−34 Planum temporale 0.372 1E−4 0.065 0.515 0.947 3E−52 Planum polare 0.164 0.097 −0.205 0.037 0.928 2E−45 Superior temporal gyrus 0.448 2E−6 0.036 0.716 0.904 2E−39 Note: Results are corrected for multiple comparisons (nominalP = 0.05, Bonferroni corrected P = 0.05/10 = 0.005).
present in the form of neuronal clusters that are more widely spaced in the left STG and which exhibit subsystems that are 30% more distinct within the same volume of tissue, com-pared with the contralateral area. According toGaluske et al. (2000, p. 1949),“these subsystems are tuned to different fea-tures (…).” Analogous to the visual cortex, “more feature domains could be represented in the left than in the right area 22 without reduction in the number of neurons devoted to a particular feature. This, then, is likely to permit a more fine-grained analysis of feature domains, and we propose that this is related to special functions of auditory processing such as are required, e.g. for the analysis of speech.” First, neuronal columns, which are spaced more widely apart, can process over-learned phonetic patterns that are extracted from the in-flowing speech signal more efficiently and automatically, since this specific architecture is proficient at storing and re-cognizing frequent spectro-temporal acoustic patterns. Sec-ondly, larger number of columns in the left HG and PT as observed by Chance et al. (2006) help explain the leftward CSA asymmetry exhibited by our research participants in the HG, STG, and PT regions. This leftward PT asymmetry exists at the prenatal age of 29–31 weeks (Steinmetz 1996), that is, before cortical folding isfinalized (Dubois et al. 2008). This fact begs the question of whether asymmetry in the human perisylvian architecture encompasses a strong genetic disposi-tion, and whether it is specifically designed this way, in order to enable humans to juggle acoustic speech signals compris-ing differential spectro-temporal complexity.
Supporting evidence for this view comes from a study that reports a leftward asymmetry of anterior and posterior perisyl-vian regions, which are already present in humans at 26–36 gestational weeks of age (Dubois et al. 2010).
Is a Thinner Cortex a“Better” Cortex?
In the present study, we observe a significantly thicker cortex in the right HG and HS, as well as thicker cortex in the left PP, when compared with the right hemisphere. Intuitively, one may assume that a thicker cortex is more proficient as it consists of additional GM, which may provide enhanced com-putational power. Atfirst sight, this reasoning may imply that abundant computational resources are functionally advan-tageous. However, does this reasoning genuinely sanction the conclusion that a thick(er) cortex is a “better” cortex? Although the notions of“better” and “worse” are not helpful when one’s reasoning pertains to cortical functioning, it is ap-parent that, under certain circumstances, a thicker cortex is associated with advantageous functioning. A structural MRI study concerning sex-related GM differences (Luders et al. 2005) consists of arguments along these lines. According to their results, numerous cortical regions demonstrate signi fi-cantly stronger GM concentration in female brains compared with male brains, even when total brain size is corrected for. The authors assume that the GM increase observed in cortical areas that are associated with language functions, namely the left posterior STG and the left posterior inferior frontal gyrus, which were only demonstrated in female participants,“might be related to the improved language skills previously reported in females” (Luders et al. 2005, p. 500). However, this as-sumption has, as of late, been seriously called into question. Evidence offering support for an opposing view comes from a combined structural and functional MRI study that observed
an inverse relationship between thickness and blood oxygen level-dependent-related responses in fronto-parietal areas during a written language task (Lu et al. 2009). Similarly, a study that combines neurophysiological measurements with structural MRI discovered that the amplitude of the auditory evoked N1 component correlates negatively with CT in the right auditory-related cortex (HS and lateral HG; Liem et al. 2012). In opposition to the view ofLuders et al. (2005), the authors of the EEG and structural MRI paper suggest that a thinner cortex might correspond to a slender yet efficient neural organization that is formed postnatally as a function of learning-dependent plasticity.
Albeit the absence of functional data in our study, this con-troversial issue should nevertheless be briefly addressed in the context of ourfindings. The question whether “thicker” or “thinner” is better cannot be straightforwardly answered (Sowell et al. 2007). As a matter of fact,“thicker” or “thinner” can only be discussed when 2 regions, groups, or hemi-spheres are compared. Therefore, this question needs to be carefully embedded in the context comprising each individual study. Accordingly, Sowell et al. (2004) observed cortical thickening of 0.05–0.2 mm of GM per year in the left and right perisylvian cortices in a group of participants ranging in age from 5 to 11 years. Certainly, this thickening must be con-sidered as a normal step in brain maturation. However, there is no doubt that this maturational cortical thickening is accompanied by the children’s increasing cortical functioning. During adolescence and adulthood, a genetically driven de-crease of cortical GM density can be noted (Giedd et al. 2006; Li et al. 2012;van Soelen et al. 2012). This thinning is prob-ably attributable to increased proliferation of myelin into the periphery of the cortical neuropil and should also be con-sidered as a normal developmental alteration. However, Sowell and colleagues emphasize that cortical thinning during this period of life “is probably not entirely caused by a reduction in the size or number of neuron cell bodies or their synaptic processes (as might be the case in normal aging)” (2004, p. 8229).
In the present study, we report differences in CT of the left and right supratemporal regions. As apparent in Table 4, the right auditory cortex is significantly thicker than the contralat-eral portion. In agreement with other research groups (Sowell et al. 2004;Sigalovsky et al. 2006;Brauer et al. 2010), we con-jecture that an asymmetric increase of WM volume, that is, in-creased myelination during cortical maturation in the left auditory cortex may account for this difference since GM has been replaced by WM, in order to establish denser connections between primary and secondary auditory regions and posterior Sylvian speech-related areas. Still, this presumption remains vague without comprehensive analysis of CT and CSA in com-bination with complementary WM measurements. Based on the present data, we cannot conclude whether a“thinner” or a “thicker” auditory cortex can be considered “better.”
Sex-Related Differences
Putative differences in neuroanatomical indications that may vary as a function of biological sex have been a matter of several investigations. While there is some evidence that male and female human brains differ in global cortical complexity (Luders et al. 2004,2006,2009) and global CV (Lv et al. 2010; Takahashi et al. 2011), serious problems arise when one
wishes to draw conclusions about alleged intersex differences in single distinct regions. According toLeonard et al. (2008), the influence of individual differences in brain volume is un-derestimated and may account for the observed sexual di-morphism. With respect to the perisylvian cortex, an alternative explanation may be provided by the observations of Toro and colleagues. They report that larger human brains have disproportionally more surface area than smaller brains, irrespective of biological sex (Toro et al. 2008). In other words, this bias may play a role when researchers compare male brains with female brains, in that, the surface area of male brains is assessed as being larger. Corroborating evi-dence for this point of view comes from a study, which showed that the cortical geometry of a larger brain is not simply a scaled-up version of a small brain (Im et al. 2008), but that in larger brains the increase of cortical GM surface area is driven by increased sulcal convolution.
While some recent computational neuroanatomy studies have not observed sex-related GM differences in auditory-related regions (Tamnes et al. 2010;Takao et al. 2011), other studies provide empirical support for the notion of sex-related differences in local language-related portions of the brain. For example, Im et al. (2006) evidenced greater CT in female brains in bilateral caudal STG. Sowell et al. (2007) observed more pronounced thickness in female brains at both temporal and parietal sites, irrespective of age and body size. However, none of these studies thoroughly investigated the measure-ments of asymmetry between male and female brains in the auditory cortex. Keeping this in mind, we are inclined to con-clude that sexual dimorphism should not be considered as a key and should be regarded as an ignorable variable in the context of our study.
Limitations
An investigation that only focuses on asymmetries in GM ar-chitecture is not complete. Of course, it would have been ben-eficial to additionally quantify potential asymmetries of WM fiber tracts, in order to achieve a comprehensive picture of the local relationship between GM and WM measurements. WM primarily consists of myelinated axonal fibers and un-doubtedly plays an essential role in the integration of in flow-ing and outflowing information between distinct anterior and posterior auditory-related areas (Sigalovsky et al. 2006; Barrick et al. 2007;Makris and Pandya 2009). One study that mapped and evaluated both cortical development and WM maturation reports a negative correlation between WM volume and CT in 24 of 33 investigated regions (Tamnes et al. 2010). This result may complement our data as it suggests that asymmetric prominence of WMfibers in left (or right) su-pratemporal regions may come at the expense of CT.
Conclusions
In summary, our present approach provides evidence for structural asymmetries of several distinct auditory-related regions in the human brain. CSA measurements indicate a strong leftward asymmetry in 4 of the 5 selected regions. This result obviously reflects the existence of a larger number of cortical columns, which might be more widely spaced apart. This neural pattern may be related to the supremacy of the left auditory-related region for decoding rapid acoustic
modulations during speech perception. A rightward asymme-try could be observed for CT in only the primary and second-ary auditory cortex. Generally, our finding points to an independent relationship between these 2 anatomical markers. Based on our results, we suggest that CV might be considered as a less suitable indicator for anatomical asymme-tries since this variable is a product of CSA by CT.
Funding
This research was supported by the Swiss National Foun-dation (grant no. 320030-120661 to M.M.) and by the“Fonds zur Förderung des akademischen Nachwuchses” (FAN) des “Zürcher Universitätsvereins” (ZUNIV).
Notes
We are indebted to Sarah McCourt-Meyer, James Perry Kast, and three anonymous reviewers for their helpful comments on an earlier version of this manuscript.Conflict of Interest: None declared.
References
Anderson B, Southern BD, Powers RE. 1999. Anatomic asymmetries of the posterior superior temporal lobes: a postmortem study. Neuropsychiatry Neuropsychol Behav Neurol. 12:247–254. Annett M. 1970. A classification of hand preference by association
analysis. Br J Psychol. 61:303–321.
Ashburner J, Friston KJ. 2000. Voxel-based morphometry—the methods. Neuroimage. 11:805–821.
Barrick TR, Lawes IN, Mackay CE, Clark CA. 2007. White matter pathway asymmetry underlies functional lateralization. Cereb Cortex. 17:591–598.
Baumann S, Koeneke S, Meyer M, Lutz K, Jancke L. 2007. A network for audio-motor coordination in skilled pianists and non-musicians. Brain Res. 1161:65–78.
Beaton AA. 1997. The relation of planum temporale asymmetry and morphology of the corpus callosum to handedness, gender, and dyslexia: a review of the evidence. Brain Lang. 60:255–322. Bermudez P, Lerch JP, Evans AC, Zatorre RJ. 2009. Neuroanatomical
correlates of musicianship as revealed by cortical thickness and voxel-based morphometry. Cereb Cortex. 19:1583–1596.
Binder JR, Frost JA, Hammeke TA, Bellgowan PSF, Springer JA, Kaufman JN, Possing ET. 2000. Human temporal lobe activation by speech and nonspeech sounds. Cereb Cortex. 10:512–528. Brauer J, Anwander A, Friederici AD. 2010. Neuroanatomical
prere-quisites for language functions in the maturing brain. Cereb Cortex. 21:459–466.
Brown S, Martinez MJ, Hodges DA, Fox PT, Parsons LM. 2004. The song system of the human brain. Brain Res Cogn Brain Res. 20:363–375.
Buxhoeveden DP, Casanova M. 2000. Comparative lateralisation pat-terns in the language area of human, chimpanzee, and rhesus monkey brains. Laterality. 5:315–330.
Buxhoeveden DP, Switala AE, Litaker M, Roy E, Casanova MF. 2001. Lateralization of minicolumns in human planum temporale is absent in nonhuman primate cortex. Brain Behav Evol. 57:349–358. Chance SA, Casanova MF, Switala AE, Crow TJ. 2006. Minicolumnar
structure in Heschl’s gyrus and planum temporale: asymmetries in relation to sex andfiber number. Neuroscience. 143:1041–1050. Clarkson MJ, Cardoso NJ, Ridgway GR, Modat M, Leung KK, Rohrer
JD, Fox NC, Ourselin S. 2011. A comparison of voxel and surface based cortical thickness estimation methods. Neuroimage. 57:856–865. Da Costa S, van der Zwaag W, Marques JP, Frackowiak RS, Clarke S, Saenz M. 2011. Human primary auditory cortex follows the shape of Heschl’s gyrus. J Neurosci. 31:14067–14075.
Dale AM, Fischl B, Sereno MI. 1999. Cortical surface-based analysis. I: segmentation and surface reconstruction. Neuroimage. 9:179–194.
Desai R, Liebenthal E, Possing ET, Waldron E, Binder JR. 2005. Volu-metric vs. surface-based alignment for localization of auditory cortex activation. Neuroimage. 26:1019–1029.
Desikan RS, Segonne F, Fischl B, Quinn BT, Dickerson BC, Blacker D, Buckner RL, Dale AM, Maguire RP, Hyman BT et al. 2006. An automated labeling system for subdividing the human cerebral cortex on MRI scans into gyral based regions of interest. Neuro-image. 31:968–980.
Destrieux C, Fischl B, Dale A, Halgren E. 2010. Automatic parcellation of human cortical gyri and sulci using standard anatomical nomen-clature. Neuroimage. 53:1–15.
Dorsaint-Pierre R, Penhune VB, Watkins KE, Neelin P, Lerch JP, Bouffard M, Zatorre RJ. 2006. Asymmetries of the planum tempor-ale and Heschl’s gyrus: relationship to language lateralization. Brain. 129:1164–1176.
Dos Santos Sequeira S, Woerner W, Walter C, Kreuder F, Lueken U, Westerhausen R, Wittling RA, Schweiger E, Wittling W. 2006. Handedness, dichotic-listening ear advantage, and gender effects on planum temporale asymmetry: a volumetric investigation using structural magnetic resonance imaging. Neuropsychologia. 44:622–636.
Dubois J, Benders M, Cachia A, Lazeyras F, Ha-Vinh Leuchter R, Sizonenko SV, Borradori-Tolsa C, Mangin JF, Huppi PS. 2008. Mapping the early cortical folding process in the preterm newborn brain. Cereb Cortex. 18:1444–1454.
Dubois J, Benders M, Lazeyras F, Borradori-Tolsa C, Ha-Vinh Leuchter R, Mangin JF, Hüppi PS. 2010. Structural asymmetries of perisyl-vian regions in the preterm newborn. Neuroimage. 52:32–42. Eckert M. 2004. Neuroanatomical markers for dyslexia: a review of
dyslexia structural imaging studies. Neuroscientist. 10:362–371. Eckert MA, Leonard CM, Possing ET, Binder JR. 2006. Uncoupled
left-ward asymmetries for planum morphology and functional language processing. Brain Lang. 98:102–111.
Eckert MA, Lombardino LJ, Walczak AR, Bonihla L, Leonard CM, Binder JR. 2008. Manual and automated measures of superior tem-poral gyrus asymmetry: concordant structural predictors of verbal ability in children. Neuroimage. 41:813–822.
Eickhoff SB, Walters NB, Schleicher A, Kril J, Egan GF, Watson JDG, Amunts K. 2005. High-resolution MRI reflects myeloarchitecture and cytoarchitecture of human cerebral cortex. Hum Brain Mapp. 24:206–215.
Eyler LT, Prom-Wormley E, Panizzon MS, Kaup AR, Fennema-Notestine C, Neale MC, Jernigan TL, Fischl B, Franz CE, Lyons MJ et al. 2011. Genetic and environmental contributions to regional cortical surface area in humans: a magnetic resonance imaging twin study. Cereb Cortex. 21:2313–2321.
Fischl B, Dale AM. 2000. Measuring the thickness of the human cer-ebral cortex from magnetic resonance images. Proc Natl Acad Sci USA. 97:11050–11055.
Fischl B, Liu A, Dale AM. 2001. Automated manifold surgery: con-structing geometrically accurate and topologically correct models of the human cerebral cortex. IEEE Trans Med Imaging. 20:70–80. Fischl B, Salat DH, Busa E, Albert M, Dieterich M, Haselgrove C, van
der Kouwe A, Killiany R, Kennedy D, Klaveness S et al. 2002. Whole brain segmentation: automated labeling of neuroanatomical structures in the human brain. Neuron. 33:341–355.
Fischl B, Salat DH, van der Kouwe AJ, Makris N, Segonne F, Quinn BT, Dale AM. 2004. Sequence-independent segmentation of mag-netic resonance images. Neuroimage. 23(Suppl 1):69–84.
Fischl B, Sereno MI, Dale AM. 1999. Cortical surface-based analysis. II: inflation, flattening, and a surface-based coordinate system. Neuroimage. 9:195–207.
Fischl B, Sereno MI, Tootell RB, Dale AM. 1999. High-resolution inter-subject averaging and a coordinate system for the cortical surface. Hum Brain Mapp. 8:272–284.
Fischl B, van der Kouwe A, Destrieux C, Halgren E, Segonne F, Salat DH, Busa E, Seidman LJ, Goldstein J, Kennedy D et al. 2004. Automatically parcellating the human cerebral cortex. Cereb Cortex. 14:11–22. Foundas AL, Leonard CM, Gilmore R, Fennel E, Heilman KM. 1994.
Planum temporale asymmetry and language dominance. Neuro-psychologia. 32:1225–1231.
Foundas AL, Leonard CM, Hanna-Pladdy B. 2002. Variability in the anatomy of the planum temporale and posterior ascending ramus: do right- and left handers differ? Brain Lang. 83:403–424. Foundas AL, Leonard CM, Heilman KM. 1995. Morphologic cerebral
asymmetries and handedness. Arch Neurol. 52:501–508.
Frost MA, Goebel R. 2012. Measuring structural-functional correspon-dence: spatial variability of specialised brain regions after macro-anatomical alignment. Neuroimage. 59:1369–1381.
Frye RE, Liederman J, Malmberg B, McLean J, Strickland D, Beauchamp MS. 2010. Surface area accounts for the relation of gray matter volume to reading-related skills and history of dyslexia. Cereb Cortex. 20:2625–2635.
Fullerton BC, Pandya DN. 2007. Architectonic analysis of the auditory-related areas of the superior temporal region in human brain. J Comp Neurol. 504:470–498.
Galaburda A, Sanides F, Geschwind N. 1978. Human brain. Cytoarchi-tectonic left-right asymmetries in the temporal speech region. Arch Neurol. 35:812–817.
Galuske RAW, Schlote W, Bratzke H, Singer W. 2000. Interhemi-spheric asymmetries of the modular structure in human temporal cortex. Science. 289:1946–1949.
Gannon PJ, Holloway RL, Broadfield DC, Braun AR. 1998. Asymmetry of the planum temporale: humanlike pattern of Wernicke’s brain language area homolog. Science. 279:220–222.
Geschwind N, Quadfasel FA, Segarra JM. 1968. Isolation of the speech area. Neuropsychologia. 4:327–340.
Giedd JN, Blumenthal J, Jeffries NO, Castellanos FX, Liu H, Zijdenbos A, Paus T, Evans AC, Rapoport JL. 2006. Brain development during childhood and adoloscence: a longitudinal MRI study. Nat Neurosci. 2:861–5.
Goldberg E, Roediger D, Kucukboyaci NE, Carlson C, Devinsky O, Kuzniecky R, Halgren E, Thesen T. 2013. Hemispheric asymme-tries of cortical volume in the human brain. Cortex. 49:200–210. Golestani N, Molko N, Dehaene S, LeBihan D, Pallier C. 2007. Brain
structure predicts the learning of foreign speech sounds. Cereb Cortex. 17:575–582.
Good CD, Johnsrude I, Ashburner J, Henson RN, Friston KJ, Fracko-wiak RS. 2001. Cerebral asymmetry and the effects of sex and handedness on brain structure: a voxel-based morphometric analy-sis of 465 normal adult human brains. Neuroimage. 14:685–700. Griffiths TD, Warren JD. 2002. The planum temporale as a
compu-tational hub. Trends Neurosci. 25:348–353.
Hackett TA, Kaas JH. 2004. Auditory cortex in primates: functional subdivisions and processing streams. In: Gazzaniga MS, editor. The new cognitive neuroscience. 3rd ed. Cambridge (MA): MIT Press. p. 215–232.
Hackett TA, Preuss TM, Kaas JH. 2001. Architectonic identification of the core region in auditory cortex of macaques, chimpanzees, and humans. J Comp Neurol. 441:197–222.
Harasty J, Seldon HL, Chan P, Halliday G, Harding A. 2003. The left human speech-processing cortex is thinner but longer than the right. Laterality. 8:247–260.
Hickok G, Poeppel D. 2007. The cortical organization of cortical speech processing. Nat Rev Neurosci. 8:393–402.
Hogstrom LJ, Westlye LT, Walhovd KB, Fjell AM. 2012. The structure of the cerebral cortex across adult life: age-related patterns of surface area, thickness, and gyrification. Cereb Cortex [Epub ahead of print]. doi:10.1093/cercor.bhs231.
Hutsler J, Galuske RAW. 2003. The specialized structure of human language cortex: pyramidal cell size asymmetries within auditory and language-associated regions of the temporal lobes. Brain Lang. 86:226–242.
Ihnen SKZ, Church JA, Petersen SE, Schlaggar BL. 2009. Lack of gen-eralizability of sex differences in the fMRI BOLD activity associated with language processing in adults. Neuroimage. 45:1020–1032. Im K, Lee JM, Lee J, Shin YW, Kim IY, Kwon JS, Kim SI. 2006. Gender
difference analysis of cortical thickness in healthy young adults with surface-based methods. Neuroimage. 31:31–38.
Im K, Lee JM, Lyttelton O, Kim SH, Evans AC, Kim SI. 2008. Brain size and cortical structure in the adult brain. Cereb Cortex. 18:2181–2191.
Jamison HL, Watkins KE, Bishop DVM, Matthews PM. 2006. Hemi-spheric specialization for processing auditory nonspeech stimuli. Cereb Cortex. 16:1266–1275.
Jancke L, Schlaug G, Huang X, Steinmetz H. 1994. Asymmetry of the planum parietale. Neuroreport. 5:1161–1163.
Jancke L, Steinmetz H. 1993. Auditory lateralization and planum tem-porale asymmetry. Neuroreport. 5:169–172.
Jancke L, Wüstenberg T, Scheich H, Heinze H. 2002. Phonetic percep-tion and the temporal cortex. Neuroimage. 15:733–746.
Josse G, Hervé PY, Crivello F, Mazoyer B, Tzourio-Mazoyer N. 2006. Hemispheric specialization for language: brain volume matters. Brain Res. 1068:184–193.
Josse G, Kherif F, Flandin G, Seghier ML, Price CJ. 2009. Predicting language lateralization from gray matter. J Neurosci. 29:13516–13523. Kaas JH, Hackett TA. 2000. Subdivions of auditory cortex and
proces-sing streams in primates. Proc Natl Acad Sci USA. 97:11793–11799. Knaus TA, Bollich AM, Corey DM, Lemen LC, Foundas AL. 2006.
Variability in perisylvian brain anatomy in healthy adults. Brain Lang. 97:219–232.
Kuperberg GR, Broome MR, McGuire PK, David AS, Eddy M, Ozawa F, Goff D, West WC, Williams SC, van der Kouwe AJ et al. 2003. Regionally localized thinning of the cerebral cortex in schizo-phrenia. Arch Gen Psychiatry. 60:878–888.
Leonard CM, Towler S, Welcome S, Halderman LK, Otto R, Eckert M, Chiarello C. 2008. Size matters: cerebral volume influences sex differences in neuroanatomy. Cereb Cortex. 18:2920–2931. Li G, Nie J, Wu G, Wang Y, Shen D. 2012. Consistent reconstruction of
cortical surfaces from longitudinal brain MR images. Neuroimage. 59:3805–3820.
Liem F, Zaehle T, Burkhard A, Jancke L, Meyer M. 2012. Cortical thickness of supratemporal plane predicts auditory N1 amplitude. Neuroreport. 23:1026–1030.
Lu LH, Dapretto M, O’Hare ED, Kan E, McCourt ST, Thompson PM, Toga AW, Bookheimer SY, Sowell ER. 2009. Relationships between brain activation and brain structure in normally develop-ing children. Cereb Cortex. 19:2595–2604.
Luders E, Gaser C, Jancke L, Schlaug G. 2004. A voxel-based approach to gray matter asymmetries. Neuroimage. 22:656–664.
Luders E, Gaser C, Narr KL, Toga AW. 2009. Why sex matters: brain size independent differences gray matter distributions between men and woman. J Neurosci. 29:14265–14270.
Luders E, Narr KL, Thompson PM, Rex DE, Jäncke L, Toga AW. 2006. Hemispheric asymmetries in cortical thickness. Cereb Cortex. 16:1232–1238.
Luders E, Narr KL, Thompson PM, Woods RP, Rex DE, Jancke L, Stein-metz H, Toga AW. 2005. Mapping cortical gray matter in the young adult brain: effects of gender. Neuroimage. 26: 493–501.
Lv B, Li J, He H, Li M, Zhao M, Ai L, Yan F, Xian J, Wang Z. 2010. Gender consistency and difference in healthy adults revealed by cortical thickness. Neuroimage. 53:373–382.
Lyttelton OC, Karama S, Ad-Dab’agh Y, Zatorre RJ, Carbonell F, Worsley K, Evans AC. 2009. Positional and surface area asymmetry of the human cerebral cortex. Neuroimage. 46:895–903.
Makris N, Pandya DN. 2009. The extreme capsule in humans and re-thinking of the language circuitry. Brain Struct Funct. 213:343–358.
Meyer M, Friederici AD, von Cramon DY. 2000. Neurocognition of auditory sentence comprehension: event-related fMRI reveals sen-sitivity to syntactic violations and task demands. Brain Res Cogn Brain Res. 9:19–33.
Meyer M, Zaehle T, Gountouna EV, Barron A, Jäncke L, Turk A. 2005. Spectro-temporal integration during speech perception involves left posterior auditory cortex. Neuroreport. 16:1985–1989. Meyer M, Zysset S, von Cramon DY, Alter K. 2005. Distinct fMRI
responses to laughter, speech, and sounds along the human peri-sylvian cortex. Brain Res Cogn Brain Res. 24:291–306.
Morosan P, Rademacher J, Schleicher A, Amunts K, Schormann T, Zilles K. 2001. Human primary auditory cortex: cytoarchitectonic subdivisions and mapping into a spatial reference system. Neuro-image. 13:684–701.
Mühlau M, Rauschecker JP, Oestreicher E, Gaser C, Röttinger M, Wohlschlager AM, Simon F, Etgen T, Conrad B, Sander D. 2006. Structural brain changes in tinnitus. Cereb Cortex. 16:1283–1288. Pandya DN. 1995. Anatomy of the auditory cortex. Rev Neurol Paris.
151:486–494.
Panizzon MS, Fennema-Notestine C, Eyler LT, Jernigan TL, Prom-Wormley E, Neale M, Jacobson K, Lyons MJ, Grant MD, Franz CE et al. 2009. Distinct genetic influences on cortical surface area and cortical thickness. Cereb Cortex. 19:2728–2735.
Patterson RD, Uppenkamp S, Johnsrude IS, Griffiths TD. 2002. The processing of temporal pitch and melody information in auditory cortex. Neuron. 36:767–776.
Penhune VB, Cismaru R, Dorsaint-Pierre R, Petitto LA, Zatorre RJ. 2003. The morphometry of auditory cortex in the congenitally deaf measured using MRI. Neuroimage. 20:1215–1225.
Penhune VB, Zatorre RJ, MacDonald JD, Evans AC. 1996. Interhemi-spheric anatomical differences in human primary auditory cortex: probabilistic mapping and volume measurement from magnetic resonance scans. Cereb Cortex. 6:661–672.
Price CJ. 2012. A review and synthesis of thefirst 20 years of PET and fMRI studies of heard speech, spoken language and reading. Neu-roimage. 62:816–847.
Rademacher J, Morosan P, Schormann T, Schleicher A, Werner C, Freund H, Zilles K. 2001. Probabilistic mapping and volume measurement of human primary auditory cortex. Neuroimage. 13:669–683.
Rakic P. 2009. Evolution of the neocortex: a perspective from devel-opmental biology. Nat Rev Neurosci. 10:724–735.
Rakic P. 2007. The radial edifice of cortical architecture: from neur-onal silhouettes to genetic engineering. Brain Res Rev. 55:204–219.
Rakic P. 2000. Radial unit hypothesis of neocortical expansion. Novar-tis Found Symp. 228:30–42.
Rakic P. 1995. A small step for the cell, a giant leap for mankind: a hypothesis of neocortical expansion during evolution. Trends Neurosci. 18:383–388.
Rakic P. 1988. Specification of cerebral cortical areas. Science. 241:170–176.
Rauschecker JP, Tian B, Hauser M. 1995. Processing of complex sounds in the macaque nonprimary auditory cortex. Science. 268:111–114.
Rauschecker JP, Tian B, Pons T, Mishkin M. 1997. Serial and parallel processing in rhesus monkey auditory cortex. J Comp Neurol. 382:89–103.
Rosas HD, Liu AK, Hersch S, Glessner M, Ferrante RJ, Salat DH, van der Kouwe A, Jenkins BG, Dale AM, Fischl B. 2002. Regional and progressive thinning of the cortical ribbon in Huntington’s disease. Neurology. 58:695–701.
Rosen GD. 1998. Cellular, morphometric, ontogenetic and connec-tional substrates of anatomical asymmetry. Neurosci Biobehav Rev. 20:773–780.
Salat DH, Buckner RL, Snyder AZ, Greve DN, Desikan RS, Busa E, Morris JC, Dale AM, Fischl B. 2004. Thinning of the cerebral cortex in aging. Cereb Cortex. 14:721–730.
Schneider P, Andermann M, Wengenroth M, Goebel R, Flor H, Rupp A, Diesch E. 2009. Reduced volume of Heschl’s gyrus in tinnitus. Neuroimage. 45:927–939.
Schneider P, Scherg M, Dosch HG, Specht HJ, Gutschalk A, Rupp A. 2002. Morphology of Heschl’s gyrus reflects enhanced activation in the auditory cortex of musicians. Nat Neurosci. 5:688–694. Shapleske J, Rossell SL, Woodruff PWR, David AS. 1999. The planum
temporale: a systematic, quantitative review of its structural, func-tional and clinical significance. Brain Res Rev. 29:26–49.
Sigalovsky IS, Fischl B, Melcher JR. 2006. Mapping an intrinsic MR property of gray matter in auditory cortex of living humans: a possible marker for primary cortex and hemispheric differences. Neuroimage. 32:1524–1537.
Sowell ER, Peterson BS, Kan E, Woods RP, Yoshi J, Bansal R, Xu D, Zhu H, Thompson PM, Toga AW. 2007. Sex differences in cortical thickness mapped in 176 individuals between 7 and 87 years of age. Cereb Cortex. 17:1550–1560.