First-Generation Spotted Tentiform Leafminer
(Lepidoptera: Gracillariidae) in
New York Apple Orchards
J.
P. NY Rap,w.
H. REISSIG, A. M. AGNELLO, ANDJ.
KOVACHDepartment of Entomology, New York State Agricultural Experiment Station, Cornell University, Geneva, New York 14456
Environ.Entomol.19(5): 1624-1638 (1990)
ABSTRACT A pest control decision rule consisting of an action threshold and a sampling protocol was developed and evaluated for first-generation spotted tentiform leafminer, Phyl-lonorycter blancardella (F.). An action threshold of two eggs per leaf was chosen based on the criterion of preventing more than one first-generation mine per leaf. Two sequential classification sampling plans for first-generation eggs were developed, one based on variable intensity sampling and the other on the use of confidence intervals for stop limits. Both plans made use of the nested variance structure of leafminer egg counts and variance-mean models fit to estimated variance components. Performance of the two sequential procedures was studied using simulation and judged to be very similar. Use of either sampling plan required approximately 10-20 min. Over a 4-yr period, 87% of sampled orchards in western New York had leafminer populations that were below the threshold of two eggs per leaf. During this period, use of sample information to schedule insecticide treatments resulted in only one instance when a treatment may have been required and was not called for (n
=
79). Widespread use of the decision rule would result in significant reductions in pesticide use with no attendant increase in risk to growers.KEY WORDS Insecta, sequential sampling, action thresholds, Phyllonorycter blancardella
THE SPOTTED TENTIFORM LEAFMINER, Phyllono-ryeter blaneardella (F.), is currently a serious pest
of apples in the major apple growing regions of northeastern United States and Canada (Pottinger
& LeRoux 1971, Dutcher & Howitt 1978, Weires et a1. 1980, Herbert & McRae 1983, Ridgway &
Mahr 1985, Pree et a1. 1986). Severe infestations of this pest can cause premature leaf drop, reduc-tion in terminal growth and fruit size, premature fruit drop, and reductions in fruit set and produc-tion during successive seasons (Pottinger &LeRoux 1971, Pree et a1. 1980, Reissig et al. 1982). Second-brood larval populations are more damaging than first-generation populations, and treatments are not recommended against second-generation larvae unless population densities exceed two mines per leaf (Reissig et a1. 1982). Although first-generation larvae normally do not cause significant damage to trees in New York orchards, control of this brood may be justified on the basis of preventing more critical damage later in the season from the second generation (Reissig et a1. 1982). Therefore, al-though control of first-generation larvae is war-ranted in some situations, treatments against this generation should be minimized to lessen the like-lihood of resistance developing (Marshall & Pree 1986, Pree et a1. 1986), and because the insecticides used to control P. blancardella (oxamyl or synthetic
pyrethroids) are very toxic to mite predators (].P.N., unpublished data).
To determine if first-generation larvae require control, population densities should be compared with an action threshold. One possibility is to base a treatment decision on some measure of adult abundance, First-generation adults can be moni-tored with traps baited with sex attractants (Roelofs et a1. 1977). However, catches of adults are often quite high in commercial orchards in New York (Trimble 1984), and it has not been possible to relate catches of adults in sex attractant traps to subsequent larval densities (W.H.R., unpublished data). In Massachusetts, adult densities of a similar leafminer species, Phyllonorycter crataegella
(Clemens), are assessed with visual red cardboard sticky traps (Green & Prokopy 1986), and the data are used to predict the need for control of subse-quent first-generation larvae (Green et a1. 1983). However, these traps are difficult to deploy and maintain, and the recommended action threshold for this leafminer species in Massachusetts (0.13 mines per leaf) is considerably lower than that rec-ommended for P. blancardella in New York.
An alternative approach is to base a treatment decision on an assessment of egg density before or during bloom. The goal of this study was to develop and evaluate a control decision rule for
eration P. blancardella based on sampling eggs. Pest control decision rules consist of procedures for assessing pest density and guidelines for actions to take based on this assessment (Nyrop & Binns, in press). To meet this goal, four objectives were es-tablished. The first was to determine the temporal pattern of oviposition for first-generation females in relation to apple tree phenology. This infor-mation is required to time samples of P.
blancar-della eggs optimally. The second objective was to
determine an action threshold for eggs which is the egg density that, on average, results in no more than one first-generation mine per leaf. The third objective was to describe the distribution of eggs and mines, and using this data, to develop sampling protocols and evaluate their performance. Finally, the last objective was to evaluate the complete con-trol decision rule in commercial orchards.
Materials and Methods
Activity and Oviposition of First-Brood Adults.
The relationship between adult flight of the over-wintering generation of P. blancardella, oviposi-tion, and tree phenology was studied in four or-chards located in Wayne County, N.Y., in 1983 and 1984. Each year, the orchards consisted of two plantings of 'Rhode Island Greening' trees ranging in size from 2.5 to 4.0 m tall, and two plantings of 'McIntosh' trees ranging in size from 2.0 to 3.0 m tall. One 'McIntosh' orchard was used both years; the others were unique for each year. In 1983, a small plot that was not treated with insecticide was established along the edge of each orchard. Four pheromone traps (Pherocon II traps and P.
blancar-della lure, Trece Inc., Salinas, Calif.) were set up
<::::50m apart in each plot to monitor the flight of
first-generation males. The traps were deployed before the first emergence of males at green tip, 12 April, and checked weekly throughout the flight. Traps were replaced as necessary, usually each week during periods of peak adult flight. Spotted tenti-form leafminer eggs were counted on 25 fruit clus-ters randomly selected from each of four trees within each orchard at key stages of apple bud development: tight cluster (1-4 May), full pink (8-11 May), full bloom (15-18 May), petal fall (22-25 May), and fruit set (30 May-9 June). Sampled fruit clusters were removed from the trees on each sampling date and brought back to the laboratory where the leaves were removed and eggs on the lower leaf surface were counted using a dissecting microscope.
Procedures used in 1984 were similar except that male moths were monitored using two pheromone traps per block, and eggs were sampled on 10 clus-ters randomly selected from each of five trees in each orchard at the following bud developmental stages: 0.25 in. (0.098 cm) green (30 April), 0.5 in. (0,197 em) green (3 May), late 0.5 in. green (7 May), early tight cluster (10 May), early pink (14 May), pink (18 May), early bloom (21 May), bloom
(25 May), late bloom (29 May), and petal fall (1 June).
Data were analyzed by first scaling density and trap catch for each sample date in each orchard by dividing these measurements by the respective maximums observed. Scaling was done to place the results obtained in each orchard on the same basis. Scaled densities and trap catches were then aver-aged across the four orchards for each year and graphed.
Distribution and Density of Eggs and Mines.
Data were collected in 1982 and 1983 to answer three questions: How are P. blancardella eggs and mines distributed among the different aged leaves of fruit leaf clusters? What is the sampling distri-bution of the eggs? What is the relationship be-tween the density of eggs and the subsequent den-sity of mines? The first question was posed to determine the most appropriate leaves to sample in each leaf cluster. The oldest and youngest leaves in a leaf cluster are unlikely to have eggs laid on them, and by determining which leaves harbored the greatest proportion of eggs, sampling could be made more efficient. It was also necessary to de-termine whether the distribution of mines among leaves mirrored the distribution of eggs, because egg density was to be used as a measure of sub-sequent mine density. An answer to the second question was necessary to devise a sampling pro-tocol. Finally, the last question was posed to estab-lish an action threshold based on egg density. It was subjectively resolved that the egg threshold should result in no more than one mine per leaf if no treatment was called for.
In 1982, small plots of unsprayed trees were es-tablished in four commercial apple orchards in
Wayne County, N. Y. The orchards consisted of two
'Idared' plantings, a planting of 'Rhode Island Greening,' and a mixed planting of 'Rhode Island Greening' and 'Cortland.' The test plots were not sprayed with insecticides during this study, but received normal sprays of fungicides to control ap-ple scab. Spotted tentiform leafminer eggs were counted in the 'Idared' orchards on 6-7 May when the trees were at the full pink growth state. Twenty randomly selected fruit clusters on each of five trees within the plots in each orchard were sampled. Each sampled cluster was tagged and left on the tree for subsequent mine counts. Eggs were count-ed on the undersides of all of the leaves on each cluster in the field using an optivisor (7 x magni-fication). The 'Rhode Island Greening' planting and the mixed planting of 'Rhode Island Greening' and 'Cortland' trees were sampled on 13-14 May when these trees were at the full pink stage using the same procedure. Spotted tentiform leaf miner tissue mines were counted on the marked clusters after the first generation of larvae was estimated to have completed its development (17-21 June).
The sampling distribution of eggs and relation-ship between egg density and density of subsequent mines also were studied in 1983. Eggs were counted
and the results substituted back into Equation 1 to yield an expression for sm2 that depends only on
the number of leaf clusters sampled per tree e:
where Tc is the time required to move from one tree to another and T. is the time required to sam-ple a leaf cluster within a tree. Equation 2 was solved in terms of c:
Sm2 =
[(Tc
+
eT.)s;jT]
+
[(Tc
+
eT.)sH(Te)].
(4)
The variance of the mean defined in Equation 4 was minimized with respect to the number of leaf clusters sampled by taking the first derivative,
set-In this section we describe models used to portray
the sampling distribution of eggs, describe the basis for the sampling procedures, and describe how the performance of the sampling procedures was es-timated. The performance of sampling procedures used in decision making is judged via the operating characteristic (OC) and the average sample num-ber (ASN). The OC and ASN are functions of the true mean of the population being sampled. The OC is the probability of accepting the null hy-pothesis that the population density is below a giv-en action threshold and the ASN is the average number of samples required to stop sampling (Ny-rop & Binns, in press).
Variation in 1982 and 1983 eggs counts was par-titioned into a leaf cluster effect and a tree effect using a nested analysis of variance for each orchard sampled in 1982 and 1983. The sample unit con-sisted of leaves 2-4 on a leaf cluster, and the counts were expressed as the total number of eggs per leaf cluster. This sample unit was chosen after studying the distribution of eggs on leaves in a leaf clus-ter. Throughout this section the following notion is used: e is the number of leaf clusters sampled with-in a tree and c is the number of trees sampled. The total sample size is then ec = n. The variation
between leaf clusters within trees, S.2, was
esti-mated as the mean square error from the analysis of variance. The between-trees variance compo-nent,
s;,
was estimated as the tree effect mean square minus the mean square error, divided by the number of leaf clusters sampled per tree. Using these estimates, the variance of the mean of an estimated density,sm
2, based on c trees and e leafclusters per tree, is
sm
2=(s;
+
es/)/(ce).
(1)The objective in developing an optimal fixed sample size sampling plan is to find values of e and
c
that minimizesm
2 subject to the constraint thatthe time required to process
ec
=n
samples is less than or equal to some specified time T. The total time required to processn
samples was divided into leaf cluster and tree components as:(2)
(3)
T
=c(Tc
+
eT.)
c=
T/(Tc
+
eT.)
on the second, third, and fourth leaves of five ran-domly selected fruit clusters on each of 10 trees in 36 commercial apple orchards in Wayne County. This sampling plan was developed based on the previous year's data and was designed to minimize the variance of estimates in the range of one to two eggs per leaf. In contrast with the 1982 studies, sampled clusters were removed from the trees so that eggs could be counted more easily. Eggs were sampled on trees of only one cultivar in each block. The 10 trees sampled for eggs within each orchard were selected from throughout the entire block. Eggs were sampled when trees in each cultivar were in the pink bud stage (9-16 May). After the blocks were sampled, growers were advised to ap-ply a spray of either a synthetic pyrethroid (fen-valerate or permethrin) or oxamyl if the egg den-sity exceeded one per leaf. On 29 June, after the first-generation larvae had completed their devel-opment, tissue mines were counted on leaves 2-6
on five randomly selected fruit clusters on each of 10 trees in each block. The trees sampled for tissue mines were selected from throughout the block, but were not necessarily the same trees sampled previously for eggs.
Development of Sampling Plans. Two types of sampling procedures were developed over the course of the study. The first, consisting of a single protocol, was a fixed sample size procedure de-signed to minimize the variance of egg density estimates using an average sampling time of 20 min. Twenty minutes were thought to be a time that growers would be willing to spend sampling P.
blancardella.
Two protocols, both of which are sequential, constituted the second type and were designed to classify egg densities with respect to an action threshold. The fixed sample size proce-dure was developed first and used for several years before the sequential methods were developed and implemented.All of the sampling plans accounted for the nest-ed structure of the sampling variance; variability in P.
blancardella
egg density consists of a within-tree component and a between-tree component. From a sampling and pest management decision-making perspective, identifying and making use of the nested structure of variances is important, because failure to consider the structure of sam-pling variability may lead to the development of misleading or inefficient sampling procedures. Both types of sampling plans used an action threshold of two eggs per leaf. This value was arrived at based on the results of the 1982 and 1983 studies. The procedures also made use of an egg density and sampling time relationship identified in 1983. Data for developing this relationship were obtained from five observers who sampled one leaf cluster from each of five 'Rhode Island Greening' trees. Eggs were counted in situ on leaves2-4
using an optivisor and the time required to sample each cluster was recorded. These times were then re-gressed on per-leaf egg density.and
c* =T/{Tc
+
[(Tcy/a)(i+
rm)m=-b]"'}. (10)ization of the variable intensity approach is based on sequential classification.
We describe variable intensity sampling in the following way. First, the number of trees (c) and the maximum number of leaf clusters per tree (emu) to be sampled are determined. The maximum total sample size n =cern •• can be specified as a function
of the maximum available sampling time or it can be determined by specifying a range of densities around a treatment threshold for which maximal precision in the sample data is required. At the first tree, the maximum number of leaf clusters is sam-pled. Based on the outcome of this sampling, the number of leaf clusters e to be sampled at the next and all subsequent trees is determined. If the es-timated mean density is considerably less than or greater than the threshold, e is reduced from em••. Samples are taken at the next tree using the ap-propriate sampling intensity (e) and the overall mean is computed. Based on this estimate, the number of leaf clusters to be sampled is again re-vised. This procedure continues until all of the trees have been visited, at which time a mean is com-puted and, if it is less than the threshold, no treat-ment is made.
Revision of the number of samples to take at each tree proceeds as a two-step process. First, the estimated mean density is compared with an in-terval that brackets the threshold. If the density estimate falls within this interval, the maximum number of samples is taken. If the density estimate lies outside this interval, the leaf cluster sample size is adjusted so that the overall sample size provides estimates of the mean that have either an upper or lower 1 - a: confidence interval equal to the threshold. If the mean is less than the threshold, an upper confidence interval is used, and if the mean is greater than the threshold, a lower confi-dence interval is used.
The interval about the mean for which the max-imum number of elements per cluster will be sam-pled is computed as:
m, ± Za/2([S;!C]
+
(s;j[cem •• ]))'" (ll) wheres;
ands;
are variance terms estimated via the variance-mean models (Equations 6 and 7) by using the estimated mean as the independent vari-able. This interval is equivalent to saying that if the estimated mean falls within Za/2 standardde-viations of the threshold, the maximum total sam-ple size is required and the maximum number of elements will therefore be sampled at the next clus-ter. Note that our specification of this interval de-parts from that presented by Hoy et al. (1983) in that we use the variance for the estimated mean of the population being sampled, and they used the variance of the threshold density. If the esti-mated mean is less than the lower interval for which the maximum sample is to be taken or greater than the upper interval, the average number of leaf clusters to be sampled over all trees is determined by first calculating a target overall sample size that
(7) (6) (5) (8) S.2 =ym=. T.= i
+
rm. andwhere e* is the optimum number of leaf clusters to sample to minimize
sm
2. In a sense Equation 5,which is independent of T, reduces the problem to finding the optimal sample size c* for a simple random sample, based either on Equation 2 or l. We used Equation 2 and calculated c* using Equa-tion 3 with the optimal e*.
Taylor's power law (TPL) (Taylor 1961) was used to model the two variance components as a function of egg mean density m:
ting it equal to zero, and solving it with respect to
e, yielding:
Note that in these equations the mean m is the mean for the orchard and not the mean in any particular tree. The time required to sample a leaf cluster was modeled as a linear function of the egg density:
When any of the time considerations are ignored, examination of Equations 9 and 10 reveals that if
sc' is >0, then minimum sm' is achieved by setting
eto 1. However, if Tcand T. are considerations, then as the mean m increases, c* increases if
b >
zand m
<
[i(b - z)]/[r(1+
z - b)]; otherwise, c*decreases as m increases.
The values for e* and c* were selected to opti-mize the sampling plan for a density of two eggs per leaf, the action threshold, and for a sampling time of 20 min. Because the sampling time is a function of egg density, sampling times will be >20 min for egg densities >2.0 and the converse for densities <2.0.
The performance of the sampling procedure was evaluated by computing an OC using a simulation described later in this section. Average sample numbers are simply the fixed sample size used. For this sampling plan, the OC could also have been determined using normal probability model ap-proximations.
Two methods were used to construct sequential classification procedures for P. blancardella eggs. The first method was based on variable intensity sampling (VIS) (Hoy et al. 1983). Our development of the procedure generally follows that made by Hoy et al. (1983) with the notable exceptions that a nested variance model is considered and rational-Substituting these relationships back into Equations 5 and 3 yields:
e =(ce - n,)/c,. (13)
Equations 12 and 13 were used to find the es-timated mean densities (rii) given n, and c, for which e changes from one whole number to the next. The solution to this problem when rii is less than the threshold m, is:
will yield an estimated mean with a 1 - ex upper or lower confidence interval equal to the threshold. The average number of leaf clusters to be sampled is then computed as:
e=s/f[((m, - rii)'c/za/.') - sn (12)
This sample size reflects the desired sample size after all trees have been visited. The number of elements to sample at the next cluster is adjusted based on the number of samples taken thus far (n,)
and the number of trees remaining to be sampled
(c,) as:
Ifriiis greater than m" the term beneath the radical is added to m,. In Equation 14,8; and 8; are func-tions of the estimated mean (i.e., via TPL). As a result, an iterative procedure is required to solve this equation for rii. This was done by first using the threshold mean density in the variance-mean models to obtain an initial estimate of rii. This estimate is then used in the variance-mean models to arrive at a new solution for rii. The new rii is then again used in the variance-mean models and the procedure is repeated until changes in succes-sive estimates of rii reach a specified minimum value. Here, these solutions were obtained using a microcomputer-based spreadsheet program. The solutions obtained to Equation 14 were then mul-tiplied by
n,
and, after appropriate rounding, ex-pressed as the total number of eggs observed. The parameter Za/' was assigned a value of 1.96.Another sequential sampling procedure that takes into account a nested variance structure was de-veloped by using confidence intervals about the threshold density as a basis for stop lines (Iwao 1975). Use of the procedure with a nested variance structure simply entails accounting for the two sources of variation in the calculation of the vari·· ance. For reference purposes, we will call this pro-cedure sequential cluster sampling.
The variance of a mean determined from Cclus·· ter samples and e elements per cluster was given in Equation 1. Therefore, 1 - ex level upper and lower confidence intervals for an estimated mean are calculated as:
rii ± za/.[(s;
+
es;)/(ce)]~. (15)If the number of leaf clusters e is fixed, Equation 15 can be used as upper and lower stop limits determined as a function of
c.
The number of leaf clusters to be sampled was set to three and was determined using the analysis previously presentedrii =m, -
za/'
!
(_C_S
c_2-+
s;).
C ec,
+
n,(14)
for determining optimum tree and leaf cluster sam-ple sizes for use in estimating a mean. Multiplying Equation 15 by the number of samples allows the stop limits to be expressed as the total number of eggs found. For the P. blancardella sampling plan, the parameter Za/' was assigned a value of 1.68.
Decision boundaries defined using Equation 15 diverge with increasing sample size. This property, combined with a constraint on time available to sample a particular site, made it necessary to set an upper limit on the number of samples that would be taken. To meet this need, the stop lines were truncated by equating the upper and lower stop limits to the threshold density when a predeter-mined maximum sample size was reached, which in this case was seven trees.
The performance of the three sampling plans was evaluated via simulation. An essential step in these simulations is the generation of random vari-ables that model sample observations of eggs. We formulated this model as:
Xij= m
+
C,+
Eil (16)where m is the orchard-wide egg mean density, C, is the i'btree effect and E'l is thej'bleaf cluster effect in tree i. The terms C, and E'l have zero means and variances
se'
ands;,
respectively. Because C, is the mean effect for tree i, it is reasonable to assume that it is normally distributed. Using this assump-tion, an Xij was produced by first generating aspe-cific ciwith variance computed using TPL as
s;
=amb, where aand b are parameters estimated for
the between-tree variance component. The mean per leaf cluster for a particular tree is then me =
m
+
c,
with the variance determined ass;
=ym:.
This mean and variance were then used to generate observations from a cluster using a negative bi-nomial model (NBD).
The applicability of this procedure was exam-ined in a three-step process. Random variables were first generated via simulation using parameters es-timated from the P. blancardella data. Within- and between-tree variance components were then es-timated for the simulated data and TPL models were fit and compared with the models obtained for the field data. In the simulation, data were generated for 10 mean densities and for each 10 trees and 10 leaf clusters per tree were sampled.
The OC for the fixed sample size plan, VIS, and sequential cluster sampling plans, and the ASN for the VIS and sequential cluster sampling plans were determined using the method described above to generate random variables. With the sequential cluster sampling plan, two trees were sampled before comparing sample counts to the stop limits. One thousand Monte Carlo iterations were used for each mean.
The effect of ignoring the nested variance struc-ture when constructing stop limits and when esti-mating OC curves was also examined. A TPL mod-el was fit to the 1982 and 1983 count data without partitioning the variance into tree and cluster
com-ponents. Stop lines based on Iwao's (1975) approach were then developed using this model with za/2 =
1.68. Two OC curves were estimated for this sam-pling plan. First, samsam-pling was simulated in which random variables were generated using the meth-ods described above. In this case, the random vari-ables mimicked the nested structure of the field data. Second, sampling was simulated in which the random variables were generated using a simple variance structure. In this case, the TPL model fit to the data without partitioning the variance was used.
Evaluation of the Sampling Plans. Because a good mechanistic relationship between egg density and subsequent first-generation mines was not available, it was necessary to evaluate the perfor-mance of the decision rule under real world con-ditions. The fixed sample size sampling plan for spotted tentiform leafminer eggs was used in 20 commercial apple orchards in Wayne County, N.Y., in 1984, and in 19 orchards in 1985. Eggs were counted at the pink bud stage (11 or 14 May) in 1984 and at the full pink bud stage (30 April-8 May) in 1985 on the second, third, and fourth leaves of three randomly selected fruit clusters on each of seven trees in each orchard. The first or second tree in the outer row of each orchard was sampled and then every other tree was sampled until seven trees had been monitored. Growers were advised to apply a control treatment for P. blancardella if the estimated egg density exceeded two per leaf. After the first generation of larvae had completed its development, all of the tissue mines were counted on the first seven leaves of 10 randomly selected fruit cluster on each of 10 trees within each study orchard. The 10 trees sampled for mines were selected in the same way as described for egg sampling.
The density of second-generation tissue mines was also estimated in each orchard by randomly sampling 10 mature terminal leaves from each of five trees in each orchard. These data were col-lected after second-generation larvae had com-pleted development and were used along with grower-supplied treatment records to determine whether eliminating control of first-generation P.
blancardella resulted in higher densities during the
second generation.
During 1987 and 1988, the fixed sample size plan was used in an extension oriented apple pest man-agement program (Agnello et al. 1989). Each year the decision rule was used in 19 orchards located throughout western New York. Egg densities were estimated as in 1984 and 1985; however, densities of first-generation mines were not determined. Densities of second-generation sap-feeding mines were estimated via the sampling protocol used to estimate second-generation mines in 1984 and 1985. These data were collected immediately after the first tissue-feeding mines were found; this is the time when most of the population is in the sap-feeding stage (J.P.N., unpublished data).
The sequential cluster sampling plan was eval-uated in 23 orchards scattered throughout western New York in 1989 also as part of the extension apple pest management program. Eggs were sam-pled at the pink bud stage. In blocks that did not receive a spotted tentiform leafminer treatment, the density of first-generation tissue-feeding mines was estimated during 22-26 June by counting mines on the first seven leaves of five leaf clusters from each of 10 trees. Densities of second-generation sap-feeding mines were estimated using the meth-ods used in 1988 and 1989.
Results and Discussion
Activity and Oviposition of First-Brood Adults. Large numbers of first-generation males were cap-tured in pheromone traps during the earliest apple growth stages in which populations were moni-tored in 1984 (Fig. 1). Although the catches of first-generation males in pheromone traps in the com-mercial orchards varied considerably from the tight cluster bud stage until bloom during both seasons in which flight was monitored, in both years the flight declined precipitously after bloom and was virtually over by petal fall. Oviposition began as soon as some leaves were folded back at 0.25-in. green during 1984. In both years, oviposition peaked by the pink bud stage and egg populations re-mained relatively constant on the fruit clusters un-til late bloom when they began to hatch. In 1984, egg counts were unexplainably low during early tight cluster. Low counts were obtained in all four orchards sampled and may have been influenced by poor weather because counts were made in situ. These results indicate that between the pink bud stage and early bloom is the best time to sample eggs for the purpose of predicting subsequent lar-val populations because few additional eggs are laid during bloom, and sampling before pink could un-derestimate egg populations. Sampling should be delayed until the later stages of pink because the results obtained in 1984 showed a slight increase in egg density from early to late pink.
Distribution and Density of Eggs and Mines. The second, third, and fourth leaves on the fruit cluster samples of each cultivar were generally more heavily infested with eggs than other leaves (Fig. 2). Few eggs were laid on the younger leaves (leaves 7-10) within the fruit clusters, primarily because these leaves had not yet fully expanded on some cultivars and had very pubescent lower surfaces. When clusters were sampled during the tight clus-ter bud stage, more eggs were found on the older leaves than during the pink bud stage when more eggs were found on younger and intermediate aged leaves. The individual cultivars had different av-erage numbers of unfolded leaves at the different bud stages, and consequently the relative distri-bution of eggs among different aged leaves varied slightly among cultivars. For example, leaves 4-6 on 'Idared' fruit clusters had similar numbers of
Trap catch
1.0
0.8
•
1983
"'Ccn
0.6
0
1984
0) .•....-c
m::::J
Uo
0.4
CJ)u
0.2
0.0
1.2
Oviposition
1.0
II
1983
0.8
0
1984
"'Ccn
0) .•....-
c
0.6
m:J
Uo
CJ)u
0.4
0.2
0.0
1/4 G 1/2 G Late
Early Early Pink
Early
81m
Late
PF
1/2 G
TC
Pk
81m
81m
Fig. 1. Oviposition and flight of spotted tentiform leafminer males during different stages of apple growth in commercial orchards in western New York.
eggs, whereas most of the eggs found on 'Cortland' fruit clusters, which had fewer leaves, were laid on the oldest three leaves.
Although the distribution of mines on the leaves varied slightly among cultivars (Fig. 2), the distri-bution of first-generation mines on fruit cluster leaves on all cultivars generally paralleled the dis-tribution of eggs. Mines were generally most nu-merous on the second, third, and fourth leaves. On 'Idared' clusters, leaves 4-7 had the most mines, and the numbers of mines on these were very sim-ilar.
Most of the eggs and mines (54 and 49%, re-spectively) were found on the second, third, and fourth leaves of the leaf clusters. As a result, a decision was made to count eggs only on these three-cluster leaves when sampling for decision making. This determination was made to maximize information obtained from each cluster while min-imizing the sampling time so that more clusters could be sampled. The same procedure was rec-ommended for sampling all cultivars to simplify the sampling procedure because the slight differ-ences in distribution among cultivars did not
ap-pear to be sufficiently large to affect the overall accuracy of the sampling plan.
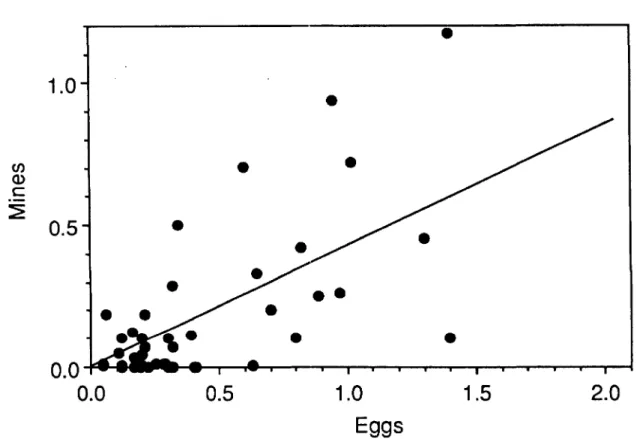
Action Threshold. Determination of an action threshold was based on two criteria. First, untreat-ed populations should result in no more than one mine per leaf. Second, by not treating first-gen-eration populations, the likelihood of problematic second-generation populations should not be great-ly increased. Over the course of the entire study, we formulated and validated a threshold of two eggs per leaf.
The threshold question was first addressed in 1982 by regressing the number of mines on the number of eggs for each orchard sampled. The linear regression models generally provided a poor fit to the data. The slopes for these models were statistically different from zero(a=0.05); however, the slopes ranged from 0.05 to 0.37 and the best r2 =0.25. Using the largest slope of 0.37, a threshold of 2.7 eggs is computed.
Based on the 1982 results, a conservative thresh-old of one egg per leaf was used in 1983. This threshold was subsequently increased to two eggs per leaf in 1984. This was done because the 1983
Cortland
10
5
9
Idared
8
4
7
Rhode Island Greening
o
Eggs at Tight Cluster
III
Eggs at Pink
•
Mines
6
3
5
4
2
3
2
1
1
50
40
.•...•
c
Cl)30
()~
Cl)20
0-10
0
25
.•....
20
c
Cl)15
()~
Cl)10
0-S
0
40
.•....
30
c
Cl) ()20
~
Cl)0-10
0
1
2
3
4
5
6
Leaf number
Fig. 2. Distribution of eggs and mines of the first-generation spotted tentiform leafminer on 'Cortland,' 'Idared,' and 'Rhode Island Greening' fruit cluster leaves (leaf1is the youngest).
results indicated that first-generation mine densi-ties were generally no more than one-half of the first-generation egg density. The threshold of two eggs per leaf was evaluated each subsequent year that the sampling plans were used. A composite evaluation in which data for all years is pooled is shown in Fig. 3. Regression of the mine densities
011 the egg densities shown in Fig. 3 produced a
slope of 0.424 after two outliers were eliminated from the data set (n
=
48, r2=
0.583, P=
0.001,8,.
=
0.053, mse=
2.27). Using this intercept, a threshold of 2.4 eggs is calculated. Thus, based on the criterion of restricting first-generation mine densities to less than one per leaf, a threshold of two eggs per leaf is acceptable.To determine whether not treating for first-gen-eration P. blancardella increased the likelihood of problematic second-generation populations, box
plots were created for the distribution of second-generation mine densities according to whether the first generation was treated or not (Fig. 4). The density of second-generation mines increased slightly in the absence of first-generation treat-ments. However, this increase did result in a dra-matic increase in the likelihood of probledra-matic den-sities because most denden-sities were still below the treatment threshold for second-generation mines (two per leaf). Densities of second-brood larvae usually did not exceed the threshold of two mines per leaf when first-generation larvae were not con-trolled. Nonetheless, second-brood larvae should be sampled to ascertain the need for insecticidal con-trol.
Development of Sampling Plans. The between-tree variation (8/) in leafminer egg density was modeled using TPL as In(8/) =-1.58
+
1.37 In(me)1.0
•
•
en
Q)c
~
0.5
0.0
0.0
•
•
0.5
•
•
•
•
• •
1.0
Eggs
•
•
1.5
2.0
Fig. 3. Relationship between the density of first-generation spotted tentiform leafminer eggs and subsequent larval density in untreated commercial apple orchards.
(n
=
32, mse=
2.67, 8.=
0.384, 8b=
0.215, r2 =0.57) and the within-tree variation (8;) in egg den-sity was modeled as In(s;) =0.627
+
1.39 In(mJ(n
=
41, mse=
0.245, s.=
0.098, Sb=
0.059, r2 =0.927). In both models me is the orchard-wide4
3
mean number of eggs per leaves 2, 3, and 4 of a fruit leaf cluster. Eggs per leaf cluster was used as the independent variable because these functions are also used in the computer generation of integer negative binomial distributed random variables that
•
•
•
Mine
density
2
1
a
•
•
I
Treated
•
-.,.-Not treated
Fig. 4. Box plots of second-generation spotted tentiform leafminer mine densities in orchards in which first-generation leafminers were treated with an insecticide and were not treated. The boxes denote the 25th to 75th percentile of the distribution of counts and the solid lines within the boxes are the medians (50th percentile). The lower and upper hinges indicate the 10th and 90th percentiles of the distributions and the solid circles are observations that fall outside of these ranges.
~
Q)D
E
:J
Z
8
6
4
2
"-...
---
clusters
••••••
••••••
...
__
---
trees
.•..•.
...
-..•...•.•...
--.•.
----
..•
---.---.
~~
---o
o
2
4
6
Mean density
8
10
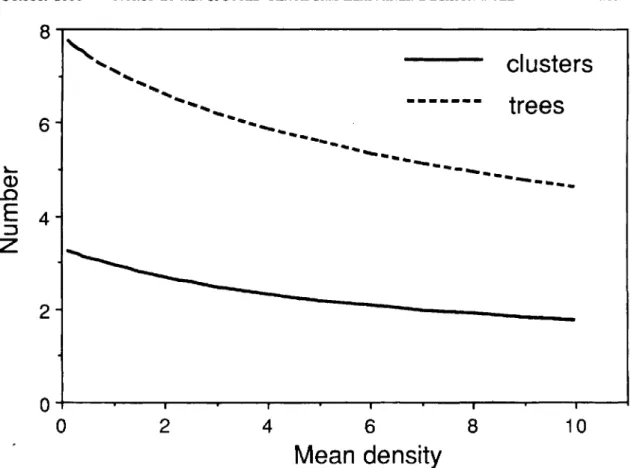
Fig.5. Optimal number of leaf clusters and trees to sample to estimate spotted tentiform leafminer eggs with minimum variance in20min.
describe sample observations. If eggs per leaf had been used as the independent variable, the same slopes would be obtained; however, the intercepts would be different. The time in seconds required to sample a leaf cluster within a tree was modeled as 33.3
+
3.1(m) (n = 19, mse = 98.14, s. =2.86,Sb=1.24, r2 =0.33) and the time required to move between trees was estimated to be 45 s. In this model, m is the mean number of eggs per leaf.
Shown in Fig. 5 are the optimal numbers of leaf clusters and trees to sample when 20 min is to be used for estimating the egg density. For the fixed-sample size procedure,
e*
andc*
were chosen for the threshold of two eggs per leaf. This was done to minimize the variance of a population estimate when the true population density is equal or close to the threshold. This in turn minimizes the prob-ability of making an incorrect treatment decision. As a result of choosinge*
andc*
for a density of two eggs per leaf, the actual sampling time will be greater for densities greater than two and the con-verse will be true for densities less than two.The variable intensity sampling plan is illustrat-ed in Table 1 and is usillustrat-ed in the following manner: . If the total number of eggs is less than the value
beneath the first column labeled "total eggs" or greater than the value beneath the last column with the same name, one cluster is taken at the next tree. If the total number of eggs is less than the
number beneath the second "total eggs" column and greater than or equal to the value beneath the first such column, two leaf clusters are sampled. Similarly, if the total number of eggs is greater than the value in the third "total eggs" column and less than or equal to the value in the last column with the same name, two leaf clusters are sampled. If the total number of eggs falls between the two values beneath the second and third columns la-beled "total eggs," three leaf clusters are sampled.
The stop limits for the sequential cluster sam-pling plan are listed in Table 2. For this procedure, three leaf clusters are sampled for each tree and decisions about the need for further sampling are first made after two trees are sampled and then after each subsequent tree is sampled. A maximum of seven trees is sampled before a decision is made. The actual and simulated variance components
(s/ and s/) are compared in Fig. 6 along with the regression models for the original data. A compar-ison of the models fit to the actual and simulated data revealed no significant differences (a =0.05) although the simulated between-tree component of the variance appears to have less variability than the empirical data. The similarity of the estimated and simulated values validates our procedure for generating negative binomial distributed random variables for use in simulating
P. blancardella
sam-pling.Table 1. Number of leaf clusters (e) to sample attbe next tree given the number of trees remaining to be sampled
(c,) and total number of leaf clusters sampled (n,) as a function of the total STLM eggs found
Total Total Total Total
c, Os e e e e e
eggs egg" eggs eggs
1 8 1 < 30 2:2< 31 2:3:5 78 >2:5 80 > 1 1 9 35 35 86 88 1 10 39 40 94 96 1 11 44 44 102 104 1 12 49 49 110 111 1 13 53 54 117 119 1 14 58 58 125 126 1 15 63 63 133 134 1 16 68 68 140 141 1 17 72 73 148 149 1 18 77 78 155 156 2 7 26 27 67 70 2 8 31 32 75 78 2 9 35 36 83 86 2 10 40 41 91 94 2 11 44 45 99 102 2 12 49 50 107 110 2 13 54 55 115 117 2 14 58 59 123 125 2 15 63 64 130 133 3 6 22 24 57 60 3 7 27 28 65 69 3 8 31 32 73 77 3 9 36 37 81 85 3 10 40 41 89 93 3 11 45 46 97 101 4 5 18 20 46 50 4 6 23 24 55 59 4 7 27 28 63 67 4 8 32 33 71 75 4 9 36 38 80 83 5 4 15 16 37 40 5 5 19 20 45 49 5 6 23 24 54 58 6 3 11 12 27 30
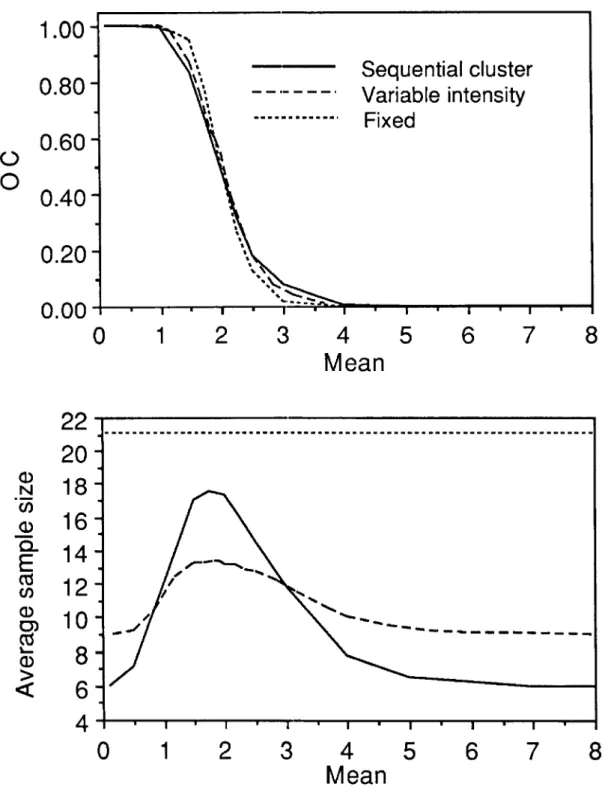
The OC curves for the fixed sample size, variable intensity, and sequential cluster sampling proce-dures are essentially the same (Fig. 7). The ASN for the VIS procedure is less than that for the se-quential cluster plan for means in the range of approximately one to three and greater than those for the sequential cluster plan outside of this range. Both VIS and sequential cluster plans have ASN functions greatly superior to the fixed sample size procedure. In this case, choice of either the VIS or sequential cluster procedure would rest on such factors as ease of implementation, and in the case of the VIS procedure, the desire to ensure that all
Table 2. Stop limits for a sequential sampling plan for classifying spotted tentiform leafminer eggs with respect to a threshold of two eggs per leaf
Tree Low limit Upper limit
1 2 34 2 13 59 3 26 82 4 40 104 5 54 125 6 69 146 7 126 126
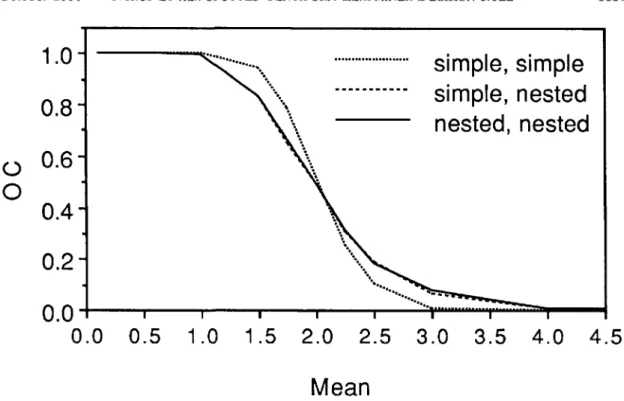
trees are sampled. Because the sequential cluster procedure was easier to explain to growers and to implement, we chose this procedure for field use. The effect of ignoring the nested variance struc-ture in developing and determining the perfor-mance of the sampling plan is illustrated in Fig. 8. The use of a simple variance model to construct the stop limits and to generate the random variables resulted in an OC that was noticeably better than those obtained when a nested variance structure was used to generate the random variables. Use of a simple variance model to construct the stop limits did not produce discernible differences in the OC curves. This is because the stop limits produced using the two different variance structures are es-sentially the same. Thus, the big effect on the OC curves occurred as a result of differences in the way random variables are generated. The impor-tance of the differences in the OC curves for the P. blancardella sampling plans is probably slight. However, the between-tree component of the vari-ance accounted for only approximately 10% of the total variance. In other systems where this portion of the variance is larger, the effects may be more important.
4
o
estimated within tree variance • simulated within tree variance2
--
regression model ...-CD (...) C CO0
"-CO>
--
c
-2
0time required to sample leafminer eggs using the variability intensity, sequential cluster, and fixed size sampling plans are illustrated in Fig. 9 along with a set of observed times for using the sequential cluster plan. The predicted times were calculated
using the ASN curves, the regression of the time required to sample a cluster-and-egg density per leaf, and the estimated time required to move be-tween trees. The observed times were obtained when the sequential cluster plan was used in 1989
Sequential cluster
Variable intensity
Fixed
8
7
6
4
5
Mean
3
2
1.00
0.80
0.60
()
0
0.40
0.20
0.00
0
1
---a>
Nen
a>
c...
E
ctS
en
a>
0)ctS
L-a>
>
«
22
20
18
16
14
12
10
8
6
4
o
1
2
3
4
5
Mean
6
7
8
Fig. 7. OC and ASN functions for fixed sample size, variable intensity, and sequential cluster sampling plans for spotted tentiform leaf miner eggs.
and they generally agreed with the predicted val-ues. Most importantly though, most decisions about the need for first-generation P. blancardella control can be made in as little as 10 min and the sequential procedures are time savers when compared with the fixed sample size procedure.
During four years (1984, 1985, 1988, 1989) the
threshold of two eggs per leaf was used to schedule insecticide treatments, 87% of leafminer popula-tions sampled were below the threshold (n = 79). In 1983 when a threshold of one per leaf was used, only 58% of the orchards were below the threshold. During the period 1984-1989, there was only one instance when a no-treatment deci'sion was arrived
4.5
4.0
3.5
simple, simple
simple, nested
nested, nested
3.0
2.5
2.0
1.5
...
".
•.•.•.•.'.
\\
.\
~\
1.0
0.5
0.0
0.0
0.2
0.4
0.6
0.8
1.0
()
o
Mean
Fig. 8. OC functions for sequential cluster sampling plans when stop limits and simulated random variables are based on a simple variance-mean model, when stop limits are based on a simple variance-mean model and random variables are based on a nested model, and when stop limits and random variables are based on a nested model.
Variable intensity
Sequential cluster
...
Fixed sample size
•
Observed - seq. cluster
1 0
8
4
6
Eggs per leaf
•...•...
.•...
"-""'".
..---
•..
--.
'---
.•..2
o
o
50
en
Q) +-':J
C40
E
c
30
Q)E
+-'20
C>c
a.
10
E
CO
C/)
Fig. 9. Estimated sampling times for fixed sample size, variable intensity, and sequential cluster sampling plans for spotted tentHorm leaf miner eggs, and observed times for using the sequential cluster plan.
at after sampling, yet more than one mine per leaf was later found. Thus, there is essentially no risk incurred by growers when using the decision rule. While there is little if any risk, widespread use of the rule would greatly reduce the prophylactic treatment of leafminers in New York apple or-chards.
Acknowledgment
We wish to thank M. Binns for helpful comments concerning the sequential sampling plans.
Reference Cited
Agnello, A., J. Kovach, J. Nyrop & H. Reissig. 1989. Simplified insect management program. A guide for apple sampling procedures in New York. Cornell Co-operative Extension (Ithaca), IPM Number 201A. Dutcher, J. D.& A.J. Howill. 1978. Bionomics and
control of Lithocolletis blancardella in Michigan.
J
Econ. Entomol. 71: 736-738.Green, T. A.& R. J. Prokopy. 1986. Visual moni-toring traps for the apple blotch leafminer moth Phyl·· lonorycter crataegella (Lepidoptera: Gracillariidae). Environ. Entomol. 15: 562-566.
Green, T., W. Coli, G. Hubbell & R. Prokopy. 1983. A visual monitoring trap for the apple blotch leaf-miner. Mass. Fruit Notes 48(2): 11-14.
Herbert, H. J.& K. B. McRae. 1983. Effect of tem-perature on the emergence of overwintering Phyl-lonorycter blancardella (Lepidoptera: Gracillariidae) and its parasite Apanteles ornigis (Hymenoptera: Braconidae) in Nova Scotia. Can. Entomol. 115: 1203-· 1208.
Hoy, C. W., C. Jennison, A. M. Shelton & J. T. An·· daloro. 1983. Variable intensity sampling: a new technique for decision making in cabbage pest man-· agement.
J.
Econ. Entomol. 76: 139-143.Iwao, S. 1975. A new method of sequential sampling to classify population relative to a critical density. Res. Pop. Ecol. 16: 281-288.
Marshall, K. B. & D. J. Pree. 1986. Effects of pyre-· throid insecticides on eggs and larvae of resistant and
susceptible populations of spotted tentiform leafmin-er. Can. Entomol. 118: 1123-1130.
Nyrop, J. P.&M. Binns. In press. Quantitative meth-ods for designing and analyzing sampling programs for use in pest management. In D. Pimentel [ed.]. Handbook of pest management in agriculture. CRC Press, Boca Raton, Fla.
Pottinger, R. P. & E.J.LeRoux. 1971. The biology and dynamics of Lithocolletis blancardella (Lepi-doptera: Gracillariidae) on apple in Quebec. Memoirs of the Entomological Society of Canada No. 77. En-tomological Society of Canada, Ottawa.
Pree, D. J., E. A. Hagley & C. M. Simpson. 1980. Resistance of the spotted tentiform leafminer, Phyl-lonorycter blancardella (Lepidoptera: Gracillari-idae), to organophosphorus insecticides in southern Ontario. Can. Entomol. 112: 469-474.
Pree, D.J.,D. B. Marshall &D. E. Archibald. 1986. Resistance to pyrethroid insecticide in the spotted tentiform leafminer Phyl/onorycter blancardel/a (Lepidoptera: Gracillariidae) in southern Ontario.
J.
Econ. Entomol. 79: 318-322.Reissig, W. H., R. W. Weires &C. G. Forshey. 1982. Effects of Gracillariid leafminers on apple tree growth and production. Environ. Entomol. 11: 958-963. Ridgway, N. M. & D. L. Mahr. 1985. Natural enemies
of the spotted tentiform leafminer, Phyllonorycter blancardella (Lepidoptera: Gracillariidae), in sprayed and unsprayed orchards in Wisconsin. Environ. Ento-mol. 14: 459-463.
Roelofs, W. L., W. H. Reissig&R. W. Wei res. 1977. Sex attractant for the spotted tentiform leafminer moth, Lithocol/etis blancardella. Environ. Entomol. 6: 373-374.
Taylor, L. R. 1961. Aggregation, variance, and the mean. Nature (Lond.) 189: 732-735.
Trimble, R. M. 1984. An attractant-baited sticky trap for monitoring the spotted tentiform leafminer, Phyl-lonorycter blancardel/a (Lepidoptera: Gracillari-idae). Can. Entomol. 116: 1581-1583.
Weires, R. W., D. R. Davis, J. R. Leeper & W. H. Reissig. 1980. Distribution and parasitism of grac-illariid leafminers on apple in the Northeast. Ann. Entomol. Soc. Am. 73: 541-546.
Received for publication 18 December 1989; accepted 20 April 1990.