GASTROINTESTINAL
Accuracy of multidetector-row CT for restaging after
neoadjuvant treatment in patients with oesophageal cancer
Agnieszka Konieczny&Philipp Meyer&Annelies Schnider&Paul Komminoth&Mathias Schmid&
Norbert Lombriser&Dominik Weishaupt
Received: 14 November 2012 / Revised: 18 February 2013 / Accepted: 21 February 2013 / Published online: 4 May 2013 # European Society of Radiology 2013
Abstract
Objectives To assess the diagnostic accuracy of 64-multidetector CT (MDCT) for restaging of patients with oesophageal cancer undergoing neoadjuvant therapy. Methods Results of pathological staging were correlated with those from 64-MDCT before and after neoadjuvant treatment in 35 patients using the American Joint Commit-tee on Cancer/TNM classification (7th edition). CT response was determined using the Response Evaluation Criteria in Solid Tumours (RECIST) method, modified for one-dimensional tumour diameter measurement.
Results 64-MDCT predicted T stage correctly in 34 % (12/35), overstaged in 49 % (17/35) and understaged in 17 % (6/35). Sensitivity/specificity values were as follows: T0, 20 %/92 %; T1–T2, 31 %/59 %; T3, 60 %/64 %; T4, 100 %/4 %. Negative predictive values for T3/T4 were 80 %/100 %. MDCT accurately predicted complete histo-pathological response in 20 % (accuracy 74 %) and overstaged in 80 %. Tumour regression grade was predicted
correctly in only 8 % (2/25) and underestimated in 68 % (17/25). Accurate N stage was noted in 69 % (24/35). Conclusion Although MDCT tends to be able to exclude advanced tumour stages (T3, T4) with a higher likelihood, the diagnostic accuracy of high resolution MDCT for restaging oesophageal cancer and assessing the response to neoadjuvant therapy has not improved in comparison to older-generation CT. Therefore, the future assessment of oesophageal tumour response should focus on combined morphologic and metabolic imaging.
Key Points
• Multidetector CT (MDCT) has been beneficial for the evaluation of many tumours.
• However diagnostic accuracy for restaging oesophageal cancer has not improved with MDCT.
• MDCT tends to be able to exclude advanced tumour stages (T3/T4).
• MDCT has a low accuracy for determining lymph node metastasis.
• Oesophageal tumour response should be assessed by combined morphological and metabolic imaging. Keywords Oesophageal cancer . Multidetector-row computed tomography . Neoadjuvant treatment . Tumour staging . Multislice computed tomography
Abbreviations
AJCC American Joint Committee on Cancer CT computed tomography
CR histopathological complete response
FDG-PET
fluoro-2-deoxyglucose positron emission tomography
Gy gray
kVp peak kilovoltage mAs milliampere second
MDCT multidetector-row computed tomography
A. Konieczny
:
D. Weishaupt (*)Institute of Radiology, Triemli Hospital, Birmensdorferstrasse 497, CH-8063 Zürich, Switzerland
e-mail: dominik.weishaupt@triemli.zuerich.ch
P. Meyer
:
A. SchniderDepartment of Visceral Surgery, Triemli Hospital, Birmensdorferstrasse 497, 8063 Zürich, Switzerland P. Komminoth
Institute of Pathology, Triemli Hospital, Birmensdorferstrasse 497, 8063 Zürich, Switzerland
M. Schmid
Clinic of Medical Oncology and Hematology, Triemli Hospital, Birmensdorferstrasse 497, 8063 Zürich, Switzerland
N. Lombriser
Department of Radio-Oncology, Triemli Hospital, Birmensdorferstrasse 497, 8063 Zürich, Switzerland
NR histopathological none response PET/
CT
fluoro-2-deoxyglucose positron emission tomog-raphy performed in a hybrid fashion with com-puted tomography
TRG tumour regression grade
Introduction
Latest cancer statistics confirm oesophageal cancer to be among the 10 most common malignancies leading to death [1]. The tumours are associated with a high mortality as most tumours are at the time of diagnosis in an advanced stage (T3/T4, N+, or M1) as a result of the late onset of symptoms [1]. So far, surgery remains the main therapy in curable oesophageal carcinoma [2]. By virtue of the poor prognosis of locally advanced oesophageal tumours (T3/T4, N+) with an overall 5-year-survival rate of 42 % after exclusive oesophagectomy, neoadjuvant multimodal treat-ments are frequently performed before surgery to induce tumour regression and improve outcome [3–7]. Current analysis shows that patients who respond to neoadjuvant treatment have a markedly better prognosis after surgery than non-responders [8,9]. Meredith et al. [10] showed that patients achieving a histopathological complete response (CR) following neoadjuvant treatment had a 5-year disease free survival and overall survival of 52 % and 52 %, respec-tively, compared with 22 % and 19 % in non-responders. A disease-specific 5-year-survival rate of even 68 % in com-plete histological responders after multimodality treatment was shown in a recent multicentre study [11]. The tumour response in patients with squamous cell carcinoma to neoadjuvant therapy may as well identify a group of patients with good prognosis, regardless of whether surgery with a high incidence of postoperative complications will be performed or not [12], and there are intensive discussions globally whether both responders and non-responders should be referred to surgery [13,14].
Identification of responders and non-responders to preop-erative treatment is therefore of paramount importance for prognosis of the individual patient with oesophageal cancer. Imaging plays a crucial role in this task. Endoscopic ultra-sound (EUS) has been shown to not accurately predict path-ologic stage in patients with oesophageal cancer who have received neoadjuvant treatment. Thus it should no longer be routinely performed for restaging purposes [15,16]. The most commonly used imaging investigations to reassess patients for resection after neoadjuvant treatment include computed to-mography (CT) and positron emission with fluoro-2-deoxyglucose (FDG-PET) preferably performed in a hybrid fashion as PET/CT [2,13,14,17–20]. Several studies have shown that contrast-enhanced CT has limited diagnostic ac-curacy for evaluation of therapeutic response. Using CT the
sensitivity/specificity values for assessment of tumour re-sponse of patients with oesophageal cancer undergoing pre-operative treatment range between 27–67 % and 33–93 % [21–28]. However, when analysing these studies it has to be pointed out that most were performed with single-slice CT which is no longer state-of-the-art CT equipment. It may been hypothesised that tumour response in patients with oesophageal cancer can be more accurately assessed by MDCT owing to its superior spatial resolution [28].
Therefore, the purpose of our study was to assess the diagnostic accuracy of 64-row MDCT for restaging of pa-tients with oesophageal cancer undergoing neoadjuvant therapy.
Materials and methods Patients
This retrospective study was approved by our institutional review board, and a waiver of informed consent was obtained. The study was performed in accordance with the principles of the Declaration Helsinki [29]. We retrospec-tively reviewed charts of 112 patients with biopsy-proven oesophageal cancer who underwent a gastro-oesophageal resection in our hospital between January 2004 and March 2012. Before surgery the clinical tumour stage of any of the included patients was either T3 N0, T1 to T3 with N1 to N3 disease or T4 Nx without metastasis (M0) and the need for neoadjuvant treatment was decided by the institutional multidisciplinary tumour board after careful review of all treatment options for the individual patient. Staging pro-cedures before neoadjuvant treatment included endoscopy with endoscopic ultrasonography with fine-needle aspira-tion and FDG-PET preferably performed in a hybrid fashion as PET/CT or multidetector CT of the chest and abdomen. A staging laparoscopy for oesophageal tumours of the lower third was optional.
For the current study the patients were only included if a 64-slice contrast-enhanced MDCT of the chest and abdomen before and after neoadjuvant treatment was available for review, whereas the time window between commencement and termination of the neoadjuvant treatment and subse-quent surgery should not have exceeded 8 weeks.
Preoperative combined radio-chemotherapy, chemotherapy only, surgery and final patient population
Radio- and chemotherapy were planned in parallel for a duration of 5 weeks. The gross tumour volume included the primary tumour and regional lymph nodes. The clinical target volume included areas at risk for microscopic disease with a 5 cm cranial and caudal margin and a 2 cm lateral
margin. A standard dose of 45–50.4 Gy in 25–28 fractions of 1.8 Gy was applied [30]. Eighteen patients with adeno-carcinoma and squamous cell adeno-carcinoma were additionally treated with two courses of combination chemotherapy (5-fluorouracil, cisplatin) as described in the literature [31,32]. Four patients with adenocarcinoma and squamous cell car-cinoma intravenously received two cycles of induction ther-apy with cisplatin and docetaxel. In those patients, chemoradiation started after the second induction chemo-therapy cycle. For 5 weeks patients underwent radiochemo-therapy as described above and weekly concomitant intravenous chemotherapy with cisplatin and docetaxel [30].
In 5 patients with adenocarcinoma and squamous cell car-cinoma two cycles of induction chemoimmunotherapy with cisplatin, docetaxel and cetuximab were given intravenously. This treatment was followed by chemoimmunoradiation thera-py with a radiotherathera-py standard dose of 45 Gy in 25 fractions of 1.8 Gy and concomitant chemotherapy administered on an outpatient basis with a weekly dose of docetaxel, cisplatin and cetuximab [33].
In 8 patients with adenocarcinoma of the oesophagogastric junction (classified as Siewert I and II) [34], the perioperative treatment consisted of combined chemotherapy with epirubicin, cisplatin and 5-fluorouracil (ECF) only. ECF was administered pre- and postoperatively, three cycles each [35]. Restaging with MDCT was performed 4–5 weeks after completion of neoadjuvant therapy. Surgery was performed 6–8 weeks after completion of the neoadjuvant treatment. Twenty-four patients underwent transthoracic oesophagectomy. In 5 patients transhiatal oesophagectomy was performed. Six patients were treated with total oesophagectomy.
Four patients did not undergo the entire regimen of preoperative therapy and were therefore excluded from the study. A contrast-enhanced 64-slice MDCT before and with-in 6 weeks after termwith-ination of the neoadjuvant treatment was unavailable for review in 73 patients.
The final study population consisted of 35 patients (mean age, 60.4 years; range, 42–73 years) who underwent neoadjuvant treatment with subsequent surgery. This group included 26 men (mean age, 61.1 years; range, 46–70 years) and 9 women (mean age, 58.4 years; range, 42–73 years). The histopathological cell type was adenocarcinoma in 25 patients (71.4 %) and squamous cell carcinoma in 10 pa-tients (28.6 %). In 8 papa-tients the tumour arose from the middle thoracic oesophagus. The lower thoracic oesophagus was involved in 12 patients and the gastro-oesophageal junction in 15 patients. Table 1 displays further specific details of the patient population.
Histopathological analysis and response evaluation
The Mandard grading system was used to determine the histo-pathological tumour regression in response to neoadjuvant
therapy as described in the literature [36]. The grading system is based on the presence of histopathological regressive changes. In grade 1 (complete regression) a specimen showed residual fibrosis without histologically identifiable residual cancer. Grade 2 involved the presence of rare residual cancer cells scattered through the fibrosis. Grade 3 showed an increase in the number of residual cancer cells, but fibrotic tissue still predominated. Grade 4 was characterised by residual cancer outgrowing fibro-sis. Grade 5 showed cancer without regressive changes. Tumour regression grade according to Mandard et al. [36] was defined in 26 of the 35 patients in the pathologist’s report.
The results of the analysis of the surgical specimen served as standard of reference.
CT protocol
All MDCT examinations of the chest and abdomen before and after initiation of neoadjuvant preoperative treatment were performed using 64-row MDCT (Lightspeed VCT 64; GE Healthcare, Milwaukee, Wis/USA).
Patient preparation included 500 mL of diluted oral con-trast medium (Telebrix Gastro; Guerbet AG, Zurich, Swit-zerland) followed by 30 g barium sulfate oesophageal cream (E-Z-EM, Inc., Lake Success, NY/USA). Eighty to one hundred millilitres of contrast material (Ultravist 300; Bayer Schering Pharma, Berlin, Germany) was administered intra-venously by a power injector at a rate of 2 mL/s followed by a bolus of 40 mL saline solution with a 70-s delay (portal venous phase). The thorax and abdomen were examined in the cranio-caudal direction during the portal venous phase (delay, 50–70 s). The following imaging parameters were used: tube voltage, 120 kVp; tube current, 180 mAs with automated modulation technique; section width, 1.25 mm (for a detector configuration 40 × 1.25 mm); rotation time, 0.6 s; pitch, 1.375. For image reconstruc-tion, a moderately smoothing convolution kernel (B30) and a 512 × 512 pixel matrix was used. We reconstructed axial images with a section width of 2 mm and an increment of 1.0 mm. Coronal and sagittal reformations were reconstructed using a standard CT workstation with the section width of 2 mm.
Image evaluation
All MDCT data were interpreted in consensus by two experienced radiologists with 15 years and 7 years of experience in interpreting gastrointestinal CT imaging using a picture archiving and communication system workstation (PACS) (Impax 6.4; AGFA Healthcare, Mortsel, Belgium). The two reviewers were blinded to the lesion location, size, clinical and surgical findings as well as the histopathological results. To ensure consis-tency in the evaluation of the pre- and post-adjuvant
therapy studies, data from both examinations were al-ways analysed during the same reading session.
Measurements were performed using the electronic cal-liper of the workstation.
Table 1 Patient characteristics, tumour histology, tumour location, changes in MDCT T and N stage between pre- and post-neoadjuvant therapy and comparison between post-therapy-MDCT and pathological
T and N staging; wall thickness changes between pre- and post-therapy MDCT, CT-TRG after neoadjuvant therapy at MDCT and comparison with P-TRG
Patient no./age (years)
G H L T stage Wall thickness
(mm) Response N stage Pre-CT Post-CT P Pre-CT Post-CT CT-TRG P-TRG Pre-CT Post-CT P 1/62 M AC EJ T4a T4a T3 15 15 SD / N2 N2 N3 2/66 M SCC Mid T3 T1/T2 T0 11 7 SD CR N0 N0 N0 3/60 M AC Low T4a T3 T0 24 12 PR CR N1 N0 N0 4/65 M SCC Mid T4b T4b T0 15 11 SD CR N3 N1 N0 5/61 M AC Low T3 T3 T2 19 11 SD PR N1 N1 N0 6/42 F AC EJ T3 T3 T2 24 10 PR DP N1 N0 N0 7/52 M SCC EJ T1/T2 T3 T0 29 21 SD / N1 N0 N0 8/64 M AC EJ T3 T3 T2 27 14 SD / N2 N1 N2 9/57 M AC EJ T3 T3 T1 11 11 SD / N1 N1 N1 10/73 F SCC EJ T3 T3 T3 14 10 SD PR N0 N0 N0 11/47 M AC EJ T3 T3 T3 19 10 SD PR N1 N1 N0 12/61 M AC Low T3 T3 T1 13 10 SD PR N1 N1 N0 13/63 M SCC EJ T3 T1/T2 T0 10 7 SD / N0 N0 N0 14/62 M AC Mid T1/T2 T0 T2 7 3 CR / N1 N0 N1 15/54 F SCC EJ T3 T1/T2 T0 15 10 SD CR N1 N0 N0 16/50 M AC Low T1/T2 T1/T2 T0 9 8 SD CR N0 N0 N0 17/70 M AC EJ T3 T3 T3 20 12 SD DP N1 N1 N1 18/58 M AC EJ T3 T3 T3 12 12 SD SD N0 N0 N0 19/68 M AC Low T4a T3 T1 12 12 SD PR N2 N0 N0 20/60 M AC Low T3 T1/T2 T0 15 7 PR CR N0 N0 N0 21/49 F AC Low T3 T1/T2 T2 15 9 SD PR N0 N0 N0 22/52 F SCC Mid T3 T1/T2 T2 12 5 PR SD N0 N0 N0 23/61 F SCC Low T1/T2 T0 T0 8 4 CR / N0 N0 N0 24/61 F SCC Mid T1/T2 T1/T2 T3 9 6 SD DP N0 N0 N0 25/69 M AC Low T4a T3 T2 17 13 SD PR N1 N1 N0 26/68 M AC EJ T3 T0 T0 16 4 CR / N2 N0 N0 27/46 M AC EJ T4a T3 T3 23 23 SD PR N2 N0 N1 28/67 M AC Low T3 T3 T3 15 12 SD SD N1 N1 N1 29/67 M AC Mid T3 T1/T2 T3 11 6 SD DP N2 N1 N3 30/61 F AC Mid T3 T1/T2 T3 10 6 SD PR N0 N0 N0 31/63 M AC Low T1/T2 T1/T2 T1 9 8 SD PR N0 N0 N0 32/62 M SCC Mid T1/T2 T1/T2 T0 8 6 SD CR N1 N1 N1 33/73 F AC EJ T4a T1/T2 T1 13 8 SD DP N2 N0 N0 34/53 M AC Low T0 T0 T1 * * * DP N0 N3 N1 35/67 M AC EJ T4a T4a T4b 22 22 SD – N3 N3 N3
MDCT multidetector computed tomography, CT-TRG computed tomography tumour regression grade assessed by modified Eastern Cooperative
Oncology Group criteria, P-TRG pathological tumour regression grade according to Mandard et al. [36], G gender, M male, F female, H histology, AC
adenocarcinoma, SCC squamous cell carcinoma, L location, Up upper thoracic oesophagus, Mid middle thoracic oesophagus, Low lower thoracic oesophagus, EJ, oesophagogastric junction, Pre-CT computed tomography before neoadjuvant therapy, Post-CT computed tomography after neoadjuvant therapy, CT-TRG computed tomography tumour regression grade assessed by modified Eastern Cooperative Oncology Group criteria,
P-TRG pathological tumour regression grade according to Mandard et al. [36], P pathological findings, CT computed tomography, * no tumour visible on
T staging
The tumour was staged by MDCT before and after neoadjuvant therapy according to the 7th edition of the AJCC/TNM classification [37–39]. The deepest tumour inva-sion determined the main tumour location (cervical oesopha-gus, upper thoracic oesophaoesopha-gus, middle thoracic oesophaoesopha-gus, lower thoracic oesophagus/ oesophagogastric junction) [39].
To access the tumour depth we defined an oesophageal wall thickness of equal to or wider than 5 mm as pathological [22,40–42]. Wall thickness was measured perpendicular to the lumen of the oesophagus. If the lumen was not visible the maximal transverse tumour diameter was obtained and multi-plied by a factor of 0.5 [24]. The wall thickness was deter-mined at the same tumour level in the preoperative follow-up study as in the baseline examination [28].
By modifying the classification system of Tio et al. [43] and Jones et al. [22] and consistent with the 7th TNM edition [37–39] the according MDCT T status was defined as follows: CT–T0: wall thickness less than 5 mm and without signs of mediastinal involvement. The CT–T1 and CT–T2 stages were combined because it was impossible to differentiate between the oesophageal wall layers on MDCT images. CT–T1 and CT–T2 stages were defined as having a wall thickness of at least 5–10 mm without evidence of mediastinal involvement. CT–T3 stage was defined when the tumour exhibited a wall thickness of greater than 10 mm with mediastinal involvement, but no invasion of adjacent structures was present. A CT–T4a (invasion of pleura, peri-cardium, diaphragm) and CT–T4b (invasion of other struc-tures e.g. aorta, vertebral body, trachea) were defined if the tumour had a wall thickness of greater than 10 mm and invaded adjacent structures.
N staging
For N staging we included regional lymph nodes extending from cervical perioesophageal to the celiac axis as described in the 7th edition of the AJCC/TNM classification [37–39]. Lymph nodes were regarded to be positive for malignancy with a short axis diameter of at least 10 mm [22, 43–45]. The N status using MDCT was staged as follows: N0 corresponded to no evidence of pathological regional lymph nodes. Metastases in 1–2 regional lymph nodes were staged as N1 and in 3–6 lymph nodes as N2. N3 was defined as metastasis in at least 7 regional lymph nodes [37–39]. M staging
The M staging was described as Mx if distant organ metas-tasis could not be assessed, M0 if no distant organ metasta-sis was evident and as M1 if distant organ metastametasta-sis was present [37–39].
CT response evaluation
To investigate the tumour response to neoadjuvant therapy at MDCT we used the World Health Organisation (WHO)/Response Evaluation Criteria in Solid Tumours (RECIST) method [46], modified for one-dimensional mea-surement, and correlated the results with the histopatholog-ical tumour regression grade (TRG) as described by Mandard et al. [22, 36]. Absence of tumour on post-treatment MDCT was defined as complete response, corre-lating with a TRG 1. A decrease of at least 50 % in tumour diameter was described as partial response, correlating with TRG 2. Stable disease matched the criteria of no increase or decrease of less than 50 % or increase of less than 25 % of tumour diameter, corresponding to a TRG 3. An increase of at least 25 % in tumour diameter was defined as a disease progression, being consistent with a TRG of 4 or 5. Statistics
Statistical analysis was performed by using statistical software (SPSS, version 17.0.1, SPSS, Chicago, Ill; Microsoft Excel 2010). Sensitivity, specificity, positive and negative predictive value as well as accuracy were evaluated. Agreement between histopathology and post-therapeutic T stage, histopathology and post-therapeutic N stage or tumour regression grade, re-spectively, was determined by calculating Cohen’s kappa values for tumour status, nodal status and tumour regression grade. A kappa value of less of 0.4 indicated poor to moderate agreement, between 0.4 and less than 0.75 indicated fair to good agreement and at least 0.75 indicated excellent agreement.
Results
The distribution of T and N stages among the patient pop-ulation based on MDCT imaging and following histopatho-logical analysis after surgery is displayed in Table2.
None of the tumours involved the cervical or upper thoracic oesophagus. The primary tumour was visible on MDCT before commencement of the neoadjuvant treatment
Table 2 Histopathological T and N staging characteristics of study population T0 T1/T2 T3 T4 Total N0 10 9 5 24 N1 1 3 3 7 N2 1 1 N3 2 1 3 Total 11 13 10 1 35
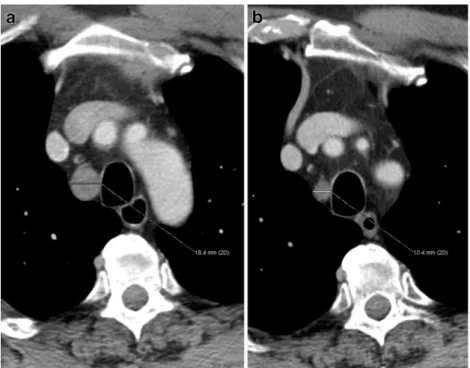
Fig. 1 A 67-year-old, correctly staged patient with adenocarcinoma of the lower thoracic oesophagus histopathological T3 N1 M0 disease. a Axial, pre-neoadjuvant therapy, contrast-enhanced MDCT at the level of the coronary sinus shows a circumferential oesophageal wall thick-ening with obliteration of the lumen. The maximal transverse tumour
diameter was obtained and multiplied by a factor of 0.5. b Axial, post-neoadjuvant therapy, contrast-enhanced MDCT image obtained at the same level shows a small (<50 %) decrease in oesophageal wall thickness. MDCT correctly predicted tumour regression grade as stable disease and accordingly staged the tumour as T3
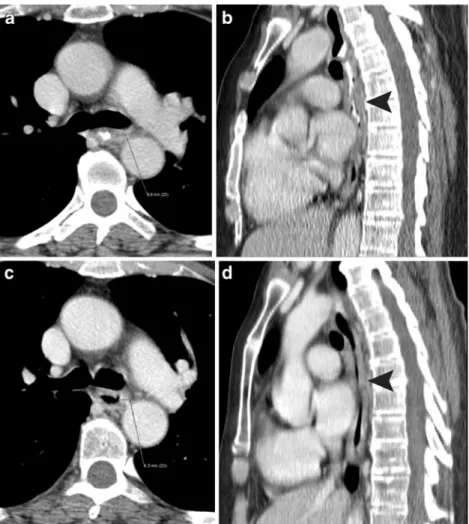
Fig. 2 A 61-year-old, understaged patient with histopathological T3 N0 M0 squamous cell carcinoma. a Axial pre-neoadjuvant therapy, contrast-enhanced MDCT shows an oesophageal wall thickening at the level of the left pulmonary artery. b Sagittal reformatted MDCT image shows focal dorsal wall thickening of the middle thoracic oesophagus, which was regarded as the location of the primary MDCT T1/2 tumour (arrowhead). c Axial post-neoadjuvant therapy, contrast-enhanced MDCT obtained at the same level shows a slight decrease in oesophageal wall thickening. d Sagittal
reformatted MDCT image shows a decrease in focal dorsal wall thickening (arrowhead), but the oesophageal wall appears to be generally thickened over a long distance. MDCT misinterpreted the findings as stable disease and understaged the residual tumour as T1/2. Histopathology even showed disease progression and a T3 tumour was found in the surgical specimen
in 34/35 (97 %) of cases. The tumour regression grade was evaluated in 25 patients as the tumour was not visible on MDCT in 1 of those 26 patients.
Prediction of post-therapeutic T stage
Overall the T stage was correctly predicted by 64-slice MDCT in 12 of the 35 patients (34 %) (Fig.1). Overstaging occurred in 49 % (17/35) and understaging occurred in 17 % (6/35) (Fig.2). Table3shows the diagnostic performance of 64-slice MDCT according to tumour stage. The results dem-onstrated high negative predictive values of 80 % and 100 % for T3 and T4 disease. When comparing the results of the pre- to the post-neoadjuvant therapy MDCT, the patients’ T status was downstaged in 46 % (16/35) and upstaged in 3 % (1/35). In one patient the tumour was not visible on MDCT. The kappa value between histopathology and T stage was poor (0.10).
Prediction tumour response
Ten of the 35 patients (28.6 %) showed a complete response (ypT0N0) to neoadjuvant therapy on histopathology. Two of those 10 patients (20 %) showed a complete response on MDCT using our criteria with a sensitivity of 20 %, speci-ficity of 96 %, positive predictive value of 67 %, negative predictive value of 75 % and an accuracy of 74 % (Table4). 64-slice MDCT overstaged 8 of the 10 complete patholog-ical responders and predicted T1–T2 stage in 5, T3 disease in 2 and T4 stage in 1 patient (Fig.3). The tumour regres-sion grade was predicted correctly by 64-slice MDCT in a total of only 8 % (2 of 25 patients). The degree of regression was overestimated in 24 % (6/25) and underestimated in 68 % (17/25) of patients. More specific information about
the regression grades for the 25 evaluated patients is listed in Table 5. The kappa value between histopathology and tu-mour regression grade was 0.01.
Prediction of post-therapeutic N stage
MDCT correctly staged the nodal disease in 69 % (24/35), overstaged in 17 % (6/35) and understaged in 14 % (5/35) of patients (Fig.4). The efficacy of MDCT for the specific N stages is shown in detail in Table6. Referring to the pre- and post-therapy MDCT the N stage was downstaged in 34 % (12/35) and upstaged in 3 % (1/35). The kappa value be-tween histopathology and post-therapeutic N stage was 0.4 Prediction of M stage
In none of the 35 patients was distant organ metastasis found using MDCT data sets.
Discussion
With only 34 % of patients having the T stage of their disease correctly predicted and 69 % having the N stage accurately predicted, this study demonstrates that restaging of oesophageal cancer after neoadjuvant therapy by high resolution 64-slice MDCT did not improve in comparison to single-slice CT. Therefore, the assumption made by some authors that higher spatial resolution as provided by MDCT technology will improve the diagnostic accuracy of MDCT could not be confirmed [26,27].
Our results revealed a diagnostic accuracy of 74 % using 64-row MDCT to predict complete pathological tumour response, which is slightly higher as compared with
Table 3 Computed data and diagnostic performance of 64-MDCT for T staging
T n TP TN FP FN Sensitivity (%) Specificity (%) PPV (%) NPV (%) Accuracy (%)
T0 11 2 23 2 8 20 92 50 74 71
T1/T2 13 4 13 9 9 31 59 31 59 49
T3 10 6 16 9 4 60 64 40 80 63
T4* 1 1 32 2 0 100 4 33 100 94
MDCT multidetector computed tomography, T tumour stage, * T4a and b calculated together, n number of patients with histological result, TP true positive, TN true negative, FP false positive, FN false negative, PPV positive predictive value, NPV negative predictive value
Table 4 Computed data and diagnostic performance of 64-MDCT for complete histopathological responders (ypT0N0)
n TP TN FP FN Sensitivity (%) Specificity (%) PPV (%) NPV (%) Accuracy (%)
ypT0N0 10 2 24 1 8 20 96 67 75 74
MDCT multidetector computed tomography, n number of patients with histological result, TP true positive, TN true negative, FP false positive, FN false negative, PPV positive predictive value, NPV negative predictive value
previous studies. However, the complete responder preva-lence of the included patients (only 28.6 %) was lower compared with published studies [22, 24,25]. Cerfolio et al. [25] showed a prevalence of 31 % complete responders and an accuracy of 71 % for CT to detect complete re-sponders when defining complete CT response as no visible tumour. Jones et al. [22] approached CT response using East-ern Cooperative Oncology Group criteria and dichotomised pathological response (responder versus non-responder) with a prevalence of 42 % responders and an accuracy of 52 %. Other groups [21,23,24] used the Mandard et al. criteria [36] to establish pathological response. They differed in the CT approach to determine responders using, for instance, tumour volume reduction of 50 % [21] or WHO criteria [23]. Swisher et al. [24] assessed the maximal oesophageal wall thickness and the relative percent change with treatment, showing that those changes were not significant. Beer et al. [28] showed that early changes in tumour diameter measured at the same
level, as is the case in our study, were not significant. How-ever, in the study by Beer et al. [28] only patients with adenocarcinoma restricted to the oesophagogastric junction were investigated using MDCT after 14 days of chemothera-py. We waived 3D-CT tumour volume measurements as van Heijl et al. [47] showed that tumour volume changes after 14 days of neoadjuvant radio-chemotherapy as measured by 3D-MDCT were not associated with histo-pathological tumour response.
The 74 % accuracy of predicting complete pathological responders and the fact that assessing the pathological tu-mour regression grade after neoadjuvant therapy with 64-slice MDCT was correct in only 8 % show that post-neoadjuvant therapy 64-slice MDCT cannot differentiate pathological responders from non-responders. Moreover, considering the high rate of overstaged complete patholog-ical responders, we affirm that despite the high resolution of MDCT the differentiation between viable tumour,
Fig. 3 A 66-year-old, overstaged histopathological complete respond-er (T0 N0 M0) with squamous cell carcinoma of the middle thoracic oesophagus. a Axial pre-neoadjuvant therapy, contrast-enhanced MDCT obtained at the level of the right superior pulmonary vein shows an asymmetric wall thickening of the oesophagus. b Decreased
thickening of the oesophageal wall on post-neoadjuvant therapy, axial, contrast-enhanced MDCT image obtained at the same level. As a result of the persistent slight wall thickening MDCT predicted stable disease and overstaged the tumour as T1/2 disease. However, the surgical specimen showed complete tumour regression
Table 5 Computed data and diagnostic performance of 64-MDCT for tumour regression grade
TRG n TP TN FP FN Sensitivity (%) Specificity (%) PPV (%) NPV (%) Accuracy (%)
TRG 1/CR 7 0 18 0 7 0 100 0 72 72
TRG 2/PR 10 0 11 4 10 0 73 0 52 44
TRG 3/SD 3 2 3 19 1 66 14 10 75 20
TRG 4+5/DP 5 0 20 0 5 0 100 0 80 80
MDCT multidetector computed tomography, TRG tumour regression grade, CR complete response, PR partial response, SD stable disease, DP disease progression, n number of patients with histological result, TP true positive, TN true negative, FP false positive, FN false negative, PPV positive predictive value, NPV negative predictive value
inflammation and scar tissue after neoadjuvant therapy is not possible using MDCT [26,41].
Our study confirms the results of previous authors [25, 27,48] that the ability of MDCT to differentiate between tumours from T1 to T3 stages remains poor as the different wall layers cannot be differentiated (sensitivity 31 %, 60 %; specificity 59 %, 64 % for T1/T2 and T3, respectively). In one patient with pathological T1N1 disease the tumour was not even visible on MDCT.
With regard to the study by Cerfolio et al. [25] which showed an accuracy of 76 % in distinguishing T4 from T1 to T3 disease, our results with high negative predictive values for T3 and T4 disease (80 %/100 %, respectively), although limited by the small number of patients, tend to confirm the trend of MDCT to be able to exclude those advanced tumour stages with a higher likelihood. These findings are important because MDCT is still widely applied for monitoring neoadjuvant therapy, restaging oesophageal cancer and, in consideration of those post-treatment MDCT results, defin-ing the further treatment such as curative surgery or pallia-tive methods.
Regarding the N staging, previous authors described a low diagnostic accuracy of CT for N stage ranging between 52 and 78 %, using cut-off values between 6 and 10 mm for lymph node diameter [21,22,25,49]. Our 64-slice MDCT study also shows a low accuracy of 69 % for determining the N stage, because it is not possible to differentiate between non-enlarged nodal metastasis and normal lymph nodes on MDCT. The result of our study that MDCT is of limited value for restaging of patients with oesophageal cancer following neoadjuvant treatment is in line with the results of the studies which assessed the value of morphologic imaging (including MDCT, MRI and EUS) for restaging of rectal or gastric cancer following neoadjuvant treatment. The reason for the limited value of MDCT in our study might be explained by the fact that changes due to fibrosis, inflammation and residual, viable tumour cannot be reliably distinguished [50, 51] and micrometastasis in normal sized lymph nodes cannot be ex-cluded by morphological imaging [52].
We acknowledge the following limitations. The first and most important limitation is the overall small population with only 10 of 35 patients (28.6 %) being classified as
Fig. 4 A 61-year-old patient with histopathological T3 N0 M0 adenocarcinoma of the middle thoracic oesophagus. a Axial pre-neoadjuvant therapy, contrast-enhanced MDCT shows an enlarged right paratracheal lymph node above the azygos vein. b Post-neoadjuvant therapy, contrast-enhanced MDCT at the same level shows a decreased, now borderline sized 10 mm lymph node. MDCT correctly predicted N0 disease
Table 6 Computed data and diagnostic performance of 64-MDCT for N staging
N n TP TN FP FN Sensitivity (%) Specificity (%) PPV (%) NPV (%) Accuracy (%)
N0 24 19 9 2 5 79 82 90 64 80
N1 7 4 21 7 3 57 75 36 88 71
N2 1 0 33 1 1 0 97 0 97 94
N3 3 1 32 0 2 33 100 100 94 94
MDCT multidetector computed tomography, N nodal stage, n number of patients with histological result, TP true positive, TN true negative, FP false positive, FN false negative, PPV positive predictive value, NPV negative predictive value
complete pathological responders (ypT0N0) to neoadjuvant therapy. Owing to the fact that only one patient had histo-pathological T4 disease, the high sensitivity and negative predictive value have to be interpreted with caution.
Second, considering the likelihood of asymmetric and random tumour regression, we only observed changes in tumour diameter at the same level, ignoring tumour diame-ter behaviour on upper or lower levels. Despite diamediame-ter changes due to post-treatment effects, asymmetric tumour regression could have led to an incorrect designation of tumour behaviour in our study. We waived defining the maximal tumour diameter or tumour volume after therapy, because previous studies showed that those changes on MDCT were not significant [24,47]. We wanted to analyse the tumour regression by using the modified WHO/RECIST methods [46], because they are a robust, standardised and clinically easily applicable method to access the response to neoadjuvant therapy with 64-slice MDCT for experienced and less experienced radiologists alike.
Third, by only taking the maximal lymph node diameter into consideration we missed the normal sized but patho-logically malignant lymph node metastasis. This might have led to an underestimation of nodal disease.
Moreover technical issues regarding the CT protocol such as the lack of a biphasic intravenous contrast agent adminis-tration or the use of thinner slices and reconstruction intervals might have influenced the results. Finally, we did not use advanced technical possibilities such as CT perfusion.
We conclude that although MDCT tends to be able to exclude advanced tumour stages (T3, T4) with a higher likelihood, the diagnostic accuracy of high resolution MDCT for restaging oesophageal cancer and assessing the response to neoadjuvant preoperative therapy has not im-proved in comparison to older-generation CT. Therefore, the future assessment of oesophageal tumour response to neoadjuvant therapy should focus on combined morpholog-ic and metabolmorpholog-ic imaging.
References
1. Siegel R, Naishadham D, Jemal A (2012) Cancer statistics, 2012.
CA Cancer J Clin 62:10–29
2. Ajani JA, Barthel JS, Bentrem DJ et al (2011) National compre-hensive cancer network. Esophageal and esophagogastric junction
cancers. J Natl Compr Canc Netw 9:830–887
3. Rice TW, Rusch VW, Apperson-Hansen C et al (2009) Worldwide
esophageal cancer collaboration. Dis Esoph 22:1–8
4. Lerut T, Moons J, Coosemans W et al (2008) Multidisciplinary treatment of advanced cancer of the esophagus and
gastroesopha-geal junction: a European center’s approach. Surg Oncol Clin N
Am 17:485–502
5. Urschel J, Vasan H (2003) A meta-analysis of randomized con-trolled trials that compared neoadjuvant chemoradiation and
surgery to surgery alone for resectable esophageal cancer. Am J
Surg 185:538–543
6. Gebski V, Burmeister B, Smithers BM, Foo K, Zalcberg J, Simes J (2007) Australian Gastro-Intestinal Trials Group. Survival benefits from neoadjuvant chemoradiotherapy or chemotherapy in oesophageal
carcinoma: a meta-analysis. Lancet Oncol 8:226–234
7. Sjoquist KM, Burmeister BH, Smithers BM et al (2011) Survival after neoadjuvant chemotherapy or chemoradiotherapy for resect-able oesophageal carcinoma: an updated meta analysis. Lancet
Oncol 12:681–692
8. Schneider PM, Baldus SE, Metzger R et al (2005) Histomorphologic tumor regression and lymph node metastases determine prognosis following neoadjuvant radiochemotherapy for esophageal cancer:
implications for response classification. Ann Surg 242:684–692
9. Berger AC, Farma J, Scott WJ et al (2005) Complete response to neoadjuvant chemoradiotherapy in esophageal carcinoma is
asso-ciated with significantly improved survival. J Clin Oncol 23:4330–
4337
10. Meredith KL, Weber JM, Turaga KK et al (2010) Pathologic re-sponse after neoadjuvant therapy is the major determinant of survival in patients with esophageal cancer. Ann Surg Oncol 17:1159–1167 11. Vallbohmer D, Hölscher AH, DeMeester S et al (2010) A
multi-center study of survival after neoadjuvant radiotherapy/chemother-apy and esophagectomy for ypT0N0M0R0 esophageal cancer. Ann Surg 252:744–749
12. Stahl M, Stuschke M, Lehmann N et al (2005) Chemoradiation with and without surgery in patients with locally advanced squa-mous cell carcinoma of the esophagus. J Clin Oncol 23:2310–2317 13. Wolf MC, Stahl M, Krause BJ et al (2011) Curative treatment of oesophageal carcinoma: current options and future developments. Radiat Oncol 6:55
14. Lorenzen S, von Gall C, Stange A et al (2011) Sequential FDG-PET and induction chemotherapy in locally advanced adenocarci-noma of the oesophagogastric junction (AEG): The Heidelberg Imaging program in Cancer of the Oesophago-gastric junction during Neoadjuvant treatment: HICON trial. BMC Cancer 11:266 15. Griffin JM, Reed CE, Denlinger CE (2012) Utility of restaging endoscopic ultrasound after neoadjuvant therapy for oesophageal cancer. Ann Thorac Surg 93:1855–1860
16. Misra S, Choi M, Livingstone AS, Franceschi D (2012) The role of endoscopic ultrasound in assessing tumour response and staging after neoadjuvant chemotherapy for esophageal cancer. Surg
Endosc 26:518–522
17. Lordick F, Ott K, Krause BJ (2010) New trends for staging and therapy for localized gastroesophageal cancer: the role of PET.
Ann Oncol 21(Suppl 7):vii294–i299
18. Jamil LH, Gill KR, Wallace MB (2008) Staging and restaging of
advanced esophageal cancer. Curr Opin Gastroenterol 24:530–534
19. Yen TJ, Chung CS, Wu YW et al (2012) Comparative study between endoscopic ultrasonography and positron emission tomography-computed tomography in staging patients with
esoph-ageal squamous cell carcinoma. Dis Esophagus 25:40–47
20. Rebollo Aguirre AC, Ramos-Font C, Villegas Portero R, Cook GJ, Llamas Elvira JM, Tabares AR (2009) 18F-fluorodeoxyglucose positron emission tomography for the evaluation of neoadjuvant therapy response in esophageal cancer: systematic review of the
literature. Ann Surg 250:247–254
21. Griffith JF, Chan AC, Chow LT et al (1999) Assessing chemother-apy response of squamous cell oesophageal carcinoma with spiral
CT. Br J Radiol 72:678–684
22. Jones DR, Parker LA Jr, Detterbeck FC, Egan TM (1999) Inadequacy of computed tomography in assessing patients with oesophageal carcinoma after induction chemoradiotherapy. Cancer
85:1026–1032
23. Kroep JR, Van Groeningen CJ, Cuesta MA et al (2003) Positron emission tomography using 2-deoxy-2-[18F]-fluoro-D-glucose for
response monitoring in locally advanced gastroesophageal cancer; a comparison of different analytical methods. Mol Imaging Biol
5:337–346
24. Swisher SG, Maish M, Erasmus JJ et al (2004) Utility of PET, CT, and EUS to identify pathologic responders in oesophageal cancer.
Ann Thorac Surg 78:1152–1160
25. Cerfolio RJ, Bryant AS, Ohja B, Bartolucci AA, Eloubeidi MA (2005) The accuracy of endoscopic ultrasonography with fine-needle aspiration, integrated positron emission tomography with computed tomography, and computed tomography in restaging pa-tients with esophageal cancer after neoadjuvant chemoradiotherapy. J
Thorac Cardiovasc Surg 129:1232–1241
26. Westerterp M, van Westreenen HL, Reitsma JB et al (2005) Esophageal cancer: CT, endoscopic US, and FDG PET for
assess-ment of response to neoadjuvant therapy—systematic review.
Radiology 236:841–851
27. Sloof GW (2006) Response monitoring of neoadjuvant therapy using
CT, EUS, and FDG-PET. Best Pract Res Clin Gastroenterol 20:941–957
28. Beer AJ, Wieder HA, Lordick F et al (2006) Adenocarcinomas of esophagogastric junction: multi-detector row CT to evaluate early response to neoadjuvant chemotherapy. Radiology 239:472–480 29. Association WM (2001) World Medical Association of Helsinki.
Ethical principles for medical research involving human subjects. Bull World Health Organ 79:373–374
30. Ruhstaller T, Widmer L, Schuller JC et al (2009) Multicenter phase II trial of preoperative induction chemotherapy followed by chemoradiation with docetaxel and cisplatin for locally advanced esophageal carcinoma (SAKK 75/02). Ann Oncol 20:1522–1528
31. Herskovic A, Martz K, al-Sarraf M et al (1992) Combined chemo-therapy and radiochemo-therapy compared with radiochemo-therapy alone in pa-tients with cancer of the esophagus. N Engl J Med 326:1593–1598 32. Medical Research Council Oesophageal Cancer Working Party
(2002) Surgical resection with or without preoperative chemotherapy in oesophageal cancer: a randomised controlled trial. Lancet 359:1727–1733
33. Ruhstaller T, Pless M, Dietrich D et al (2011) Cetuximab in combination with chemoradiotherapy before surgery in patients with resectable, locally advanced esophageal carcinoma: a pro-spective, multicenter phase lb-II trial (SAKK 75/06). J Clin
Oncol 29:626–631
34. Siewert JR, Stein HJ (1998) Classification of adenocarcinoma of
the oesophagogastric junction. Br J Surg 85:1457–1459
35. Cunningham D, Allum WH, Stenning SP et al (2006) Perioperative chemotherapy versus surgery alone for resectable gastroesophageal
cancer. N Engl J Med 355:11–20
36. Mandard AM, Dalibard F, Mandard JC et al (1994) Pathological assessment of tumour regression after preoperative chemoradiotherapy of oesophageal carcinoma. Clinicopathological correlations. Cancer
73:2680–2686
37. Edge SB, Byrd DR, Compton CC, Fritz AG, Greene FL, Trotti A (eds) (2009) AJCC cancer staging manual, 7th edn. Springer, New
York, pp 103–115
38. Rice TW, Blackstone EH, Rusch VW (2010) 7th edition of the AJCC cancer staging manual: esophagus and esophagogastric
junction. Ann Surg Oncol 17:1721–1724
39. Rice TW, Blackstone EH, Rusch VW (2010) A cancer staging primer: esophagus and esophagogastric junction. J Thorac Cardiovasc Surg
139:527–529
40. Desai RK, Tagliabue JR, Wegryn SA, Einstein DM (1991) CT evalu-ation of wall thickening in the alimentary tract. RadioGraphics
11:771–783
41. Kim TJ, Kim HY, Lee KW, Kim MS (2009) Multimodality assess-ment of esophageal cancer: preoperative staging and monitoring of
response to therapy. RadioGraphics 29:403–421
42. Noh HM, Fishman EK, Forastiere AA, Bliss DF, Calhoun PS (1995) CT of the esophagus: spectrum of disease with emphasis
on esophageal carcinoma. RadioGraphics 15:1113–1134
43. Tio TL, Cohen P, Coene PP, Udding J, den Hartog Jager FCA, Tytgat GNJ (1989) Endosonography and computed tomography of esophageal carcinoma: preoperative classification compared to the
new (1987) TNM system. Gastroenterology 96:1478–1486
44. Yoon YC, Lee KS, Shim YM, Kim BT, Kim K, Kim TS (2003) Metastasis to regional lymph nodes in patients with esophageal squamous cell carcinoma: CT versus FDG PET for presurgical detection prospective study. Radiology 227:764–770
45. Schneider PM, Metzger R, Schaefer H et al (2008) Response-evaluation by endoscopy, rebiopsy, and endoscopic ultrasound does not accurately predict histopathologic regression following neoadjuvant chemoradiation for esophageal cancer. Ann Surg 248:902–908
46. Therasse P, Arbuck SG, Eisenhauer EA et al (2000) New guidelines to evaluate the response to treatment in solid tumors. J Nat Cancer Inst 92:205–216
47. van Heijl M, Phoa SS, van Berge Henegouwen MI et al (2011) Accuracy and reproducibility of 3D-CT measurements for early response assessment of chemoradiotherapy in patients with oesophageal cancer. Eur J Surg Oncol 37:1064–1071
48. Quint LE, Glazer GM, Orringer MB, Gross BH (1985) Esophageal carcinoma: CT findings. Radiology 155:171–175
49. Ng CS, Husband JE, MacVicar AD, Ross P, Cunningham DC (1998) Correlation of CT with histopathological findings in pa-tients with gastric and gastro-oesophageal carcinomas following
neoadjuvant chemotherapy. Clin Radiol 53:422–427
50. Beets-Tan RG, Beets GL (2011) Local staging of rectal cancer: a
review of imaging. J Magn Reson Imaging 33:1012–1019
51. Barbaro B, Vitale R, Leccisotti L et al (2010) Restaging locally advanced rectal cancer with MR imaging after chemoradiation
therapy. RadioGraphics 30:699–716
52. Kwee RM, Kwee TC (2009) Imaging in assessing lymph node