Advance Access Publication 15 May 2009
Introduction
Adequate third order incisor inclination is an essential part of upper and lower dental arch adjustment and has both functional and aesthetic objectives ( Andrews, 1972 ; Hussels and Nanda, 1987 ; Perkins and Staley, 1993 ; O’Higgins et al. , 1999 ; Sarver, 2001 ; Sangcharearn and Ho, 2007 ). Axial incisor inclination has two aspects: root inclination and crown inclination. Crown inclination is commonly expressed in terms of third order angles ( Figure 1 ) and also includes the expression of the morphology of the labial enamel surface (LES). Several studies of incisor features have pointed out the infl uence of LES and crown – root angles (CRA) on axial incisor inclination ( Bryant et al. , 1984 ; Miethke and Melsen, 1999 ; McIntyre and Millett, 2003 ; van Loenen et al. , 2005 ). In the majority of radiographic inclination analyses, however, crown and root axes have been approximated to a straight line ( Steiner, 1959 ; Proffi t and Ackerman, 2000 ), a method which may be suffi ciently accurate in subjects with a CRA of approximately 180 degrees, but which may also, for example, mimic a more proclined upper incisor crown inclination in subjects with diminished CRA ( Delivanis and Kuftinec, 1980 ). Nevertheless, these cephalometric assessments not only
Systematic evaluation of the features infl uencing the accuracy of
third order measurements
Michael Knösel * , Klaus Jung ** , Thomas Attin *** , Rengin Attin **** , Dietmar
Kubein-Meesenburg * and Liliam Gripp-Rudolph *
Departments of * Orthodontics , ** Medical Statistics, University of Göttingen, Germany , *** Clinic for Preventive Dentistry, Periodontology and Cariology, University of Zürich and **** Private Practice, Zürich, Switzerland
SUMMARY The aims of this study were to evaluate the relationship of third order measurements on dental casts with those on lateral radiographs, and to identify those incisor features on radiographs which can best explain third order measurements on dental casts.
Lateral cephalograms and corresponding dental casts were obtained from 39 untreated Caucasians (12 males, 27 females; mean age 19.5 years; standard deviation 3.7 years) with occlusal relationships considered to be ‘ normal ’ . The upper (U1) and lower (L1) incisors were assessed with reference to the occlusal plane perpendicular which was established on the lateral radiographs, including third order angles (U1TR, L1TR) which were also derived from direct dental cast measurements (U1TA, L1TA). Both single regression and multiple linear regression analysis with stepwise variable selection were performed using third order measurements on casts as the dependent variable and crown axis (U1C, L1C), root axis (U1R, L1R), tip – apex connecting line (U1E, L1E), and radiographic third order measurements as independent variables.
Single regression analysis indicated an overall difference of 0.02 degrees between radiographic third order inclination and cast assessment in the maxilla (mandible: − 2.83 degrees). A change of 1 degree in radiographic third order inclination would produce a change of 0.65 degrees for U1TA and 0.86 degrees for L1TA assessments. Third order measurements on dental casts can best be explained by a linear combination of U1TR and U1E (maxilla) and of L1TR and L1C (mandible) measurements.
This study demonstrates the functional enmeshment between two different third order assessments and the most common incisor features on lateral radiographs. Both methods of third order evaluation show suffi cient reliability and are appropriate for routine orthodontic practice.
evaluate crown inclination but also allow judgement to be made of median complete crown – root inclination in comparison with established standards.
It is a well-established practice to refer to third order angles when describing the properties of straightwire brackets or the torque potential of incorporated archwires ( Andrews, 1972 ). Richmond et al. (1998) introduced a third order gauge suitable for crown inclination measurements. Although recent studies have highlighted advantages of measuring third order angles on casts or in vivo ( Ghahferokhi et al. , 2002 ; Devreese et al. , 2007 ; Knösel et al. , 2007 ), such as radio-hygienic incisor inclination control or transferability to straightwire bracket prescriptions, they can also be derived from lateral radiographs ( Creekmore and Kunik, 1993 ). Finally, third order measurements can be referenced from Andrews ’ ( 1972 ) initial crown inclination measurements, which have also been performed on casts and have provided the basis for the later development of the straightwire technique.
This study had two objectives: (1) to compare the cephalometric and the dental cast method for assessing incisor third order angles, particularly with reference to inter-observer concordance and to evaluate the infl uence of
inter-observer variation in occlusal plane (OP) determination, as a possible source of error, and (2) to investigate the functional relationship between the different cephalometric incisor features relevant for orthodontic treatment in relation to these third order angles.
Several single factors are likely to have an infl uence on third order assessments; e.g. crown inclination, root inclination, or axial inclination of the complete incisor. This study utilized single as well as multiple regression analysis (including stepwise selection of variables) to establish which of these variables could best explain the third order measurements on the casts. The purpose of the multiple regression with stepwise selection was to fi nd an equation that best predicts the Y variable (dental cast assessment) as a linear combination of the other ( X ) variables and, in addition, to clarify the functional relationships between the dependent (dental cast data) and independent (radiographic data) variables. Based on these results, the causes of variation in the dependent variable could be evaluated.
In addition to evaluating the relationship of measurements made on casts with those on radiographs using regression analyses, the following null hypotheses were tested.
1. There is no correlation of third order measurements on casts with any of the other variables (crown inclination, root inclination, and axial inclination of the complete incisor); i.e. the respective correlation coeffi cients are equal to 0.
2. Inter-observer assessment of the OP on radiographs is reliable; i.e. the mean difference of the measurements of the two observers is equal to 0.
The rejection of the null hypothesis (1) would indicate the possibility of individually and radio-hygienically assessing the infl uence of the X variables on third order
angles by means of regression analysis. The rejection of null hypothesis (2) would mean that measurements of two different observers result in signifi cantly different values.
Subjects and methods
Thirty-nine Caucasians [12 males, 27 females; mean age 19.5 years; standard deviation (SD) 3.7 years] were selected according to the following exclusion criteria: previous orthodontic therapy, primary teeth, missing teeth, incisor restorations, and morphological tooth anomalies. Normal occlusion cases were chosen in order to draw comparisons with established cephalometric and third order standards in the literature ( Andrews, 1972 ; Currim and Wadkar, 2004 ). Therefore, inclusion criteria were a neutral (Angle Class I) molar and canine relationship and an incisor relationship which was considered as normal sagittally and vertically (i. e. well supported by the antagonistic teeth and without any need for either deep or open bite correction). The assessment for eligibility was made by three orthodontists the Department of Orthodontics, University of Göttingen. The study received the approval of the local Ethics Committee.
Cephalometric measurements
Upper (U1) and lower (L1) incisor inclination, third order angles, and crown and root axis were analyzed on lateral radiographs, utilizing nine cephalometric lines ( Table 1 ; Figures 1 and 2 ).
All measurements were assessed with reference to the occlusal plane perpendicular (OPP; Figure 2 ). The OP was established on the lateral radiographs by drawing a line through the mesial cusps of the permanent upper and lower fi rst molars and bisecting the distance between the edges of the upper and lower central incisors. Each cephalographic tracing was performed, by hand, by two assessors (MK and LG-R). For third order radiographic measurements [upper central incisor (U1TR) and lower central incisor (L1TR) third order radiographic measurement], the tangent at the centre of the central incisor crown [facial axis (FA) point of the incisor clinical crown] was constructed. The FA point was determined by measuring the point of bisection at the LES, disregarding the fi rst millimetre at the labial cementoenamel junction (CEJ), which is normally covered by gingiva. Upper central (U1C) and lower central (L1C) incisor crown and root axes (U1R, L1R) were constructed using the point of bisection of the CEJ and incisor tip and root apex, respectively ( Figure 2 ). Finally, the entire incisor axis (U1E, L1E) was estimated using a line connecting the tip and apex.
To assess the observer variation with regard to the OP, the differences between the cephalometric tracings of assessors 1 and 2 were evaluated.
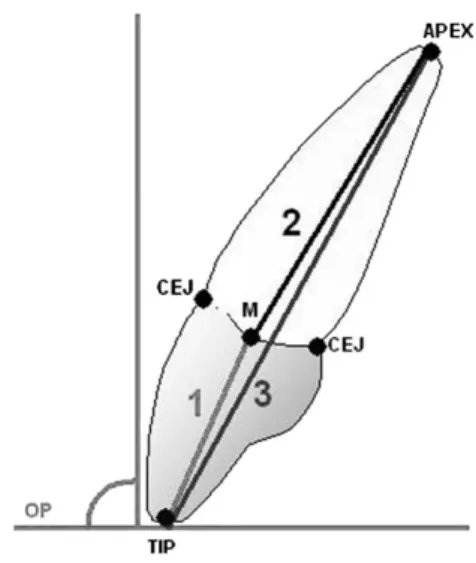
Figure 1 Diagram of upper (1, U1TA, U1TR) and lower (2, L1TA,
L1TR) third order angles, ranging from facial axis-point tangent (thin line) to occlusal plane perpendicular (OPP).
Third order measurements
Third order angles were derived from dental cast pairs, which were created at the same time as the corresponding lateral radiograph. The most proclined upper and lower central incisors were chosen, since these are easy to observe on lateral radiographs, and prepared for third order assessment by marking the FA point. The measurements were carried out using a custom-made incisor inclination gauge whose reliability has been proven in several studies ( Richmond et al. , 1998 ; Ghahferokhi et
al. , 2002 ; Knösel et al. , 2007 ). The device consisted of a
measuring table (dimension: 270 × 130 × 130 mm) with a central slot and a 180 degree protractor mounted beneath. The slot was fi tted with a brass tube which could be rotated, incorporating a retractable needle (diameter: 0.5 mm) serving as an indicator of inclination. For the assessments, the dental casts were mounted on a sliding platform (dimension: 100 × 100 × 15 mm) which was guided on a track on the measuring table ( Figure 3 ). The OP was maintained by positioning the maxillary dental casts on the measuring platform contacting molars and premolars. The dental casts were then adjusted horizontally, with the edge of the incisor perpendicular to the table ’ s protractor, and then guided forward against the rotational needle until it contacted the FA point. The excursion of the needle on the protractor then indicated the dental cast third order angle of the upper or lower central incisor (U1TA, L1TA;
Figure. 1 ). Third order values were defi ned as positive if the FA-point tangent was posteriorly inclined.
Statistical and error analysis
Statistics were performed using SAS 9.1 software (SAS Institute, Cary, North Carolina, USA).
Comparison of methods
The relationship between cephalometric and dental cast assessments was evaluated with Pearson ’ s correlation coeffi cient, r , and respective 95 per cent confi dence intervals. The correlation of two methods is signifi cantly different from 0 (with an a level of 0.05) if the confi dence interval (CI) does not include 0. The distributions of
Figure 2 Schematic diagram of radiographic landmarks and
measurements: incisor crown tip (TIP), incisor root apex (APEX), palatal and labial cementoenamel junction (CEJ), midpoint between the palatal and labial CEJ (M); incisor crown axis (1, U1C), root axis (2, U1R), and complete axial inclination (3, U1E) measurements in relation to the occlusal plane perpendicular.
Table 1 Cephalometric lines used for angular measurements. The occlusal plane (OP) was established on the lateral radiographs by drawing a line through the mesial cusps of the permanent upper and lower fi rst molars and bisecting the distance between the edges of the upper and lower central incisors. Further landmark descriptions are given in text.
Method Variable Reference lines
U1TA Y (dependent) Upper facial axis (FA)-point tangent (Cast) OP perpendicular
L1TA Y (dependent) Lower FA-point tangent (Cast) OP perpendicular
U1TR X 1 (independent) Upper FA-point tangent (Ceph ) OP perpendicular
L1TR X 1 (independent) Lower FA-point tangent (Ceph) OP perpendicular
U1E X 2 (independent) Upper tip – apex connecting line OP perpendicular
L1E X 2 (independent) Lower tip – apex connecting line OP perpendicular
U1C X 3 (independent) Upper crown axis OP perpendicular L1C X 3 (independent) Lower crown axis
OP perpendicular U1R X 4 (independent) Upper root axis
OP perpendicular L1R X 4 (independent) Lower root axis
OP perpendicular
measurements using different methods were compared using Wilcoxon ’ s ranked sum test for paired samples ( a level: 0.05).
Single and multiple regression
Single and multiple regression analyses were performed using the third order measurements on casts as the dependent variable ( Y ), whereas radiographic third order measurements ( X 1), complete incisor axis ( X 2), crown axis ( X 3), and root axis with reference to the OPP ( X 4) were specifi ed as being the independent variables ( Table 1 ). In addition, stepwise selection ( Hocking, 1976 ) was used to fi nd a linear combination of independent variables that best describes the measurements on the casts. The goodness of regression fi ts were assessed by the coeffi cient of determination, R 2 , which describes the degree of
variance explained by the estimated regression model.
Error analysis and comparison of both assessors
The measurements of both assessors were compared using Pearson ’ s correlation coeffi cient and Wilcoxon ’ s ranked sum test for paired samples. In the same way, third order measurements (U1TA, L1TA) repeated at an interval of 7 days by both assessors were compared. The inter-observer deviation of the OP was evaluated using the t -test and by calculating a normal 95 per cent CI for the mean difference.
Results
Descriptive sample analysis
The distributions of the angles measured by all methods are depicted in Figure 4a,b . The mean values of both assessors for radiographic third order angulation were for the maxilla 8.24 degrees [(SD 5.3); mandible: 1.59 degrees (SD 6.3)]
and 5.54 degrees for the maxilla [(SD 4.88); mandible: − 1.13 degrees (SD 6.81)] with the cast estimation . The means and SDs for both assessors and all variables are presented in Table 2 .
Comparison of methods
Wilcoxon ’ s ranked-sum test revealed that all distributions of the variables ( Y , X 1, X 2, X 3, X 4) were signifi cantly shifted pairwise (all P values were less than 0.001). However, the results of both methods of third order assessment (U1/L1TA, U1/L1TR) were highly correlated and there were also high correlations between the various incisor measurements on the radiographs and the third order cast assessments ( Table 3 , Figure 5a,b ). None of the 95 per cent CIs included 0. Hence, all correlations were signifi cantly different from 0 ( a = 0.05).
Single regression analysis
Single regression analysis was carried out prior to performing stepwise multiple regression analysis, in order to understand the functional relationships between the different variables. As can be seen from the results illustrated in Table 4 , there was an overall difference between radiographic third order inclination and cast measurements of 0.02 degrees in the maxilla and − 2.83 degrees in the mandible. A change of 1 degree in radiographic third order inclination (U1TR, L1TR) would produce a change of 0.65 degrees for the maxilla cast assessment (mandible: 0.86 degrees). Furthermore, the estimated overall difference between complete incisor inclination (U1E, L1E) and cast measurements was found to be − 18.04 degrees in the maxilla and − 20.70 degrees in the mandible. A change of 1 degree in incisor inclination would produce a change of 0.83 degrees for the maxilla cast assessment (mandible: 0.88 degrees).
Figure 4 Distributions of angular measurements in (a) maxilla and (b) mandible, where variables X 1 are
radiographic third order measurements (U1TR, L1TR); X 2 are complete axial inclination measurements (U1E, L1E); X 3 are crown axis measurements (U1C, L1C); X 4 are crown axis measurements (U1R, L1R); and Y are third order cast measurements (U1TA, L1TA).
Multiple regression analysis with stepwise selection
Although single stepwise regression gives an indication of the functional relationships of different tested variables, it is manifest from the relatively small R 2 values ( Table 4 ) that
single variables do not suffi ciently explain third order measurement outcomes.
Multiple linear regression with stepwise variable selection revealed that maxillary third order measurements ( Y
variable) on dental casts can be best explained by a linear combination of cephalometric third order angles ( X 1
variable) and complete incisor inclination ( X 2), whereas mandibular cast assessments can best be explained by a linear combination of cephalometric third order angles ( X 1) and lower crown axis measurements ( X 3). The estimated regression equations are
Y = − 11.86 + 0.35 X 1 + 0.51 X 2 for maxillary measurements and
Y = − 15.27 + 0.37 X 1 + 0.64 X 3 for mandibular measurements.
R 2 values were higher than in the single regression
analysis. The detailed results are presented in Table 5 .
Concordance of results between the two assessors
The data for the different methods revealed a high correlation between the judgements made by assessors 1 and 2. However, with Wilcoxon ’ s test ( a = 0.05), there were signifi cant shifts between the measurements of the two assessors with the exception of L1TR, L1C, and U1R ( Table 6 ). The highest correlations were obtained for third order cast measurements, similar to the maxillary third order radiograph assessment (U1TR), but less than that for mandibular measurements (L1TR). Figure 6a – d illustrate
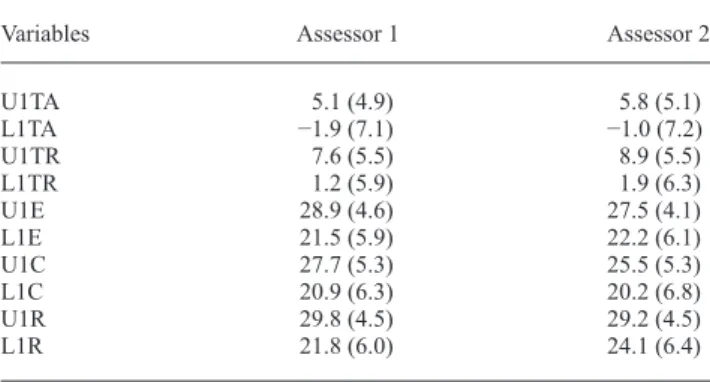
Table 2 Means and standard deviations for all variables measured, separately for both assessors.
Variables Assessor 1 Assessor 2
U1TA 5.1 (4.9) 5.8 (5.1) L1TA − 1.9 (7.1) − 1.0 (7.2) U1TR 7.6 (5.5) 8.9 (5.5) L1TR 1.2 (5.9) 1.9 (6.3) U1E 28.9 (4.6) 27.5 (4.1) L1E 21.5 (5.9) 22.2 (6.1) U1C 27.7 (5.3) 25.5 (5.3) L1C 20.9 (6.3) 20.2 (6.8) U1R 29.8 (4.5) 29.2 (4.5) L1R 21.8 (6.0) 24.1 (6.4)
Table 3 Correlation (Pearson’s coeffi cient r and 95 per cent confi dence intervals) of third order measurements on casts and lateral radiographs. Variables Assessor 1 2 Both U1TA/U1TR 0.79 (0.63, 0.89) 0.67 (0.44, 0.81) 0.72 (0.59, 0.81) L1TA/L1TR 0.60 (0.35, 0.77) 0.82 (0.67, 0.90) 0.74 (0.61, 0.82) U1E/U1TA 0.78 (0.62, 0.88) 0.73 (0.55, 0.86) 0.74 (0.61, 0.82) L1E/L1TA 0.80 (0.64, 0.89) 0.66 (0.44, 0.81) 0.73 (0.61, 0.82) U1C/U1TA 0.74 (0.55, 0.86) 0.73 (0.53, 0.85) 0.70 (0.56, 0.80) L1C/L1TA 0.83 (0.70, 0.91) 0.81 (0.66, 0.90) 0.81 (0.72, 0.88) U1R/U1TA 0.63 (0.39, 0.79) 0.56 (0.29, 0.74) 0.59 (0.42, 0.72) L1R/L1TA 0.74 (0.56, 0.86) 0.54 (0.27, 0.73) 0.64 (0.48, 0.76) U1E/U1TR 0.78 (0.61, 0.88) 0.72 (0.52, 0.85) 0.73 (0.61, 0.82) L1E/L1TR 0.55 (0.27, 0.74) 0.84 (0.72, 0.92) 0.69 (0.55, 0.79) U1C/U1TR 0.84 (0.72, 0.92) 0.90 (0.82, 0.95) 0.85 (0.78, 0.90) L1C/L1TR 0.50 (0.22, 0.71) 0.93 (0.87, 0.97) 0.71 (0.58, 0.81) U1R/U1TR 0.59 (0.34, 0.77) 0.35 (0.03, 0.60) 0.46 (0.26, 0.62) L1R/L1TR 0.51 (0.23, 0.71) 0.69 (0.50, 0.82) 0.59 (0.42, 0.72)
Figure 5 Correlations between (a) upper central incisor third order cast assessments on radiographs (U1TR)
and dental casts (U1TA) and (b) lower central incisor third order cast assessments on radiographs (L1TR) and dental casts (L1TA).
the correlation between third order measurements on the casts and lateral radiographs.
The mean difference in OP assessment between assessor 1 and 2 was − 0.39 degrees with a normal 95 per cent CI of ( − 0.80, 0.01). The t -test did not result in a rejection of the hypothesis that the mean difference was equal to 0 ( P = 0.06).
Error analysis
Measurement replications in the maxilla, after 7 days, showed a signifi cant positive correlation, whereas their shift did not signifi cantly deviate from 0 ( Table 7 ). Replications in the mandible were also positively correlated. However, the replications of one assessor were signifi cantly shifted from the fi rst measurements. The range of errors for third order measurements was calculated and is given in Table 8 . Discussion
Despite the disadvantages in evaluating incisor inclination radiographically, such as radiation exposure and inaccuracy, cephalometrics still constitute the diagnostic standard in incisor inclination analysis. Moreover, cephalometric analyses mostly coincide with reducing incisor features to a straight apex – edge connecting line. Thus, several authors have pointed out the infl uence of CRA and inter-individual variation in the LES on third order inclination and treatment results ( Bryant et al. , 1984 ; Germane
et al. , 1989 ; Miethke and Melsen, 1999 ; McIntyre and Millett, 2003 ; van Loenen et al. , 2005 ). However, it is
also customary to use third order angles to describe incisor crown inclination alone, although they do not provide information about either root features or their local relationship to hard tissue borders. Nevertheless, third order angles have been established as a standard for describing straightwire brackets and archwire properties as well as their interaction with teeth.
The null hypothesis (1) of no correlation between third order measurements on casts and other measurements was rejected. This allows an approach for calculating incisor features such as root inclination, crown inclination, and complete incisor inclination by regression analysis based on individual and radio-hygienically measured, third order values on dental casts. This means that the results of the multiple regression analysis in the present study assist in
Table 4 Single regression analysis with 95 per cent confi dence interval (95% CI) and R 2 values (dental cast measurements designated
as independent variable, Y ).
Regressor Intercept Slope R 2
Estimate 95% CI Estimate 95% CI Maxilla X 1 0.02 ( − 1.42, 1.46) 0.65 (0.51, 0.80) 0.52 X 2 − 18.04 ( − 23.10, − 12.98) 0.83 (0.65, 1.01) 0.54 X 3 − 11.85 ( − 16.01, − 7.70) 0.65 (0.50, 0.80) 0.49 X 4 − 13.78 ( − 19.95, − 7.61) 0.65 (0.44, 0.86) 0.35 Mandible X 1 − 2.83 ( − 3.98, − 1.68) 0.86 (0.68, 1.05) 0.54 X 2 − 20.70 ( − 25.00, − 16.41) 0.88 (0.69, 1.07) 0.54 X 3 − 19.74 ( − 22.92, − 16.57) 0.89 (0.74, 1.04) 0.66 X 4 − 18.09 ( − 22.90, − 13.28) 0.73 (0.52, 0.93) 0.41
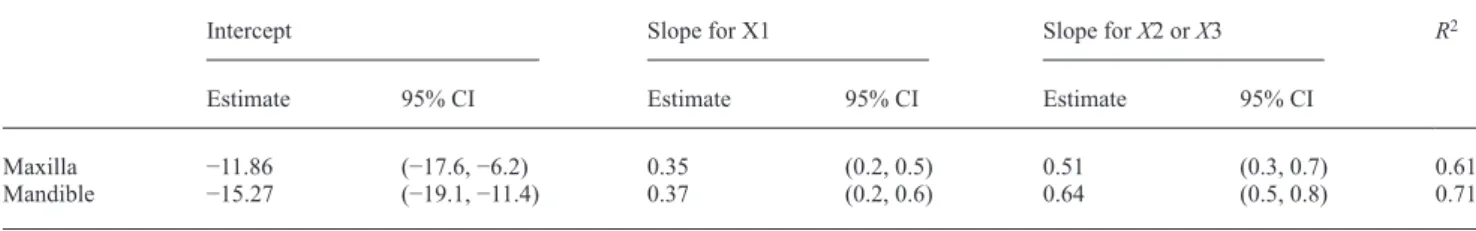
Table 5 Parameter estimates with 95 per cent confi dence intervals (CI) and R 2 values from the multiple regression analyses.
Intercept Slope for X1 Slope for X 2 or X 3 R 2
Estimate 95% CI Estimate 95% CI Estimate 95% CI
Maxilla − 11.86 ( − 17.6, − 6.2) 0.35 (0.2, 0.5) 0.51 (0.3, 0.7) 0.61
Mandible − 15.27 ( − 19.1, − 11.4) 0.37 (0.2, 0.6) 0.64 (0.5, 0.8) 0.71
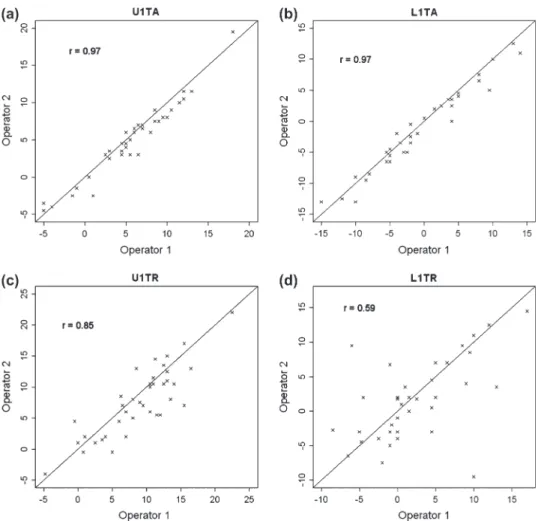
Table 6 Comparison of measurements of both assessors: Pearson’s correlation coeffi cient r and results from Wilcoxon’s test.
Method r Wilcoxon’s
test P value 95% Confi dence interval for difference
U1TA 0.97 0.0011 ( − 1.25, − 0.50) L1TA 0.97 0.0065 ( − 1.25, − 0.25) U1TR 0.85 0.0179 ( − 2.25, − 0.24) L1TR 0.59 0.3259 ( − 2.25, 0.75) U1C 0.92 <0.0001 (1.50, 3.25) L1C 0.93 0.1813 ( − 0.25, 1.50) U1R 0.60 0.8956 ( − 1.00, 1.50) L1R 0.86 0.0003 ( − 3.50, − 1.25) U1E 0.87 0.0007 (0.75, 2.50) L1E 0.91 0.0211 ( − 2.00, − 0.25)
clarifying the enmeshment of different approaches for describing incisor inclination.
The infl uence of different variables on third order values
Single regression analysis revealed the functional enmeshment of the different measurements. There was a very small overall difference between radiographic third order inclination and cast measurements of 0.02 degrees in the maxilla and a moderate difference of − 2.83 degrees in the mandible. A change of 1 degree in radiographic third order inclination (U1TR, L1TR) would produce a change of 0.65 degrees for
the maxillary cast assessment and 0.86 degrees for the mandibular third order assessment. Adopting a realistic view regarding the accuracy of third order corrections using straightwire appliances and incorporating sources of error, such as a loss of torque control, it can be concluded that both methods of acquiring third order data are appropriate for orthodontic purposes.
The estimated overall difference between complete incisor inclination and upper third order cast measurements of − 18.04 (mandible: − 20.70) degrees is plausible with regard to the natural variation of approximately 17 degrees for the range between the FA point tangent and upper incisor axis ( Bryant et al. 1984 ).
Figure 6 Inter-observer concordance of dental cast (U1TA, a; L1TA, b) and radiographic (U1TR, c; L1TR, d)
third order measurements.
Table 7 Comparison of replicate measurements taken initially and 7 days later.
Replications Assessor r P -value
correlation P -value Wilcoxon test
U1TA 1 0.96 <0.0001 0.5858
U1TA 2 0.97 <0.0001 0.8515
L1TA 1 0.97 <0.0001 0.0056
L1TA 2 0.97 <0.0001 0.1078
Table 8 Range of errors for third order measurements.
Replication Assessor Errors between – 3 and +3 degrees
U1TA 1 95%
U1TA 2 95%
L1TA 1 82%
In the case of stepwise multiple regression analysis, U1TA results can best be explained by a linear combination of U1TR and U1E and L1TA assessments by a linear combination of L1TR and L1C measurements. Whereas the strongest correlations between the two comparable types of third order measurements are quite plausible, it is on fi rst sight somewhat surprising that the lower crown inclination infl uence dominates. Possible explanations are given by the fact that CRA, in neutral occlusion subjects, are approximately 177.5 – 178.5 degrees for the upper incisors ( Delivanis and Kuftinec, 1980 ; Bryant et al. , 1984 ) and that the expression of the maxillary LES is subject to pronounced variation ( Bryant et al. , 1984 ). However, little consideration has been given in the literature to the issue of mandibular incisor LES and CRA. The question of discrepancies between crown and root axes found in this study can best be addressed by pointing out that maxillary and mandibular CRA seem to be almost equally pronounced ( Table 2 ). Group comparison results, however, indicate that lower incisor third order angles are slightly better correlated with crown inclination than complete axial inclination ( Table 3 ), implying less pronounced variation in mandibular LES.
The accuracy of both third order methods
Descriptive sample analysis indicates that third order assessments on casts underscored radiographic estimates at a mean of 2.7 degrees ( Table 2 ). However, both methods are in agreement with established crown inclination values for normal occlusion subjects ( Andrews, 1972 ; Currim and Wadkar, 2004 ).
Small inter-observer discrepancies in third order assessment methods may result from differences in determining the OP. The t -test, however, did not reject hypothesis (2) that the mean difference of the two observers is equal to 0.
In not rejecting this hypothesis, it is unfortunately not possible to conclude that it is true, i.e. inter-observer assessments of the radiographic plane of occlusion on radiographs are reliable. However, as the 95 per cent CI includes 0, it was assumed that the differences were not that large. Error analysis for cast assessments also did not show signifi cant differences in relation to intra-observer reliability (repeated measurements). It is therefore diffi cult to ascribe higher validity to either of the two methods as no gold standard exists for third order measurements.
Although third order estimates for both methods were strongly correlated between the two assessors, there was a signifi cant shift in measurements, with the exception of L1TR ( Table 6 ). However, for the dental cast method, higher correlations and smaller CIs for inter-observer shift were observed, indicating greater accuracy than with the cephalometric method. According to Baumrind and Frantz
(1971) , 93 per cent of the errors in radiographic axial incisor inclination measurements can be expected within − 3 and +3 degrees. Compared with that, the direct dental cast data in the present study are even more precise ( Table 8 ). Several investigators ( Richmond et al. , 1998 ; Ghahferokhi et al. , 2002 ; Knösel et al. , 2007 ) reported third order assessment accuracy and repeatability to exceed that of cephalometric estimation. Accordingly, inter-observer correlation analysis of radiographic and dental cast third order measurements, in this study, revealed a smaller variation for the cast method ( Figure 6a – d ).
Clinical implications
Inter-observer comparisons indicate that assessing third order angles using dental casts is a method that is suffi ciently reliable. The transferability of measured data to commonly used archwire and bracket prescriptions is another. The regression equations derived from the variable correlations in this study show the functional enmeshments between different third order measurements and all incisor characteristics relevant for orthodontic treatment, such as crown, root, or entire tooth inclination. That is, they are suitable for calculating the different incisor features on the basis of individual cast measurements, accurately and without the need for additional radiation exposure. The predictability of the different incisor features may be benefi cial for orthodontists in determining treatment plans.
Limitations of the study
This study was performed on a normal occlusion sample, with a CRA of approximately 178 degrees. However, investigations on Class II division 2 subjects have indicated a considerable variation in CRA ( Delivanis and Kuftinec, 1980 ; Bryant et al. , 1984 ; McIntyre and Millett, 2003 ). Therefore, it is conjectural whether the results of this study would also apply to subjects with distinctly reduced CRA.
The proposed method, incorporating dental casts for assessing third order angles, has a limitation in estimating an incisor ’ s local relationship with ‘ critical ’ hard tissue borders, such as upper incisor roots to the palatal cortical plate ( Horiuchi et al. , 1998 ). There is still a need for careful clinical and radiographic evaluation of hard and soft tissue borders and anterior teeth.
Third order assessments on dental casts are therefore not intended to substitute for lateral radiographs, but they may be suitable for avoiding or reducing the number of consecutive radiographs and, moreover, may contribute to the completeness of clinical monitoring.
Conclusion
Assessing third order angles on dental casts is a suffi ciently reliable method and one that is appropriate for routine orthodontic practice. The transferability of the data obtained
to commonly used archwire and bracket prescriptions is a further advantage. Third order angles can also be derived with suffi cient accuracy from lateral radiographs.
This study demonstrates the functional enmeshment between two different third order assessments and the most common features of incisors seen on lateral radiographs. The regression equations presented are appropriate for easily calculating the relevant features of incisors, on the basis of individual cast measurements, with suffi cient accuracy. Additional exposure to radiation can be avoided, thereby reducing the number of consecutive lateral radiographs during orthodontic treatment.
Address for correspondence Dr Michael Knösel Department of Orthodontics Center of Dentistry University of Göttingen Robert-Koch-Street 40 37099 Göttingen Germany E-mail: [email protected] References
Andrews L F 1972 Six keys to normal occlusion . American Journal of Orthodontics 62 : 296 – 309
Baumrind S , Frantz R C 1971 The reliability of head fi lm measurements. 2. Conventional angular and linear measures . American Journal of Orthodontics 60 : 505 – 517
Bryant R M , Sadowsky P L , Hazelrig J B 1984 Variability in three morphologic features of the permanent maxillary central incisor . American Journal of Orthodontics 86 : 25 – 32
Creekmore T D , Kunik R L 1993 Straight wire: the next generation . American Journal of Orthodontics and Dentofacial Orthopedics 104 : 8 – 20
Currim S , Wadkar P V 2004 Objective assessment of occlusal and coronal characteristics of untreated normals: a measurement study . American Journal of Orthodontics and Dentofacial Orthopedics 125 : 582 – 588 Delivanis H P , Kuftinec M M 1980 Variation in morphology of the
maxillary central incisors found in Class II, division 2 malocclusions . American Journal of Orthodontics 78 : 438 – 443
Devreese H , De Pauw G , Van Maele G , Kuijpers-Jagtman A M , Dermaut L 2007 Stability of upper incisor inclination changes in Class II division 2 patients . European Journal of Orthodontics 29 : 314 – 320
Germane N , Bentley B E , Isaacson R J 1989 Three biological variables modifying faciolingual tooth position by straight wire appliances . American Journal of Orthodontics and Dentofacial Orthopedics 96 : 312 – 319
Ghahferokhi A E , Elias L , Jonsson S , Rolfe B , Richmond S 2002 Critical assessment of a device to measure incisor crown inclination . American Journal of Orthodontics and Dentofacial Orthopedics 121 : 185 – 191 Hocking R R 1976 The analysis and selection of variables in linear
regression . Biometrics 32 : 1 – 50
Horiuchi A , Hotokezaka H , Kobayashi K 1998 Correlation between cortical plate proximity and apical root resorption . American Journal of Orthodontics and Dentofacial Orthopedics 114 : 311 – 318
Hussels W , Nanda R S 1987 Effect of maxillary incisor angulation and inclination on arch length . American Journal of Orthodontics and Dentofacial Orthopedics 91 : 233 – 239
Knösel M , Kubein-Meesenburg D , Sadat-Khonsari R 2007 The third-order angle and the maxillary incisor’s inclination to the NA line . Angle Orthodontist 77 : 82 – 87
McIntyre G T , Millett D T 2003 Crown-root shape of the maxillary central incisor . Angle Orthodontist 73 : 710 – 715
Miethke R R , Melsen B 1999 Effect of variation in tooth morphology and bracket position on fi rst and third order correction with preadjusted appliances . American Journal of Orthodontics and Dentofacial Orthopedics 116 : 329 – 335
O’Higgins E A , Kirschen R H , Lee R T 1999 The infl uence of maxillary incisor inclination on arch length . British Journal of Orthodontics 26 : 97 – 102
Perkins R A , Staley R N 1993 Change in lip vermilion height during orthodontic treatment . American Journal of Orthodontics and Dentofacial Orthopedics 103 : 147 – 154
Proffi t W R , Ackerman J L 2000 Orthodontic diagnosis: the development of a problem list . In: Proffi t W R (ed). Contemporary orthodontics . 3rd edn. Mosby , St Louis , pp. 170 – 185
Richmond S , Klufas M L , Sywanyk M 1998 Assessing incisor inclination: a non-invasive technique . European Journal of Orthodontics 20 : 721 – 726 Sangcharearn Y , Ho C 2007 Maxillary incisor angulation and its effect on
molar relationships . Angle Orthodontist 77 : 221 – 225
Sarver D M 2001 The importance of incisor positioning in the esthetic smile: the smile arc . American Journal of Orthodontics and Dentofacial Orthopedics 120 : 98 – 111
Steiner C C 1959 Cephalometrics in clinical practice . Angle Orthodontist 29 : 8 – 29
van Loenen M , Degrieck J , De Pauw G , Dermaut L 2005 Anterior tooth morphology and its effect on torque . European Journal of Orthodontics 27 : 258 – 262