Introduction
A disadvantage of classical thermal analysis (TA) is that gases released from the probe sample during the mea-surement are normally not analyzed. This shortcoming can be overcome by coupling TA with mass spectrome-try (MS) or Fourier-Transform-Infrared (FTIR) spec-troscopy. The main advantage of the coupled techniques TA-MS and TA-FTIR is the identification of gaseous products, which together with the thermal effects (DTA) and mass changes (TG) allow a more thorough investi-gation of the target reaction. The qualitative analysis is routinely performed by comparing recorded spectra with key fragment ions and their relative intensities for known elements and compounds (MS) or with reference spectroscopic signals (FTIR). The development of TA-FTIR and TA-MS hyphenated techniques has been reviewed by Materazzi et al. [1–3].
Besides the identification of evolved gases, their quantification by FTIR [4–6] or MS [4, 7–9] spec-trometry has been addressed. Quantification is espe-cially important when investigating multistage de-composition reactions, or, when two or more gases evolve simultaneously. In such cases the
thermo-analytical methods alone fail for the quantitative de-scription of the investigated process and have to be coupled with MS or FTIR enabling quantitative and qualitative determination of the evolved gases.
The common method of quantification of spectro-metric signals is time-consuming and requires the appli-cation of gaseous mixtures with well-defined composi-tion. First quantification of evolved gases based on the pulse technique combined with TA systems was re-ported by Maciejewski et al. [8, 10]. The extension to FTIR-TA coupled technique was investigated by Eigenmann et al. [11, 12] by decomposing solids with known stoichiometry of the decomposition process and by injection of liquids into the TA-FTIR system. Marsanich et al. [13] applied the gas-pulse calibration using ammonia, carbon monoxide and carbon dioxide. They introduced the vaporization technique of liquid samples for calibration of the FTIR signals. Similar pro-cedure was applied also by Slager and Prozonic [14].
Quantification using MS combined with the pulse calibration technique is facilitated by the fact that the linear relationship between the observed intensities of the ion current and the amount of the analyzed species is hold in a wide concentration range. Furthermore the
INFLUENCE OF MEASURING CONDITIONS ON THE QUANTIFICATION
OF SPECTROSCOPIC SIGNALS IN TA-FTIR-MS SYSTEMS
F. Eigenmann, M. Maciejewski and A. Baiker
*Department of Chemistry and Applied Biosciences, ETH-Hoenggerberg, Swiss Federal Institute of Technology, 8093 Zürich, Switzerland
Simultaneous thermal analysis (TA) and evolved gas analysis by mass spectrometry (MS) and/or Fourier transform infrared spec-troscopy (FTIR) is a powerful hyphenated technique combining direct measurement of mass loss and sensitive spectroscopic analy-sis. In the present study the influence of several experimental parameters which may affect the quantification of FTIR signals have been studied using a combined TA-FTIR-MS system. Parameters studied include: sample mass (1–400 mg), carrier gas flow rate (25–200 mL min–1), resolution of the FTIR spectrometer (1–32 cm–1), and location of injection of the calibrating gas.
MS analysis, which was not significantly affected by the experimental conditions, was used as a reference for assessing the accuracy of quantification by FTIR. The quantification of the spectroscopic signals was verified by the decomposition (NaHCO3) or dehydration (CuSO4·5H2O) of compounds with well-known stoichiometry.
The systematic study of the parametric sensitivity revealed that spectral resolution and carrier gas flow rate, which affect the acquisition time in the IR-cell, are key parameters that must be adjusted carefully for reliable quantification. The dependence of the reliability of quantification on these parameters is illustrated and conditions leading to proper quantification are discussed. As an example, for a standard spectral resolution of 4 cm–1and a FTIR gas cell volume of 8.7 mL, the carrier gas flow must be lower than 100 mL min–1for warranting accurate results (relative deviation <2%). The concentration range of analyzed species is limited but can be extended by proper selection of the wavenumber regions for molecules giving strong IR signals.
Keywords: calibration techniques, hyphenated techniques, pulse TA combined with FTIR, quantitative evolved gas analysis,
TA-FTIR-MS
MS data acquisition time is generally short and record-ing evolved gases can be achieved with a high time res-olution. In contrast, quantification of evolved gases in TA-FTIR systems is complicated by the fact that the Lambert–Beer’s law is often valid only in a small con-centration range, and consequently the amount of in-jected gas by the single-point calibration must closely match that evolved during decomposition. Addition-ally the data acquisition time in FTIR is only compara-ble with that applied in MS when choosing poor spec-tral resolution (e.g. 32 cm–1). The other parameters such as residence time in the IR-cell are also important for achieving high accuracy in data collection.
A closer look on the experimental conditions ap-plied in the various reported TA-FTIR studies indicates that in certain cases the conditions deviate significantly from the optimal settings for quantification of FTIR traces. Some experimental conditions used for TA-FTIR investigations are listed in Table 1 [4, 6, 14–22]. Com-parison of acquisition time and residence time describes the precision and completeness of the recorded traces: values of this ratio below or equal one indicate a big likelihood that each molecule could be detected and contributed to the integral intensity of recorded traces. Values above one indicate that most likely some of the target molecules did not contribute to the signal thereby lowering the accuracy of quantification. This is espe-cially important, if pulse calibration is applied, resulting in generally sharp peaks, which can result in the situa-tion that under extreme condisitua-tions (high quotient of ac-quisition time divided per residence time) the pulses are not fully recorded.
Preliminary investigations clearly indicated a significant influence of improper experimental set-tings on the accuracy of the quantification of IR spec-tra by the pulse technique. The importance of this as-pect for proper application of FTIR in combined TA-FTIR systems has prompted us to study systemat-ically the influence of the experimental conditions on the quantitative interpretation of FTIR traces.
Experimental
MethodsExperiments were carried out on a Netzsch STA 449 analyzer equipped with two pulse devices enabling injection of a certain amount of one or two different gases or gaseous mixtures into the carrier gas stream flowing through the system. The amount of injected gas could be changed from 0.01 to 2.0 mL. Volumes of 0.25, 0.5, 1.0 and 2.0 mL were mainly used.
Additionally the option of bypassing the thermo-analyzer by injecting species after the thermothermo-analyzer (into the transfer-line) was used, which enabled cali-bration without contact of the calibrating pulse with
the investigated sample. This alternative method re-sults in much sharper signals and therefore calibration is less accurate (vide infra).
The carrier gas flow rate was controlled by mass flow controllers, Brook’s model 5850E, based on a thermal mass flow sensing technique. Helium and ar-gon (purity 99.999%, PanGas) were used as carrier gases with flow rates from 12.5 to 200 mL min–1. The thermoanalyzer was connected by a heated (ca. 200°C) transfer-line to a Bruker Vector 22 FTIR spectrometer. Gases leaving the FTIR spectrometer were passed through a heated (ca. 200°C) capillary to a Pfeiffer Omni Star GSD 301 O mass spectrometer.
The FTIR spectrometer is equipped with a MCT detector and an especially developed low-volume gas cell (8.7 mL) with a 123 mm path length and ZnSe win-dows. To avoid condensation of low volatile com-pounds the cell was heated to a constant temperature of 200°C. The whole FTIR compartment was continuously purged by nitrogen and additionally molecular sieves were used to minimize the water and carbon dioxide background in the recorded spectra. The resolution of the collected spectra was set between 1 and 32 cm–1and co-addition of 4 scans per spectrum was applied. As a consequence spectra were recorded with a time resolu-tion of about 2–20 s, depending on the integraresolu-tion meth-ods and applied FTIR spectral resolution.
MS measurements were performed directly after the FTIR chamber resulting in similar temporal traces of the evolved species. The few characteristic mass to charge ratios (e.g. for CO2and H2O m/z=44 and 18,
respectively) were monitored vs. temperature or time in the multiple ion detection mode. Data acquisition time was relatively short, generally about 2 s. Such an acquisition time could only be applied on cost of low resolution i.e. 32 cm–1in the FTIR system.
Materials
NaHCO3(p.a. Merck) and CuSO4·5H2O (Fluka AG)
were used as reference samples with well-known stoichiometry of the decomposition. In order to check the behavior of the system in a wide range of CO2concentrations the sample mass of NaHCO3was
varied between 2 and 420 mg, while the sample mass of CuSO4·5H2O was 50 mg.
For the gas injections a home-made device was placed before the thermoanalyzer. It contains a rotary sample valve enabling a carrier gas to purge the loop of a given volume, which had been previously filled with the calibration gas of known composition (CO2, purity
99.990%, PanGas). In order to quantify the FTIR sig-nals, pulses of a known volume were injected generally before the decomposition of the investigated sample. A standard heating rate of 10 K min–1was applied for all decompositions.
Table 1 Comparison of TA-FTIR sy stems with different measuring conditions Apparatus R eference Resolution/cm –1 Co-adding/scans A cq. tim e/s F low rate/m L m in –1 Vol. IR cell/m L R esid. tim e/s Quotient Acq. t/Res. t Bruker IFS 28 Post [15] 4 1 0 ca. 10 15 8.7 34.8 0 .3 P erkin Elm er P itkänen [16] 8 4 ca. 4 8 9 ca. 10 ca. 7 0 .6 Digilab F TS 60 Mittlem an [4] 8 1 6 ca. 5 5 0 6 7.2 0 .7 Bruker E quinox Barontini [17] 4 1 6 9 .5 60 8.7 8 .7 1.1 Bruker E quinox Jackson [18] 4 – 17.5 3 5 8 .7 14.9 1 .2 IBM IR 8 5 B assilakis [19] – – 30 – 555.6 2 5 1 .2 Digilab F TS 7 C ai [6] 8 16 13 10 6 7 .2 1.8 Midac and Nicolet A vatar S lager [14] 4 32–45 60 100 30 18 3.3 Nicolet M agna 750 Perez/Ponze [20] 16 3 ca. 3 5 0 0 .49 0 .6 5 Bruker V ector 22 Balabanovic [21] 2 1 6 7 5 100 19.7 11.8 6 .4 Pe rkin Elme r Groenewoud [22] – – ca. 60 95 4.8 3 20
Results and discussion
From preliminary investigations [12] it emerged that the following experimental parameters can affect the accuracy of the quantification of FTIR signals: sam-ple mass, place of the injection of the calibrating gas, carrier gas flow, resolution of the spectrometer and accordingly acquisition time in the IR cell. FTIR data were compared with the simultaneously gained MS data, which allowed significant optimization of the various parameters and led to increase of the accuracy of the FTIR quantification method.
Influence of sample mass and concentration of the target gas
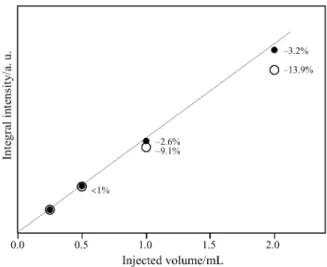
The application of PulseTA®for quantitative interpreta-tion of FTIR signals is based on the Lambert–Beer’s law. Figure 1 shows the pulse calibration using the ex-ample of CO2where different amounts of the gas were
injected into the TA-FTIR-MS system. CO2traces were
monitored using two characteristic wavenumber re-gions, namely 2450–2150 cm–1 (asymmetric stretch, peak – 2350 cm–1), which is widely applied for identifi-cation and quantifiidentifi-cation purposes, and 3780–3480 cm–1 (overtone band, peak – 3600 cm–1), which shows much lower FTIR intensity and interferes with water bands in the same region. The integral intensities I Eq. (1) result-ing from calibration pulses are shown in Fig. 2.
I = ⎡ A v v t ⎣ ⎢ ⎢ ⎤ ⎦ ⎥ ⎥
∫
∫
( )d d v v t t 1 2 1 2 (1)The absorbance of the evolved CO2 was much
larger for the traces recorded at 2350 than at 3600 cm–1 and this led to a significant deviation from linearity
during injections of higher amounts of CO2. Integral
intensities observed for 2 mL injections deviated by 13.9% from the linear dependence for the traces re-corded for 2350 cm–1, whereas for 3600 cm–1 only small non-linearity was observed (–3.2%).
Figure 3 shows the relationship between the mass of the decomposed sample (NaHCO3) and the
integral intensity of evolved CO2as determined using
the TA-FTIR system. The traces gained at 2350 cm–1 show a linear dependence between integral intensity of the signal and mass up to 50 mg (ca. 13 mg of evolved CO2). Quantification based on the band at
3600 cm–1, however, could be achieved even up to 400 mg sample (ca. 105 mg CO2) with a spectral
reso-lution of 4 cm–1and a carrier flow rate of 50 mL min–1 He. For sample masses over 100 mg (ca. 26 mg of evolved CO2) no linear relationship was obtained
us-ing the signal at 2350 cm–1biasing quantification.
Fig. 3 Relationship between the mass of the investigated sample (NaHCO3) and integral intensity of evolved CO2 mea-sured in TA-FTIR system:r – 3600 and j – 2350 cm–1. Carrier gas: 50 mL min–1He, resolution: 4 cm–1 Fig. 1 Pulse calibration: intensity of CO2signals recorded in
TA-FTIR system at the characteristic wavenumbers 2350 and 3600 cm–1, respectively. Carrier gas: 100 mL min–1He, resolution: 4 cm–1. Inset: IR-spec-trum of CO2. Note that ‘absorbancs’ on the y-axis in Figs 1, 4, 6, 7a, 9, 11 and 12 represent integral absorbance values on specific wavenumber regions
Fig. 2 Relationship between injected volume and integral in -tensity of evolved CO2measured in TA-FTIR system for different IR regions:r – 3600 and j – 2350 cm–1
Influence of the parameters of data-acquisition and carrier gas flow
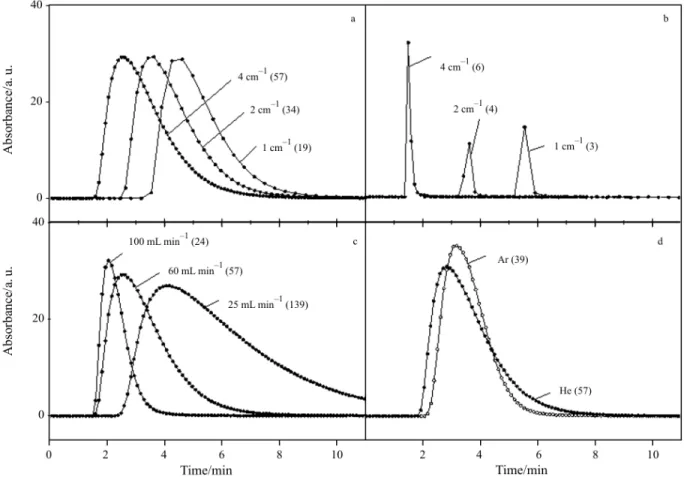
Figure 4 illustrates the influence of the parameters of data acquisition and other experimental conditions on the shape and intensity of CO2traces recorded using
the TA-FTIR system after injection of 1 mL CO2.
Fig-ure 4a shows pulses recorded with different spectral resolutions. Generally the injection was made before the thermoanalyzer, but in the case where contact of the injected gas with the investigated sample has to be avoided, the calibrating gas can be injected into the carrier gas by-passing the TA chamber. This proce-dure leads to much sharper peaks (Fig. 4b) with a huge maximal intensity which may give rise to errors and allows quantification using only the weaker sig-nal at 3600 cm–1. Due to the small distance between injection and detecting sensor the number of recorded data points at the same carrier gas flow (marked in brackets) was much lower than in the case where the injected gas passed through the relatively large vol-ume of the TA chamber resulting in dilution of the in-jected gas. The influence of the carrier gas flow on the
shape and intensity of FTIR signal is presented in Fig. 4c. The number of recorded data points increases with decreasing flow rate leading additionally to low-ering of the maximal concentrations in the FTIR cell. The tailing of the signal can be caused not only by lowering the carrier gas flow but also by the applica-tion of different carrier gas. The results presented in Fig. 4d show that CO2 pulses in helium result in
broader peaks (larger tailing) than in argon due to higher diffusivity of the investigated gas in helium. Application of helium enables the collection of signif-icantly more data-points which results in better de-scription of the real traces of the evolved gas. On the other hand, larger peak tailing may cause worse de-scription of the real course of the evolved species, overlapping of peaks and errors in quantitative deter-minations, which will be illustrated later (cf. different carrier flow rate, Fig. 11). Similar dependence was observed by Roduit et al. by quantitative calibration of mass spectrometric signals [7]. They found that due to the much higher diffusivity of CO2in helium
compared to argon, the mixed-flow zone in the TA chamber significantly increases leading to peak
Fig. 4 Influence of the experimental conditions on the shape and intensity of CO2traces recorded in TA-FTIR system after injection of 1 mL CO2. Numbers of recorded data points (>1% of maximal intensity) are given in brackets. a – carrier gas: 50 mL min–1He, injection before TA, (CO2traces at 2350 cm–1); b – carrier gas: 50 mL min–1He, injection after TA, (CO2traces at 3600 cm–1); c – carrier gas: 100, 50 and 25 mL min–1He, injection before TA, resolution 4 cm–1, (CO2traces at 2350 cm–1);
broadening. However, the maximal concentration due to injections of certain amount of CO2into the carrier
gas is smaller in helium than in argon.
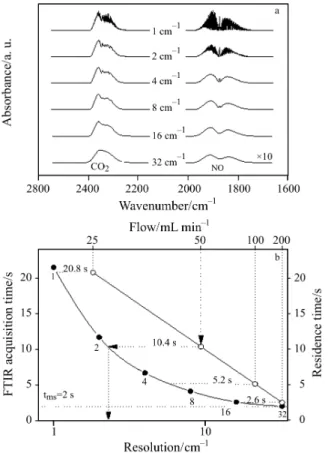
Figure 5 illustrates the relationship between IR-resolution, the acquisition time and the residence time of injected molecules. Figure 5a shows the CO2
and NO spectra recorded with different spectral reso-lutions between 1 and 32 cm–1. The application of high spectral resolution (2 cm–1) allows quantification of specific mixtures where the vibrational signals of both gases overlap as e.g. acetylene and hydrogen cy-anide. For NO, at higher resolution, even differentia-tion between isotopes is possible. However, the appli-cation of high resolution has a significant drawback in dynamic TA experiments. In order to increase the curacy of quantification at a given flow rate, the ac-quisition time has to be decreased, which can only be achieved by lowering the spectral resolution, as shown in Fig. 5b. High resolution, as e.g. 1 cm–1, re-sults in a temporal acquisition of 21.5 s, and low reso-lution as 32 cm–1 in 2.1 s, the latter is comparable to the acquisition time of mass spectrometric signals used for quantification in this study.
The acquisition time has to be strictly correlated with the mean residence time of the evolved gas in the FTIR gas cell. For too long acquisition time it is impos-sible to quantify properly the analyzed species. The mean residence time in the gas cell estimated by the quotient between the volume of the IR cell compart-ment and the carrier gas flow through the system, is shown as an upper line in Fig. 5b (carrier gas flow: re-ciprocal scale). The comparison of both dependences presented in this figure allows choosing a maximal res-olution required for a good description of the traces, enabling accurate quantification. For example, when using a carrier flow rate of 50 mL min–1 (residence time 10.4 s), the resolution should not be higher than 4 cm–1. For higher resolutions, i.e. 2 or 1 cm–1, data ac-quisition needs a time larger than 10.4 s (11.7 and 21.5 s, respectively), therefore when using a flow of 50 mL min–1part of the target gas species will not be accounted for, leading to erroneous quantification.
When investigating the influence of the experi-mental conditions on the integral intensity of FTIR sig-nals one has to apply an independent reference allowing exact comparison of signals obtained in different experi-ments. In our studies, parallel to the IR technique, we applied mass spectrometry. In all experiments we com-pared the data obtained by both techniques. As reported in our previous studies [8, 10] the integral intensities of MS signals are almost independent of experimental con-ditions, as also corroborated in the present study. This observation allowed us to use the MS signal as a refer-ence for interpretation of the intensity of IR signals ob-tained under different conditions and specify optimal FTIR measurement conditions.
In order to compare the FTIR results obtained by using different experimental set-ups with the MS re-sults, we introduced the ratio F as illustrated in Fig. 6. F is the normalized ratio between integral intensities
Fig. 6 Integral intensity I of 1 mL CO2injected in He measured by FTIR (thick line) and MS, respectively. F is the nor-malized ratio between integral intensity of FTIR and MS signals. For FTIR signal measured with a resolution of 32 cm–1and the corresponding MS signal, F is set to 1 Fig. 5 Influence of selected spectral resolution of FTIR
a – CO2and NO spectra recorded with different spec-tral resolutions. Intensities of NO spectra are scaled up (×10). Concentration of both gases: ca. 1% in He; b – relationship between acquisition time, spectral reso-lution and residence time (FTIR chamber) in TA-FTIR system. Number of averaged scans: 4
of FTIR and MS signals and provides a reasonable criterion for the correctness of the quantitative FTIR analysis. Figure 6 shows the integral intensities of 1 mL CO2injected in He recorded by FTIR and MS.
For the FTIR signal recorded using a low resolution of 32 cm–1where the largest amount of data points are collected and a corresponding MS signal the factor F is deliberately set to 1. Note that acquisition times in this case were almost the same for both techniques (2.1 s for FTIR and 2 s for MS).
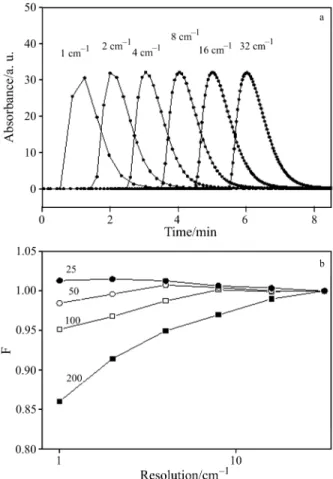
Figure 7a shows the influence of the resolution on the shape of the FTIR signal recorded during injections of 1 mL CO2to a carrier gas flow of 100 mL min
–1
. High resolution (i.e. 1 cm–1) results in smaller integral inten-sity due to the low number of collected data points, which leads to a decrease of the value of F. In Fig. 7b the observed relationship between ratio F and resolution for different carrier gas flows is shown. Especially for high carrier gas flows high spectral resolutions are not recommended because the resulting data acquisition time (cf. Fig. 5b) differs significantly from the corre-sponding residence time in the IR compartment, which
leads to a significant loss of data points. Figure 8 shows the dependence of F on the flow rate and resolution. F decreases not only with increasing the spectral resolu-tion (which decreases the temporal resoluresolu-tion of data ac-quisition), but also with increasing the flow rate. Proper collection of FTIR data is only achieved when the ac-quisition time is in the range of the residence time of the gas in IR cell (F is above 0.98). As an example, when using a resolution of 4 cm–1the gas flow should not be higher than 130 mL min–1.
In order to quantify evolved gases in the TA-FTIR system with high spectral resolutions (1 or 2 cm–1) only low flow rates (<50 mL min–1) can be used. The data presented in Table 1 (last column) in-dicate that in some cases this important parameter has not been taken into account when setting the experi-mental parameters in TA-FTIR investigations.
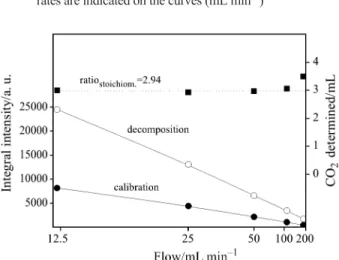
A further illustration showing that improper se-lection of the experimental settings can lead to erro-neous quantification of FTIR spectra is presented in Fig. 9, which shows the influence of the carrier gas flow on the shape of FTIR signals recorded during calibration (injection of 1 mL CO2) and
decomposi-tion of 20 mg NaHCO3. The maximal intensities of
the decomposition traces are normalized. With in-creasing flow rate the calibration peaks become sharper and the value of their maximal concentration increases significantly compared to the decomposi-tion traces. On the other hand, lower flow rates (25 or 50 cm–1) show a larger tailing, as clearly emerges from calibrating and decomposition traces. The quan-tification of the FTIR traces presented in Fig. 9 is shown in Fig. 10. This figure depicts the dependence Fig. 8 3-D illustration of dependence of F on the flow rate and resolution. The areas in which the F value in the plane ‘flow rate vs. resolution’ lays in the range <0.90, 0.90–0.95, 0.95–0.98 and above 0.98, respectively, are marked
Fig. 7 a – Influence of the spectral resolution (and data acqui-sition time) on the shape of FTIR signal recorded dur-ing injections of 1 mL CO2at a flow rate of
100 mL min–1; b – relationship between ratio F (FTIR/MS signal) and resolution for different carrier gas flows (indicated in mL min–1on the curves)
of the integral intensities of the calibration and de-composition signals on the carrier gas flow. The amount of CO2 evolved from the sample determined
by comparison of integral intensities of calibration and decomposition peaks is shown in the upper part of the plot. The deviation from the stoichiometric amount can easily be seen when increasing the flow rate, which of course influences much more the nar-row peaks obtained during calibration than the rela-tively broad signals resulting from the decomposition. However, application of low carrier gas flows has, in certain cases, also a disadvantage, e.g. when multistage reactions have to be investigated. Lower flow rate increases the tailing of the signal. This phe-nomenon is clearly visible in Fig. 9. The lower the
flow rate, the more the real course of the reaction rep-resented by the differential thermogravimetric curve (DTG, dotted line) differs from those represented by spectrometric signals. This aspect is clearly visible also in Fig. 11 depicting the multistage dehydration of copper sulfate pentahydrate. The results illustrate the difficulty in separation of the two consecutive dehy-dration stages occurring in the range 60–120°C. The water traces recorded using carrier gas flows of 25 and 50 mL min–1cannot be quantified properly due to partial overlap. In contrast, using a carrier gas flow of 100 mL min–1the contribution of these peaks can be determined. Note that better splitting of these two peaks can also be achieved by e.g. decreasing the heating rate, however that lowers the concentration of the detected gas in the system and consequently the accuracy of quantification.
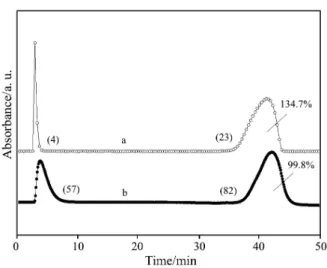
An example indicating how the procedure of the quantification of FTIR spectra by pulse calibration with gases can be influenced by different experimen-tal parameter settings is given in Fig. 12, which pres-ents the CO2traces recorded during calibration pulses
and decomposition of NaHCO3according to the
fol-lowing reaction (Eq. (2)):
2NaHCO3®Na2CO3+H2O+CO2 (2)
Table 2 compares the results of the quantification of the FTIR and MS recorded traces shown in Fig. 12 using pulse calibration with significantly different ex-perimental parameteres. The comparison is based on the calculated amounts of CO2evolved during
decomposi-tion of sodium bicarbonate related to the stoichiometric value. Experiment A (j) shows the error that had been introduced when unsuitable parameters were used, i.e. higher flow rate than 100 mL min–1for a high spectral resolution of 1–4 cm–1(cf. Fig. 8): the sharp pulse ob-Fig. 10 Dependence of the integral intensities of the calibration
and decomposition signals on the carrier gas flow. The amount of evolved CO2determined from the comparison ofr – calibration and j – decomposition signals is pre-sented in the upper part of the figure. The stoichiometric value for the sample mass 20 mg NaHCO3and injection of 1 mL CO2amounts to 2.94
Fig. 11 Water traces during dehydration of 50 mg
CuSO4·5H2O measured at different carrier gas flows. Heating rate: 10 K min–1, carrier gas: He, flow rates are indicated on the curves (mL min–1). Corresponding TG traces are shown in the lower part
Fig. 9 Influence of the carrier gas flow on the shape of FTIR sig -nals measured during calibration (injection of 1 mL CO2) and decomposition of 20 mg NaHCO3. The intensities of the decomposition traces are normalized. Carrier gas flow rates are indicated on the curves (mL min–1)
served using high spectral resolution (1 cm–1) and high carrier gas flow rate (200 mL min–1Ar) led to a large er-ror in the FTIR quantification. Due to the low temporal resolution (collection of only 4 points during injection) and the high maximal intensity significantly lower val-ues of the integral intensities of the calibration pulse were found resulting in overestimation of the amount of CO2originating from the decomposition reaction.
Experiment B (r) was performed under opti-mized conditions as regards quantification: a flow rate of 50 mL min–1was chosen and spectral resolu-tion was set to 4 cm–1, which provided 57 data points during the calibration pulse and led to a more accurate determination of the evolved CO2trace. MS and FTIR
results obtained using proper experimental conditions (B) corroborated that high accuracy of the quantifica-tion of spectral signals can be achieved with both TA-MS and TA-FTIR.
We have shown the importance of choosing ade-quate experimental conditions, in order to quantify
evolved gases by the pulse technique. Several param-eters such as carrier flow rate, injection location, amount of injected gas and data acquisition time re-sulting from the spectral resolution have to be taken into account when setting the experimental conditions optimal for calibration of FTIR signals. We hope that the present study helps the practioner to improve the quantification of evolved components in combined TA-FTIR investigations.
Conclusions
Quantification of evolved gases during thermal analy-sis by the pulse technique using MS or FTIR spectros-copy requires careful optimization of the experimen-tal settings. Quantification based on FTIR is strongly affected by the chosen experimental parameters, whereas MS analysis is only little affected. The most important factors to be considered in gas quantifica-tion by means of TA-FTIR are: the choice of the spec-tral resolution and carrier gas flow rate. High specspec-tral resolution leads to poor time resolution. Low carrier gas flow rate leads to poor separation of the reaction steps during multistage decompositions, as shown for the dehydration of CuSO4·5H2O. The application of a
TA-FTIR-MS system with properly chosen experi-mental conditions allows an easy and less time-con-suming in situ calibration procedure which can be used in different studies, such as the quantification of adsorption phenomena [23], gas-solid reactions [24] and decomposition of solids [12].
Acknowledgements
We acknowledge the continuous interest, numerous discus-sion and very valuable suggestions given by Dr. A. Rager (Bruker) and Dr. Jan Hanss (University Augsburg), and the help in solving experimental solutions offered by Netzsch GmbH (Germany). Special thanks are also due to J. Gast (Bruker) and Dr. W.-D. Emmerich (Netzsch) for their support in setting up the TA-FTIR system.
References
1 S. Materazzi, R. Curini, G. D’Ascenzo and A. D. Magri, Thermochim. Acta, 264 (1995) 75.
2 S. Materazzi, Appl. Spectrosc. Rev., 33 (1998) 189. 3 S. Materazzi, Appl. Spectrosc. Rev., 32 (1997) 385. 4 M. Mittleman, Thermochim. Acta, 166 (1990) 301. 5 L. C. K. Liau, T. C. K. Yang and D. S. Viswanath,
Appl. Spectrosc., 51 (1997) 905.
6 M. F. Cai and R. B. Smart, Energy Fuels, 7 (1993) 52. 7 B. Roduit, J. Baldyga, M. Maciejewski and A. Baiker,
Thermochim. Acta, 295 (1997) 59. Fig. 12 Example of quantification of FTIR traces by pulse
technique during decomposition of 20 mg NaHCO3. Numbers of recorded data points (>1% of maximal in-tensity) are given in brackets. a –j carrier gas: 200 mL min–1Ar, resolution 1 cm–1, (pulse: 4 points). Calculated amount of CO2in the sample amounted to 134.7% of the stoichiometric value. b –r carrier gas: 50 mL min–1He, resolution 4 cm–1, (pulse: 57 points). 99.8% of CO2was determined
Table 2 Results of the pulse calibration technique with dif -ferent experimental set-ups A and B reported in Fig. 12. CO2amounts (%) quantified by MS and FTIR related to stoichiometric value are given
Set-up MS/% FTIR/% F1/–
A (j) 102.9 134.7 0.76
B (r) 99.2 99.8 0.99
1
F – normalized ratio between integral intensity of
FTIR and MS calibration signal (decomposition peaks were normalized)
8 M. Maciejewski, C. A. Muller, R. Tschan, W. D. Emmerich and A. Baiker, Thermochim. Acta, 295 (1997) 167. 9 J. Wang and B. McEnaney, Thermochim. Acta,
190 (1991) 143.
10 M. Maciejewski and A. Baiker, Thermochim. Acta, 295 (1997) 95.
11 F. Eigenmann, M. Maciejewski and A. Baiker,
in Proc. 3rdSKT 2000, Netzsch, Selb, Germany 2000, p. 183. 12 F. Eigenmann, M. Maciejewski and A. Baiker,
Thermochim. Acta, 440 (2005) 81.
13 K. Marsanich, F. Barontini, V. Cozzani and L. Petarca, Thermochim. Acta, 390 (2002) 153.
14 T. L. Slager and F. M. Prozonic, Thermochim. Acta, 426 (2005) 93.
15 E. Post, S. Rahner, H. Mohler and A. Rager, Thermochim. Acta, 263 (1995) 1.
16 I. Pitkanen, J. Huttunen, H. Halttunen and R. Vesterinen, J. Therm. Anal. Cal., 56 (1999) 1253.
17 F. Barontini, K. Marsanich and V. Cozzani, J. Therm. Anal. Cal., 78 (2004) 599.
18 R. S. Jackson and A. Rager, Thermochim. Acta, 367–368 (2001) 415.
19 R. Bassilakis, R. M. Carangelo and M. A. Wojtowicz, Fuel, 80 (2001) 1765.
20 A. Perez-Ponce, J. M. Garrigues, S. Garrigues and M. de la Guardia, Analyst, 123 (1998) 1817.
21 A. I. Balabanovich, A. Hornung, D. Merz and H. Seifert, Polym. Degrad. Stab., 85 (2004) 713.
22 W. M. Groenewoud and W. de Jong, Thermochim. Acta, 286 (1996) 341.
23 F. Eigenmann, M. Maciejewski and A. Baiker, Thermochim. Acta, 359 (2000) 131.
24 F. Eigenmann, M. Maciejewski and A. Baiker, Appl. Catal. B, 62 (2005) 311.
Received: October 11, 2005 Accepted: November 15, 2005
DOI: 10.1007/s10973-005-7387-z Online first: December 12, 2005
