Publisher’s version / Version de l'éditeur:
Vous avez des questions? Nous pouvons vous aider. Pour communiquer directement avec un auteur, consultez la première page de la revue dans laquelle son article a été publié afin de trouver ses coordonnées. Si vous n’arrivez pas à les repérer, communiquez avec nous à PublicationsArchive-ArchivesPublications@nrc-cnrc.gc.ca.
Questions? Contact the NRC Publications Archive team at
PublicationsArchive-ArchivesPublications@nrc-cnrc.gc.ca. If you wish to email the authors directly, please see the first page of the publication for their contact information.
https://publications-cnrc.canada.ca/fra/droits
L’accès à ce site Web et l’utilisation de son contenu sont assujettis aux conditions présentées dans le site LISEZ CES CONDITIONS ATTENTIVEMENT AVANT D’UTILISER CE SITE WEB.
Physical Review. B, Condensed Matter and Materials Physics, 78, 15-15, pp.
155201-1-155201-6, 2008-10
READ THESE TERMS AND CONDITIONS CAREFULLY BEFORE USING THIS WEBSITE. https://nrc-publications.canada.ca/eng/copyright
NRC Publications Archive Record / Notice des Archives des publications du CNRC :
https://nrc-publications.canada.ca/eng/view/object/?id=332e3708-0417-4572-92d4-7dd704666724
https://publications-cnrc.canada.ca/fra/voir/objet/?id=332e3708-0417-4572-92d4-7dd704666724
NRC Publications Archive
Archives des publications du CNRC
This publication could be one of several versions: author’s original, accepted manuscript or the publisher’s version. / La version de cette publication peut être l’une des suivantes : la version prépublication de l’auteur, la version acceptée du manuscrit ou la version de l’éditeur.
For the publisher’s version, please access the DOI link below./ Pour consulter la version de l’éditeur, utilisez le lien DOI ci-dessous.
https://doi.org/10.1103/PhysRevB.78.155201
Access and use of this website and the material on it are subject to the Terms and Conditions set forth at
Measuring phonon dephasing with ultrafast pulses using Raman
spectral interference
Waldermann, F. C.; Sussman, Benjamin J.; Nunn, J.; Lorenz, V. O.; Lee, K.
C.; Surmacz, K.; Lee, K. H.; Jaksch, D.; Walmsley, I. A.; Spizziri, P.; Olivero,
P.; Prawer, S.
Measuring phonon dephasing with ultrafast pulses using Raman spectral interference
F. C. Waldermann, Benjamin J. Sussman,
*
J. Nunn, V. O. Lorenz, K. C. Lee, K. Surmacz, K. H. Lee, D. Jaksch, and I. A. WalmsleyClarendon Laboratory, University of Oxford, Parks Road, Oxford OX1 3PU, United Kingdom
P. Spizziri, P. Olivero, and S. Prawer
Center for Quantum Computer Technology, School of Physics, The University of Melbourne, Parkville, Victoria 3010, Australia 共Received 12 April 2008; revised manuscript received 1 September 2008; published 9 October 2008兲
A technique to measure the decoherence time of optical phonons in a solid is presented. Phonons are excited with a pair of time-delayed 80 fs near infrared pulses via spontaneous transient Raman scattering. The spectral fringe visibility of the resulting Raman pulse pair, as a function of time delay, is used to measure the phonon dephasing time. The method avoids the need to use either narrow band or few femtosecond pulses and is useful for low phonon excitations. The dephasing time of phonons created in bulk diamond is measured to be = 6.8 ps共⌬ = 1.56 cm−1兲.
DOI:10.1103/PhysRevB.78.155201 PACS number共s兲: 78.30.Am, 81.70.Fy, 65.40.⫺b, 63.20.Ry
I. INTRODUCTION
Phonons are a fundamental excitation of solids that are responsible for numerous electric, thermal, and acoustic properties of matter. The lifetime of optical phonons plays an important role in determining these physical properties and has been the subject of extensive study. A technique to mea-sure phonon dephasing times is presented here that utilizes spectral interference of ultrafast infrared laser pulses. Tran-sient coherent ultrafast phonon spectroscopy共TCUPS兲 offers a number of conveniences for measuring phonon dephasing. TCUPS utilizes commercially available ultrafast pulses 共80 fs兲 and hence does not require a narrow band or extremely short lasers to achieve high spectral or temporal resolution. As well, TCUPS is suitable for measurements in the single phonon excitation regime. The large sampling area and long sampling distance increase the generated Stokes power and avoid sample heating, which is a concern for low-temperature studies. Diamonds are well known for their ex-traordinary physical properties1 and also offer interesting
prospects for use in quantum information applications.2–5As
such, diamond has been selected here as the material for demonstration of TCUPS.
Two methods have previously been utilized to measure phonon lifetimes: high-resolution Raman spectroscopy and differential reflectivity measurements. The first is the tradi-tional technique, where the optical phonon lifetime is ob-tained from high-resolution linewidth measurements of the first-order Raman peak, usually conducted using narrow-band excitation lasers and high-resolution spectrometers.6 The alternative technique, working in the time domain, can directly show the temporal evolution of the surface vibra-tions of solids.7A femtosecond pump pulse is used to excite a phonon population. The reflectivity 共or transmittivity兲 of a subsequent probe pulse displays a time dependence that follows the vibrational frequency and population of excited phonons. This method was used to study the phonon decay in various solids,8 their symmetry modes,9 and their inter-action with charge carriers10 and with other phonons.11 In
these experiments, impulsive stimulated Raman scattering has been established as the coherent phonon generation mechanism.12,13
The time-domain experiments utilize the impulsive re-gime, i.e., laser-pulse lengths much shorter than the phonon oscillation period 共inverse phonon frequency兲. This require-ment can be challenging for the application of the differential reflectivity technique to materials with high phonon energies as laser systems with very short pulse lengths are required 共e.g., for diamond, sub-10 fs pulses are required to resolve a phonon frequency of 40 THz兲. On the other hand, TCUPS operates in the transient spontaneous Raman-scattering regime,14 i.e., pulse lengths much longer than the phonon oscillation period 共about 25 fs for diamond兲, but still much shorter than the phonon decoherence time.15 Stimulated
Ra-man scattering, which implies large phonon excitations, is often employed in dephasing measurements in order to achieve good signal-to-noise ratios. High phonon population numbers, often referred to as hot phonons, can be subjected to an increased decay rate, as previously observed16for GaN.
By contrast, TCUPS investigates the properties of a phonon excitation by direct analysis of the Stokes spectra generated in the Raman process. The use of single-photon detectors extends the sensitivity of the experiment to low phonon populations including the single phonon level.
II. EXPERIMENT
The diamond was classified as a type-Ib high-pressure high-temperature 共HPHT兲 sample with a nitrogen impurity concentration of less than 100 ppm. The Stokes shift of diamond17is 1332 cm−1and the Raman gain coefficient for
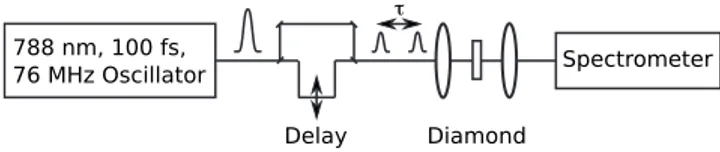
FIG. 1. Experimental setup. An oscillator pulse is split into two time-delayed pulses and focused through the diamond sample. Not shown, a bandpass filter cleans the oscillator pulse before the dia-mond and a long-pass filter rejects the pump and transmits the Stokes before the spectrometer.
diamond has been reported18 as gR= 7.4⫻ 10−3 cm/ MW
共corrected for = 800 nm兲. With pump pulse energies rang-ing over 1.1. . . 380 pJ, the collinear Stokes emission is cal-culated as 0.004–1.3 photons per pulse, in agreement with the count rates achieved experimentally. The pump laser had a diameter of d⬇ 5 mm and was focused with a f = 5 cm lens resulting in fluences ranging roughly from 0.01 to 5 J / m2. The Raman scatter is thus in the spontaneous re-gime, as verified by a linear pump power dependence rang-ing over 3 orders of magnitude 共see inset of Fig.5兲. There-fore, the experiment is performed at powers far below the hot phonon regime.
The experimental setup is depicted in Fig.1. Phonons are excited, via a Raman transition, with a pair of time-delayed 80 fs, 788 nm pulses共Fig.2兲 from a commercial Ti:sapphire oscillator 共Coherent Mira兲. The pulses are focused into a 2 ⫻ 2 ⫻ 1 mm diamond with faces polished along关100兴 plane 共Sumitomo兲. Stokes emission is detected collinearly. The pump laser is spectrally filtered using a bandpass filter to avoid extraneous light at the Stokes frequency, which might seed stimulated emission and which decreases the signal-to-noise ratio when detecting single Stokes photons. The Stokes scatter is detected and spectrally analyzed by means of a 30 cm spectrometer 共Andor Shamrock 303i兲 and an electron multiplying charge coupled device 共EM-CCD兲 共iXon DV887DCS-BV兲, which is capable of statistical single-photon counting. The gratings were ruled at 150 lines/mm for data in Figs. 3 and 1800 lines/mm for Figs.4
and5.
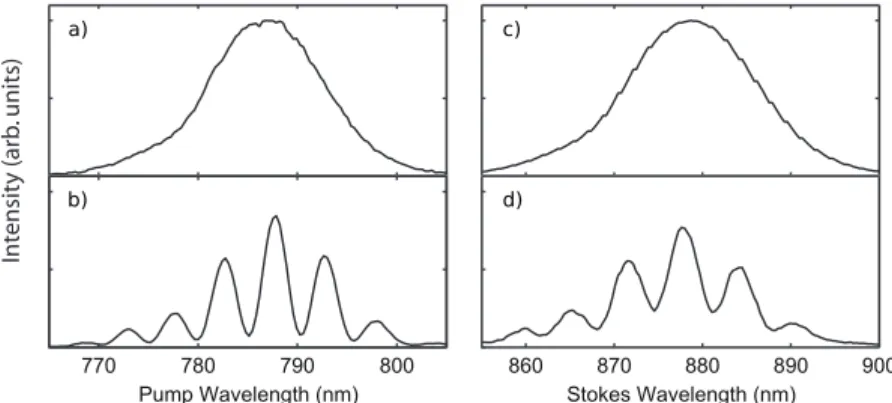
The spectral interference from the pump pair and Stokes pair is shown in Fig.3. The fringe spacing ⌬ is as expected
for two time-delayed coherent pulses ⌬ = 2/c 关see also
Eq.共4兲 below兴. For the excitation pair, is the center wave-length of the pump 关Fig.3共b兲兴 and for the generated output Raman pair, is the center wavelength of the Stokes 关Fig.
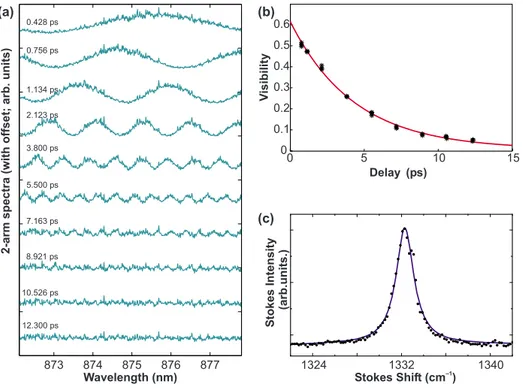
3共d兲兴. The fringe spacing of the Raman output corresponds to the Stokes peak wavelength, confirming that the process is a measure of the coherence of the Raman process. Figure4共a兲
shows the fringe visibility reduction as a function of time delay. The fringe visibility V = exp共−⌫兩兩兲 is plotted in Fig. 4共b兲. The decay time ⌫ is discussed below. The visibility has been renormalized using the laser visibility for each delay to account for beam walk-off and the spectrometer resolution which artificially reduces visibility due to a sampling effect from the finite pixel size of the spectrometer CCD.
III. THEORY
The observed spectral interference visibility can be con-sidered from two perspectives. In the first, the visibility de-cay arises due to fluctuations of the phase in the classical fields. Each input laser pulse excites optical phonons, via a Raman transition共Fig.2兲, which in turn causes the emission of two Stokes pulses. That is, the Raman interaction maps the electric field of the two input pulses to two output Stokes shifted pulses
EStokes= E1共t兲 + E2共t兲. 共1兲
The phase of the first Stokes pulse E1is determined
sponta-neously, but the phase 共and amplitude at stimulated intensi-ties兲 of the second pulse E2 is influenced by the coherence
maintained by the phonon in the system following the first pulse, so that the output field may also be rewritten as
EStokes共t兲 = E1共t兲 + eiE1共t −兲, 共2兲
whereis the time delay between the input pulses and is
the spontaneously fluctuating phase difference between the pulses. The spectral intensity of the Stokes pulse pair
兩EStokes共兲兩2= 2兩E1共兲兩2关1 + cos共+兲兴 共3兲
contains interference fringes whose position depends on the relative phase. Shot-to-shot, decoherence causes
spontane-ous fluctuations inand the fringe pattern loses visibility. At
longer delays , the fluctuations increase, eventually
reduc-ing the visibility of any integrated frreduc-inge pattern to zero. Assuming a Lorentzian line shape with width ⌫ for the dis-tribution of the phase , the shot-to-shot averaged spectral
intensity is broadened to Conduction band Zone centre optical phonon Stokes @ 880 nm Pump @ 788 nm 1332 cm-1 Ground state
FIG. 2.共Color online兲 Diamond energy-level schematic. Ground state phonons are excited with the incident 788 nm pump, via a Raman transition, to the optical phonon mode, emitting an 880 nm Stokes pulse. Int ensit y (ar b .units)
FIG. 3. Example spectral interference for a delay = 0.39 ps. Spectra of the broadband exci-tation laser 共left兲 and the Stokes signal of dia-mond共right兲. The single pulse data in 共a兲 and 共c兲 show the pump-laser spectrum and the corre-sponding broadband Raman spectrum, respec-tively. Spectral interference fringes appear for co-herent pulse pairs in共b兲 and 共d兲.
WALDERMANN et al. PHYSICAL REVIEW B 78, 155201共2008兲
具兩EStokes共兲兩2典shots= 2兩E1共兲兩2关1 + e−⌫兩兩cos共兲兴. 共4兲
The phase fluctuations cause a reduction of the fringe visibil-ity.
Alternatively, the fluctuating phase perspective can be connected with the second quantum field perspective. This formalism can also be made applicable in the stimulated re-gime, although the process here is entirely in the spontane-ous limit. The relationship between the stimulated and spon-taneous cases is elaborated in the Appendix. The observed spectral intensity expectation value is proportional to the number of Stokes photons
具兩EStokes共兲兩2典 ⬀ 具A†A典, 共5兲
where the lowering operator A共兲 is a sum of the first A1and
second A2 pulse mode lowering operators
具兩EStokes共兲兩2典 ⬀ 具A1 †A 1典 + 具A2 †A 2典 + 2R具A1 †A 2典. 共6兲
The final, correlated term 关cf. the decay term in Eq. 共4兲兴 measures the phonon coherence that remains in the system between pulses. During the evolution of the system, the start-ing time phonon mode B†共0兲 is “mixed” into the Stokes
pho-ton modes Ai due to application of the laser field. The
mixed-in term is then subsequently the source for spontane-ous emission. The source term is the same for both pulses, but during the period between pulses the coherence is re-duced due to crystal anharmonicity and impurities. That the source term is the same for both pulses indicates that the output Raman pulses will be phase coherent until over-whelmed by the fluctuations. For the correlation, the relevant terms to lowest perturbative order are共see Appendix for the equations of motion兲
A1⬇ A1共0兲 − igpumpB†共0兲, 共7兲
A2⬇ A1共0兲ei− igpumpB†共0兲e−⌫, 共8兲
from which the correlation term can be evaluated as 具A1 †A 2典 ⬇ g2pump 2 具B共0兲B†共0兲典e−⌫= g2 pump 2 具N B共0兲 + 1典e−⌫, 共9兲 where NB共0兲 is the initial number of phonons, which in this
case is the nearly zero thermal population. This result links the phonon decoherence rate ⌫ with the fluctuating phase perspective linewidth ⌫ from Eq. 共4兲. Therefore, measuring the reduction of the fringe visibility is a direct measure of the phonon dephasing time.
From the quantum field perspective, TCUPS is a type of two-slit experiment. For pulse durations much shorter than the decay time, the Hamiltonian during a pulse interaction is approximately of the form
H⬇ gA†B†
+ gⴱAB. 共10兲
Therefore, the generated state from the first pulse共or slit兲 is equivalent to a two-mode squeezed vacuum state or a para-metric down-conversion state.19 As a result, the phonon
mode and the photon mode are entangled. The fact that the phonon mode maintains its coherence for a time 1 / ⌫ permits the state prepared by the second pulse 共or slit兲 to interfere with the first, creating a superposition. In the low intensity limit, only one Raman photon is created by a pump pulse pair. The inability to determine from which pump pulse the Raman photon was produced implies that there are two in-distinguishable quantum paths共A1and A2兲 which interfere at
the detector to produce the observed fringes. However, as the time delay is increased, information about whether or not the Raman photon was created by the first pulse leaks into the surroundings via the phonon decoherence processes. This in-formation can, in principle, be used to measure which-pulse
873 874 875 876 877 0.428 ps 0.756 ps 1.134 ps 3.800 ps 5.500 ps 7.163 ps 8.921 ps 10.526 ps 12.300 ps Wavelength (nm) 2-arm spectra (with offset; arb. units) 0 0.1 0.2 0.3 0.4 0.5 0.6 Delay (ps) V isibility (a) (b) (c) 1324 1332 1340 S tokes Intensity (arb.units.) Stokes Shift (cm )–1 0 5 10 15 2.123 ps
FIG. 4. 共Color online兲 Deco-herence measurement. 共a兲 Stokes spectra for two pump pulses with various delays , recorded with an 1800 lines/mm grating. The de-crease in spectral interference vis-ibility of the Stokes signal is due to decoherence of the optical phonons created. The respective visibilities are plotted in 共b兲, ob-tained by curve-fitting the spectra. Asterisks denote data points, the continuous line an exponential de-cay fit. Part 共c兲 shows a high-resolution Raman spectrum for the same diamond 共dots兲 with a Lorentzian fit共line兲.
共which-path兲 information and therefore destroys the interfer-ence fringes.
IV. DISCUSSION
The TCUPS measurement indicates a phonon dephasing time of 1 / ⌫ = 6.8⫾ 0.9 ps or a linewidth of ⌬= 1.56 cm−1.
The literature has reported a great deal of variation in line-width measurements for diamond,6,18,20varying from at least 1.1 cm−1 to as high as 4.75 cm−1. Here, the TCUPS 关Fig.
4共b兲, ⌬= 1.56 cm−1兴 and conventional Raman spectrum
关Fig.4共c兲, ⌬= 1.95 cm−1兴 show comparatively good
agree-ment. The lifetime measured here is slightly shorter than the decay rate calculated theoretically by Debernardi et al.21for an ideal crystal共⌬= 1.01 cm−1or 1 / ⌫ = 10.5 ps兲 as the
de-cay process is enhanced by lattice imperfections, vacancies, and the high concentration of substitutional nitrogen atoms, as is typical for this sort of diamond. The decay model con-sidering acoustic phonon modes suggests that this deviation from the theoretical optimum is due to inhomogeneous broadening rather than additional pure dephasing. Future work will reveal whether ultrapure diamond with very low crystal defect density can achieve a longer phonon lifetime. The creation of coherent phonons in diamond is heralded by the emitted Stokes photon, which could be employed for quantum optical experiments operating at room temperature, e.g., schemes that transfer optical entanglement to matter.22,23
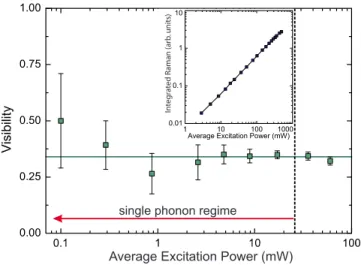
The spectral interference pattern persists for low excita-tion levels, i.e., a phonon excitaexcita-tion probability per mode of p ⬍1. 共The case of p Ⰷ 1 would correspond to a strongly stimulated regime, which has previously been studied in mo-lecular hydrogen gas24 although using spatial, not spectral,
interference.兲 A constant visibility with excitation power can be seen at low excitation level共Fig.5兲. TCUPS can therefore be employed to measure the decoherence properties of single optical phonons, overcoming the need for large phonon populations for lifetime measurements of phonon decoher-ence.
The excitation probability per mode was much smaller than 1, ranging over p⬇ 10−7– 10−5 due to the large number
of phonon modes in the Brillouin zone for which Stokes scatter is detected 共⬃105兲. This level is in fact smaller than
the thermal population level of the optical phonons at room temperature, given by pthermal=关exp共Evib/kBT兲 − 1兴−1
⬇ 0.0017. However, a small thermal population of the optical phonon modes does not influence this measurement method, as only the phonons deliberately excited by the pump pulses lead to Stokes scatter, and only Stokes light and its interfer-ence are detected. As phonons are governed by bosonic sta-tistics, any finite background excitation level does not inhibit a further excitation. The linewidth increase due to phonon-phonon interaction is negligible at ambient temperatures in diamond due to the low population level.21An increase in the
Raman linewidth of diamond due to temperature has been reported6to begin at around T⬇ 300 K. At T ⬇ 800 K, it is
more than twice the zero temperature linewidth. At room temperature, the phonon decay is only marginally enhanced by an acoustical phonon population. This insensitivity to a thermal background is in contrast to the differential reflec-tivity method, where thermal phonons lead to additional noise as both thermal and coherent phonons lead to a change in the material reflectivity.
With equipment found in a typical ultrafast laboratory, TCUPS is a convenient approach to determining the quan-tum coherence properties of optical phonons in Raman active solids. The measurement technique relies solely on sponta-neous Raman scattering and is therefore useful down to the single phonon level. In particular, TCUPS enables the mea-surement of the decoherence time of phonons, which is of paramount importance in many quantum information pro-cessing schemes. Spectral interference of the Stokes light from pump pulse pairs is used to measure the Raman line-width of the material, while maintaining a coherent excita-tion due to ultrafast excitaexcita-tion. The phonon lifetime of dia-mond was measured as 6.8 ps. This lifetime corresponds to a phonon Q factor of Q =/ ⌫⬃ 270. Although the short life-time of the excitation makes it unsuitable for long-distance quantum repeaters, such a high Q and the low thermal popu-lation at room temperature make it feasible for proof-of-principle demonstrations of typical quantum optics schemes, such as collective-excitation entanglement in the solid state.
ACKNOWLEDGMENTS
This work was supported by the QIPIRC and EPSRC 共Grant No. GR/S82176/01兲, EU RTN project EMALI, and Toshiba Research Europe.
APPENDIX: PHONON-PHOTON EQUATIONS OF MOTION
Consider an incident pump laser that Raman scatters off a phonon field of the diamond to produce an output Stokes Average Excitation Power (mW)
single phonon regime
Int egr at ed R a man (arb .units)
FIG. 5. 共Color online兲 Power dependence. The power depen-dence of the Stokes interference visibility 共at constant delay = 0.51 ps, reduced due to a limited alignment兲 showing that the experiment can be carried out at arbitrarily low phonon excitation levels 共the green horizontal line is plotted to guide the eyes兲. The inset shows the dependence of the Stokes pulse energy on the av-erage pump power共single pump pulses兲. The linear power depen-dence shows that the scattering is in the spontaneous Raman re-gime. The fraction of pump power converted into collinear Stokes light was measured to be less than 10−8.
WALDERMANN et al. PHYSICAL REVIEW B 78, 155201共2008兲
field. The equations of motion for Stokes field A共t兲 and the phonon field B共t兲 are linked by the pump coupling g via:25
A˙ 共t兲 = − igB†共t兲 共A1兲 and
B˙ 共t兲 = − igA†共t兲 − ⌫B共t兲 + F†共t兲. 共A2兲
The dephasing rate ⌫ is due to crystal anharmonicity and impurities. The Langevin operator F has been added to main-tain the normalization of B in the presence of decay, allowing the phonon to decohere, but keeping the operator norm共via the commutation relation 关B , B†兴 = 1兲 constant. The formal
solutions are B= B共0兲e−⌫t +
冕
0 t e−⌫共t−t⬘兲关− igA†共t⬘
兲 + F†共t⬘
兲兴dt⬘
共A3兲 and A= A共0兲 − i冕
0 t gB†共t⬘
兲dt⬘
. 共A4兲 For brevity, the time argument has been dropped from the solutions. In the weak 共gpumpⰆ 1兲 and transient 共⌫pump
Ⰶ 1兲 pump pulse limits, the incident laser leaves the phonon operator approximately in the vacuum state B共0兲 and the phonon operator solution at lowest order is
B⬇ B共0兲e−⌫t
+
冕
0
t
e−⌫共t−t⬘兲F†共t
⬘
兲dt⬘
. 共A5兲The Stokes field to first order is then A⬇ A共0兲 − igpumpB†共0兲e−⌫t
− i
冕
0 t冕
0t⬘ ge−⌫共t⬘−t⬙兲F共t⬙
兲dt⬙
dt⬘
, 共A6兲 where the coupling g in the second term has been taken as a constant step for the duration of the pump. The initial Stokes operator A共0兲 annihilates the vacuum, but the solution for A mixes in a component of the phonon raising operator B†共0兲,which acts as a source for the spontaneous Raman scattering. While the source is in the weak spontaneous limit, the fact that a second pulse can scatter off the same mode B indicates
that the subsequent interference is phase coherent until de-stroyed by the fluctuation.
It is worthwhile to contrast the spontaneous case, dis-cussed above, with that of the stimulated case. To do this we first rewrite the initial phonon state B共0兲 in terms of the fluctuations
B共0兲 =
冕
−⬁ 0
e−⌫t⬘F†共t
⬘
兲dt⬘
, 共A7兲noting that the initial state B共0兲 is due to the integrated fluc-tuations of the vacuum since the start of time. The initial system is devoid of phonon population such that 具B†共0兲B共0兲典 = 0, however, as will be shown below, it is
re-sponsible for the coherence of spontaneous emission. As-suming constant coupling g, the approximate Eq. 共A6兲 for the Stokes field, can be replaced with the exact equation
A= A共0兲 − ig
冕
0 t冕
−⬁t⬘ e−⌫共t⬘−t⬙兲F共t⬙
兲dt⬙
dt⬘
− g2冕
0 t冕
0t⬘A共t
⬙
兲e−⌫共t⬘−t⬙兲dt⬙
dt⬘
. 共A8兲The first term corresponds to initially present Stokes light, which is assumed to be zero here. The second term, which is first order in g, corresponds to spontaneous emission. In the presence of weak coupling this is the only source of Stokes to first order and occurs even in the absence of any phonon population. The third and final term corresponds to stimu-lated emission. While the phonon operator B is not explicit in the third term, it is implicitly present through its coupling to A共t
⬙
兲. TCUPS utilizes emission only from the second term despite the absence of any phonon population. The sponta-neous Raman emission from two time-delayed pulses is cor-related provided the initial vacuum fluctuations have not ap-preciably dephased. This is in contrast to interference between stimulated emissions. In the stimulated limit, the phonon state is populated and the emission of a pulse pair is coherent because the phase of the phonon population created by the first pulse is mapped onto that created by the second. The decoherence rate ⌫ represents the dephasing of the phonon raising operator B†. The phonon number NB= B†Btherefore decays at a rate 2⌫. The corresponding spectral frequency linewidth is ⌬= ⌫ /.
*Also at National Research Council of Canada, Ottawa, Ontario, Canada K1A 0R6; ben.sussman@nrc.ca
1Properties of natural and synthetic diamond, edited by J. E.
Field共Academic Press, London, 1992兲.
2Jörg Wrachtrup and Fedor Jelezko, J. Phys.: Condens. Matter 18, S807共2006兲.
3L. Childress, M. V. Gurudev Dutt, J. M. Taylor, A. S. Zibrov, F.
Jelezko, J. Wrachtrup, P. R. Hemmer, and M. D. Lukin, Science 314, 281共2006兲.
4P. Neumann, N. Mizuochi, F. Rempp, P. Hemmer, H. Watanabe,
S. Yamasaki, V. Jacques, T. Gaebel, F. Jelezko, and J. Wracht-rup, Science 320, 1326共2008兲.
5F. C. Waldermann, P. Olivero, J. Nunn, K. Surmacz, Z. Y. Wang,
D. Jaksch, R. A. Taylor, I. A. Walmsley, M. Draganski, P. Rei-chart, A. D. Greentree, D. N. Jamieson, and S. Prawer, Diamond Relat. Mater. 16, 1887共2007兲.
6M. S. Liu, L. A. Bursill, S. Prawer, and R. Beserman, Phys. Rev.
B 61, 3391共2000兲.
7G. C. Cho, W. Kütt, and H. Kurz, Phys. Rev. Lett. 65, 764
8T. K. Cheng, S. D. Brorson, A. S. Kazeroonian, J. S. Moodera,
G. Dresselhaus, M. S. Dresselhaus, and E. P. Ippen, Appl. Phys. Lett. 57, 1004共1990兲.
9Yong-Sik Lim, Seok-Chan Yoon, Ki-Ju Yee, Jai-Hyung Lee, D.
S. Kim, and Donghan Lee, Phys. Rev. B 68, 153308共2003兲.
10Muneaki Hase, Masahiro Kitajima, Anca Monia Constantinescu,
and Hrvoje Petek, Nature共London兲 426, 51 共2003兲.
11A. Bartels, T. Dekorsy, and H. Kurz, Phys. Rev. Lett. 84, 2981
共2000兲.
12S. De Silvestri, J. G. Fujimoto, E. P. Ippen, Edward B. Gamble,
Leah Ruby Williams, and Keith A. Nelson, Chem. Phys. Lett. 116, 146共1985兲.
13Y. Liu, A. Frenkel, G. A. Garrett, J. F. Whitaker, S. Fahy, C.
Uher, and R. Merlin, Phys. Rev. Lett. 75, 334共1995兲.
14N. Bloembergen, M. J. Colles, J. Reintjes, and C. S. Wang,
In-dian J. Pure Appl. Phys. 9, 874共1971兲.
15K. Ishioka, M. Hase, M. Kitajima, and H. Petek, Appl. Phys.
Lett. 89, 231916共2007兲.
16K. J. Yee, K. G. Lee, E. Oh, D. S. Kim, and Y. S. Lim, Phys.
Rev. Lett. 88, 105501共2002兲.
17Alexander M. Zaitsev, Optical Properties of Diamond共Springer,
New York, 2001兲.
18A. Laubereau, D. von der Linde, and W. Kaiser, Phys. Rev. Lett. 27, 802共1971兲.
19Marlan O. Scully and M. Suhail Ziubairy, Quantum Optics
共Cambridge University Press, Cambridge, England, 1997兲.
20Kuei-Hsien Chen, Yen-Liang Lai, Li-Chyong Chen, Jin-Yu Wu,
and Fu-Jen Kao, Thin Solid Films 270, 143共1995兲.
21A. Debernardi, S. Baroni, and E. Molinari, Phys. Rev. Lett. 75,
1819共1995兲.
22D. N. Matsukevich and A. Kuzmich, Science 306, 663共2004兲. 23C. W. Chou, H. de Riedmatten, D. Felinto, S. V. Polyakov, S. J.
van Enk, and H. J. Kimble, Nature共London兲 438, 828 共2005兲.
24M. Belsley, D. T. Smithey, K. Wedding, and M. G. Raymer,
Phys. Rev. A 48, 1514共1993兲.
25M. G. Raymer and I. A. Walmsley, Prog. Opt. 23, 181270
共1990兲.
WALDERMANN et al. PHYSICAL REVIEW B 78, 155201共2008兲