Publisher’s version / Version de l'éditeur:
Vous avez des questions? Nous pouvons vous aider. Pour communiquer directement avec un auteur, consultez la
première page de la revue dans laquelle son article a été publié afin de trouver ses coordonnées. Si vous n’arrivez pas à les repérer, communiquez avec nous à PublicationsArchive-ArchivesPublications@nrc-cnrc.gc.ca.
Questions? Contact the NRC Publications Archive team at
PublicationsArchive-ArchivesPublications@nrc-cnrc.gc.ca. If you wish to email the authors directly, please see the first page of the publication for their contact information.
https://publications-cnrc.canada.ca/fra/droits
L’accès à ce site Web et l’utilisation de son contenu sont assujettis aux conditions présentées dans le site LISEZ CES CONDITIONS ATTENTIVEMENT AVANT D’UTILISER CE SITE WEB.
12th Conference on Building Science and Technology [Proceedings], pp. 1-12,
2009-05-07
READ THESE TERMS AND CONDITIONS CAREFULLY BEFORE USING THIS WEBSITE.
https://nrc-publications.canada.ca/eng/copyright
NRC Publications Archive Record / Notice des Archives des publications du CNRC :
https://nrc-publications.canada.ca/eng/view/object/?id=7a377b33-2ab6-4c16-a2b9-4360cccb00f5 https://publications-cnrc.canada.ca/fra/voir/objet/?id=7a377b33-2ab6-4c16-a2b9-4360cccb00f5
Archives des publications du CNRC
This publication could be one of several versions: author’s original, accepted manuscript or the publisher’s version. / La version de cette publication peut être l’une des suivantes : la version prépublication de l’auteur, la version acceptée du manuscrit ou la version de l’éditeur.
Access and use of this website and the material on it are subject to the Terms and Conditions set forth at
Use of simulation tool to assess hygrothermal response of wood frame
building envelopes in Taiwan
Mukhopadhyaya, P.; El Khanagry, R.; Van Reenen, D.; Copeland, C.;
Kumaran, M. K.; Newman, P. J.; Zalok, E.
http://irc.nrc-cnrc.gc.ca
U se of sim ula t ion t ool t o a sse ss hygrot he rm a l re sponse of w ood
fra m e building e nve lope s in T a iw a n / L'a pplic a t ion d'out ils de
sim ula t ion pour e st im e r la ré ponse hygrot he rm ique d'e nve loppe s à
ossa t ure de bois à T a ïw a n
N R C C - 5 1 2 1 6
M u k h o p a d h y a y a , P . ; E l K h a n a g r y , R . ; V a n
R e e n e n , D . ; C o p e l a n d , C . ; K u m a r a n , K . ;
N e w m a n , P . J . ; Z a l o k , E .
M a y 2 0 0 9
A version of this document is published in / Une version de ce document se trouve dans:
12th Conference on Building Science and Technology, Montreal, QC, May 7-8,
2009, pp. 1-12
The material in this document is covered by the provisions of the Copyright Act, by Canadian laws, policies, regulations and international agreements. Such provisions serve to identify the information source and, in specific instances, to prohibit reproduction of materials without written permission. For more information visit http://laws.justice.gc.ca/en/showtdm/cs/C-42
Les renseignements dans ce document sont protégés par la Loi sur le droit d'auteur, par les lois, les politiques et les règlements du Canada et des accords internationaux. Ces dispositions permettent d'identifier la source de l'information et, dans certains cas, d'interdire la copie de documents sans permission écrite. Pour obtenir de plus amples renseignements : http://lois.justice.gc.ca/fr/showtdm/cs/C-42
USE OF SIMULATION TOOL TO ASSESS HYGROTHERMAL
RESPONSE OF WOOD FRAME BUILDING ENVELOPES IN TAIWAN /
L’APPLICATION D’OUTILS DE SIMULATION POUR ESTIMER LA
RÉPONSE HYGROTHERMIQUE D’ENVELOPPES À OSSATURE DE
BOIS À TAÏWAN
Phalguni Mukhopadhyaya1, Ramez El Khanagry2, David van Reenen1, Curt Copeland3, Kumar
Kumaran1, Paul J. Newman3, and Ehab Zalok2
1
Institute for Research in Construction, National Research Council, Canada. (http://irc.nrc-cnrc.gc.ca)
2
Carleton University, Canada. (http://www.carleton.ca)
3
Canada Wood Group and Council of Forest Industries, Canada. (http://www.cofi.org)
ABSTRACT
In Canada wood frame exterior building envelope construction is widely used. However, this type of building envelope construction is not traditionally used in Taiwan. This paper presents result from a research project that investigated the hygrothermal (i.e. moisture and thermal) performance of the wood frame exterior building envelope construction practices in Taichung (Taiwan). This has been done using a two-dimensional hygrothermal simulation tool. The first series of simulations was conducted for exterior building envelope constructions that had no air leakage. Thereafter, selected simulations were also conducted with air leakage through the exterior building envelope. The outputs from the simulations have been analyzed with the help of a moisture response indicator called RHT index. Simulation results indicate the relative performances and suitability of different types wood frame building envelope constructions in Taichung (Taiwan).
RÉSUMÉ
Au Canada la construction d’enveloppe à ossature de bois est très répandue, alors qu’à Taïwan, ce type de construction n’est pas traditionellement utilisé. Cet article présente les résultats d’un projet de recherche consistant à examiner la performance hygrothermique (relative au transfert de chaleur et d’humidité) de plusieurs types de construction d’enveloppe extérieure à ossature de bois dans un contexte applicable à Taichung à Taïwan. L’étude fut réalisée à l’aide d’un outil de simulation hygrothermique bidimensionnel. La première série de simulations s’appliquait à des types de construction d’enveloppe de bâtiments sans écoulement d’air. Par la suite d’autres scénarios de simulations incluant de l’écoulement d’air furent étudiés. Les résultats des simulations ont été interprétés par rapport à un indicateur de réponse hygrique appellé indice RHT. De cette façon on a établit le niveau de performance relative et l’applicabilité de plusieurs types d’enveloppes de bâtiment à ossature de bois aux conditions particulières qu’on retrouve à Taichung à Taïwan.
INTRODUCTION
Traditional wood frame exterior building envelope construction is widely used in Canada and its ability to manage the exterior and interior moisture and thermal (i.e. hygrothermal) loads is well known from the field performance records over the years. However, this type of building envelope construction is not traditionally used in Taiwan. At present, the Council of Forest Industries (COFI), an association of British Columbia forest industry partners, is promoting wood frame building envelope constructions and developing the market for the use of Canadian wood products in Taiwan. However, this is not possible without knowing the consequences and the ability of the wood frame
12th Conference on Building Science and Technology, May 7-8, 2009, Montreal, QC, Canada
building envelope assemblies to manage the hygrothermal loads in the climatic conditions of Taiwan. This is a long-term performance issue that becomes even harder to resolve when there is no comprehensive field performance data, as in this case.
In order to address this issue (i.e. non-existence of field performance data), a collaborative research project has been initiated by the National Research Council (NRC) of Canada and the Council of Forest Industries (COFI) to investigate the long-term performance of wood frame building envelope constructions (walls and roofs) in Taiwan using a computer-aided hygrothermal simulation tool. In recent years hygrothermal simulation tool has been widely used for the evaluation of the thermal and moisture response of the building envelopes (Mukhopadhyaya et. al.2003; Mukhopadhyaya et.
al.2008). The two-dimensional hygrothermal simulation tool, hygIRC-2D, developed at the Institute
for Research in Construction of the National Research Council Canada, has been used in this project. This project has evaluated the performance of several wall and roof assembly constructions using this simulation tool. The results of these simulations are presented in the following sections.
RESEARCH SIGNIFICANCE
The primary objective of this study is to evaluate the hygrothermal performance of various wood-frame building envelope designs in Taichung (Taiwan) using the hygrothermal simulation tool
hygIRC-2D. The numerical simulations have been done on four types of exterior walls and two types
of unvented roofs. Initially, the roof and wall constructions were simulated assuming no air leakage through the assemblies. Subsequently, simulations with air leakage were conducted on two of the wall constructions. As a result, the effects of vapour diffusion could be assessed independently of air leakage.
HYGROTHERMAL SIMULATION TOOL
Hygrothermal models are mathematical tools that can be used for moisture design of building envelopes (Hens 1996). The hygrothermal simulation tool used in this study is a computer aided
numerical model, 2D, that can predict the moisture response of building envelopes.
hygIRC-2D is continuously evolving as a research tool, developed by a group of researchers at the Institute for
Research in Construction (IRC) of the National Research Council (NRC), Canada. Interested readers can refer to the publications by Karagiozis (1997) and Djebbar et al. (2002a,b) for further details. These documents outline the formulation of the combined heat, air and moisture transport equations
used in hygIRC-2D and the techniques used to solve them numerically. The reliability of hygIRC-2D
outputs has been established through laboratory measurements and benchmarking exercises (Maref et
al. 2002; Hagentoft et al. 2004). The effective use of hygIRC-2D to analyze and obtain meaningful
results, however, demands a proper physical understanding of the problem, an appropriate definition of input parameters and the ability to judiciously interpret the outputs from the simulation tool (Mukhopadhyaya and Kumaran, 2001; Mukhopadhyaya et al. 2001; Kumaran et al. 2003; Mukhopadhyaya et al. 2008).
INPUTS AND ASSUMPTIONS FOR hygIRC-2D
A number of major input parameters are required for hygIRC-2D simulation, such as: (1) Wall
construction details; (2) Material properties; (3) Boundary conditions; (4) Exposure duration; (5) Initial moisture content and temperature; and (6) Air leakage.
The following sections outline these input parameters as applicable for this study WALL CONSTRUCTION DETAILS
Several different wall and roof designs (Figure 1) were evaluated to compare their hygrothermal performance. Canada Wood submitted these designs, with construction details, to the IRC researchers for hygrothermal performance evaluation under Taichung weather conditions. As mentioned earlier,
simulations were first conducted with no air leakage. These include the following exterior wall and roof designs: (1) Wall 1 – Classic cold weather wall with rain screen, (2) Wall 2 – Hot humid wall
with air barrier inside and outside, and rain screen, (3) Wall 3 – Super E® wall, (4) Wall 4 – Low cost
wall without rigid foam insulation, (5) Roof 1 – Unvented truss roof with XPS and glass fibre insulation, and (6) Roof 2 – Unvented truss roof with spray-on foam insulation.
MATERIAL PROPERTIES
hygIRC-2D simulation requires eight sets of material properties. These properties are air permeability, thermal conductivity, dry density, heat capacity, sorption characteristics, suction pressure, liquid diffusivity and water vapour permeability. These materials properties were obtained from the NRC-IRC's hygrothermal materials properties database (Kumaran et al (2002); Kumaran et al (2004); Mukhopadhyaya et al (2004)) and were determined in the NRC-IRC's Insulation and Building Materials Laboratory.
BOUNDARY CONDITIONS
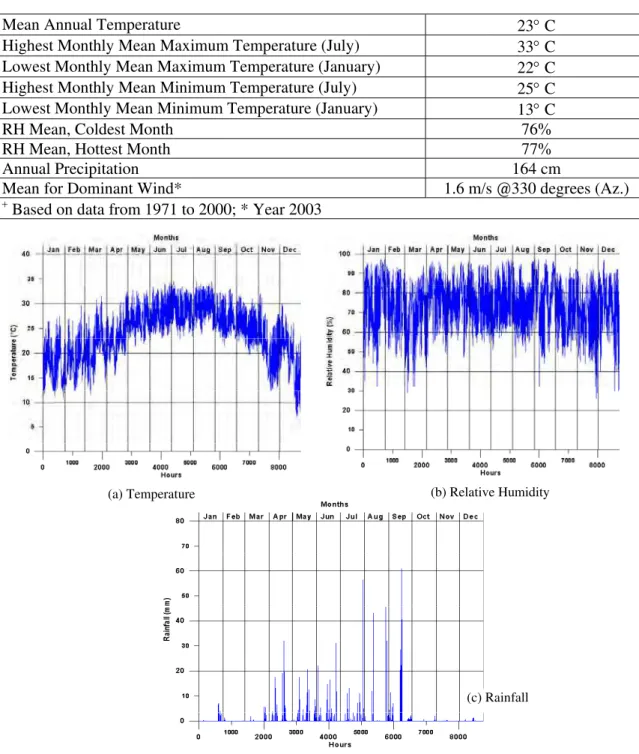
Hourly recorded Taichung weather data for the year 2001 were used as outdoor/external boundary conditions. These weather data were obtained from the weather bureau of Taiwan. Of the available
weather data, 2001 was the year with the most rainfall. hygIRC-2D requires the following hourly
recorded weather components: temperature, relative humidity, wind velocity, wind direction, rainfall, solar radiation and cloud index. Table 1 provides general climatic conditions (based on recorded data from 1971 to 2000) for Taichung, and Figures 2a, 2b and 2c show the temperature, relative humidity and rainfall data for the year 2001.
The indoor conditions (temperature and relative humidity) used in these simulations were for a controlled indoor environment based on summer and winter seasons, identified according to the criteria specified in the ’Specifications to National (Canada) Energy Code for Houses, (Swinton and Sander, 1994)’. If the monthly average outdoor temperature was below 11 °C it was considered winter. If the monthly average temperature was above 11 °C it was considered summer. Since the average monthly temperature in Taichung did not drop below 11 °C, summer conditions were always used. Indoor conditions in Taichung were developed based on conversations with building science professionals who had knowledge of building practices in Taiwan. The indoor conditions were 25 °C temperature and 65% relative humidity throughout the year.
EXPOSURE DURATION
All simulations were conducted for a period of 3 years (one year weather data repeated). The exposure duration for each year started on 01 January and ended on 31 December.
INITIAL MOISTURE CONTENT AND TEMPERATURE
In any hygrothermal simulation, the user defines the initial moisture content of each wall component at the beginning of the first year. It was assumed in this study that the initial moisture content of each wall component is equivalent to the corresponding relative humidity of 30%, derived from the sorption isotherm of the respective materials. Similarly, the initial temperature across the entire cross section of the wall was assumed to be 20°C. In this study, the first two years of the simulation are considered to be an initial conditioning period, and all the observations are made on the basis of the hygrothermal response of the wall assembly during the third year.
12th Conference on Building Science and Technology, May 7-8, 2009, Montreal, QC, Canada 12.7 mm gypsum board 0.15 mm polyethylene membrane 140 mm glass fibre insulation 12 mm plywood or OSB sheathing house wrap applied as weather barrier exterior cladding drying to exterior strapping (pressure moderated rain screen)
any paint or wallpaper
12.7 mm gypsum board applied as air barrier foil facing on sheathing as vapour diffusion retarder 140 mm glass fibre insulation 12 mm plywood or OSB sheathing
house wrap applied as air barrier exterior cladding drying to interior semi-permeable latex paint strapping (pressure
moderated rain screen)
12.7 mm gypsum board applied as air barrier 25 mm rigid insulation extruded polystyrene 90 mm glass fibre insulation 12 mm plywood or OSB sheathing house wrap applied as weather barrier
20 mm stucco cladding
FIGURE 1: WALLS AND ROOFS CONSTRUCTION DETAILS
AIRLEAKAGE
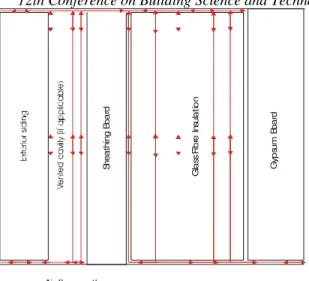
To understand the effects of imperfect air barriers in the wall constructions, air leakage was
introduced in: (1) Wall 3 – Super E® wall, and (2) Wall 4 – Low cost wall. An air leakage path was
created through each of the wall assemblies. The air would enter/exit, depending on the characteristics of indoor and outdoor pressure, along a crack at the exterior top of the wall and then travel through the insulation cavity and exit/enter at the interior bottom of the wall (Figure 3). This size of the crack was based on the normalized leakage area (NLA), which is the area of the crack in
exterior cladding drying to interior and exterior strapping (pressure moderated rain screen)
latex paint - vapour permeable
12.7 mm gypsum board applied as air barrier 12 mm plywood or
OSB sheathing
140 mm glass fibre insulation house wrap applied
as air barrier exterior cladding drying to interior and exterior strapping (pressure moderated rain screen)
latex paint - vapour permeable 12.7 mm gypsum board, vapour permeable latex paint sealant in corner 140 mm glass fibre insulation batts suspended with wire stays or netting 12 mm plywood or OSB sheathing 25 mm rigid insulation extruded polystyrene roofing membrane e.g. “ice and water shield”
Super E wall with rigid insulation notched and sealed
around truss members conditioned air in attic strapping roof tiles 12.7 mm gypsum board, vapour permeable latex paint sealant in corner 100 mm
spray-on, closed foam insulation 12 mm
plywood or OSB sheathing roofing membrane e.g. “ice and water shield”
Super E wall with rigid insulation notched and sealed
around truss members conditioned air in attic strapping roof tiles
(a) Wall 1 (b) Wall 2
(c) Wall 3 (d) Wall 4
(e) Roof 1 (f) Roof 2
20 mm stucco cladding 20 mm stucco cladding 20 mm stucco cladding
- Classic cold weather - Hot humid
- Super E® - Low cost
- Unvented: XPS and glass
cm2 divided by the area of the wall in m2. In this study specifically an air leakage level of 1.5 NLA was considered.
TABLE 1: CLIMATE+ SUMMARY OF TAICHUNG
Mean Annual Temperature 23° C
Highest Monthly Mean Maximum Temperature (July) 33° C
Lowest Monthly Mean Maximum Temperature (January) 22° C
Highest Monthly Mean Minimum Temperature (July) 25° C
Lowest Monthly Mean Minimum Temperature (January) 13° C
RH Mean, Coldest Month 76%
RH Mean, Hottest Month 77%
Annual Precipitation 164 cm
Mean for Dominant Wind* 1.6 m/s @330 degrees (Az.)
+ Based on data from 1971 to 2000; * Year 2003
(b) Relative Humidity (a) Temperature
(c) Rainfall
12th Conference on Building Science and Technology, May 7-8, 2009, Montreal, QC, Canada
Air flo w p ath
S hea thi ng B oa rd G las s F ib re I n su lat io n Gy p su m B oa rd
FIGURE 3: SCHEMATIC AIRFLOW PATH.
SIMULATION RESULTS
A significant amount of data was generated by hygIRC-2D simulations and subsequently
post-processed for the detailed evaluation of the hygrothermal response of the building envelopes (Mukhopadhyaya and van Reenen 2007). For relative comparison of hygrothermal performance of the building envelope assembly, a hygrothermal performance indicator (RHT Index) was used in this study as described in the following paragraphs.
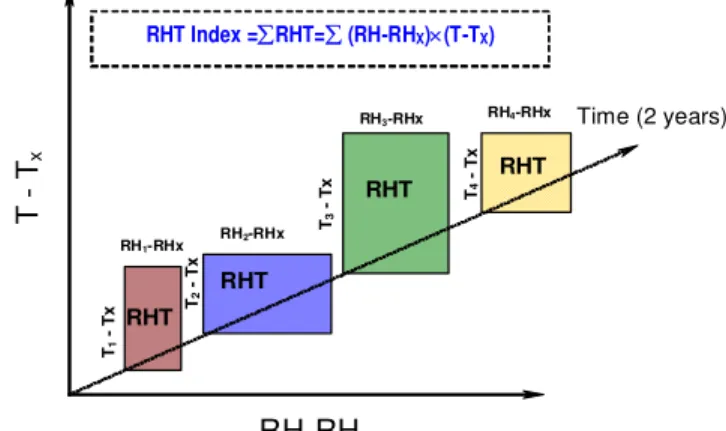
RHT INDEX –THE PERFORMANCE INDICATOR
It is widely accepted that building materials are subject to deterioration under the combined effects of temperature and moisture. The most deleterious conditions are those in which moderate or high temperature is coupled with high humidity for extended periods (Nofal and Morris 2003). This study uses a long-term hygrothermal response indicator, called the RHT index, derived from the relative humidity (RH) and temperature (T) conditions inside the building envelope cross section over a period of time for any specific area of the cross-section. The RHT index is an indicator used to quantify and compare the hygrothermal response of the wall assembly. This index captures the duration of moisture and thermal conditions coexisting above threshold RH and T levels. RH and T are given linear weight in the RHT index. It is to be noted that for many materials this may not always be the case when assessing their long-term performance while subjected to varying and elevated moisture conditions. A different weighting for RH and T can be determined only through controlled long-term experiments. The RHT index as defined in this study is:
Cumulative RHT=∑ (RH-RHX)×(T-TX) [1]
for RH>RHX% and T>TX°C at every hour of the simulation.
Where, RHX and TX are the threshold values for relative humidity and temperature respectively.
In this study two sets of threshold levels were used. The first set was with an RH of 80% at 0 °C temperature, hereafter referred as RHT80. The second set was with an RH of 95% at 0 °C temperature, hereafter referred as RHT95. The cumulative RHT was a summation done on an hourly basis for the final two years of the simulation.
During any time step when either or both RH ≤ RHX % and T ≤ TX °C, the RHT value for that time
step is zero. A schematic diagram for the generation of RHT index value is shown in Figure 4. The results presented in the following section use the cumulative two-year RHT index as a single-value hygrothermal response indicator. A higher value of RHT index indicates a greater potential for moisture-related deterioration. It is to be noted here that two different walls with similar cumulative RHT values can still have very different hygrothermal responses. At the same time, climates or
conditions that seem intuitively to be quite different can produce similar cumulative RHT values. It is also to be mentioned here that the threshold RHT index value that borders a safe and unsafe hygrothermal design of a wall system is yet to be defined.
DISCUSSION
Computer simulations for each assembly design were subsequently processed to produce the following graphical displays: (i) RHT Analysis for 80% RH and 0°C; (ii) RHT Analysis for 95% RH and 0°C; (iii) Moisture accumulation in each material component over the review period; (iv) Total moisture and moisture content (%) in the wood components over the review period; (v) Temperature and relative humidity in the wood components over the review period. However, it is not practical to present all results in this paper, hence, only brief discussion on significant observations is presented in the following paragraphs. Readers may wish to refer to the publication (Mukhopadhyaya and van Reenen 2007) for the entire information.
RHT Index = RHT=
FIGURE 4: SCHEMATIC DIAGRAM TO EXPLAIN RHT INDEX CALCULATION
WALLS WITH NO AIR LEAKAGE
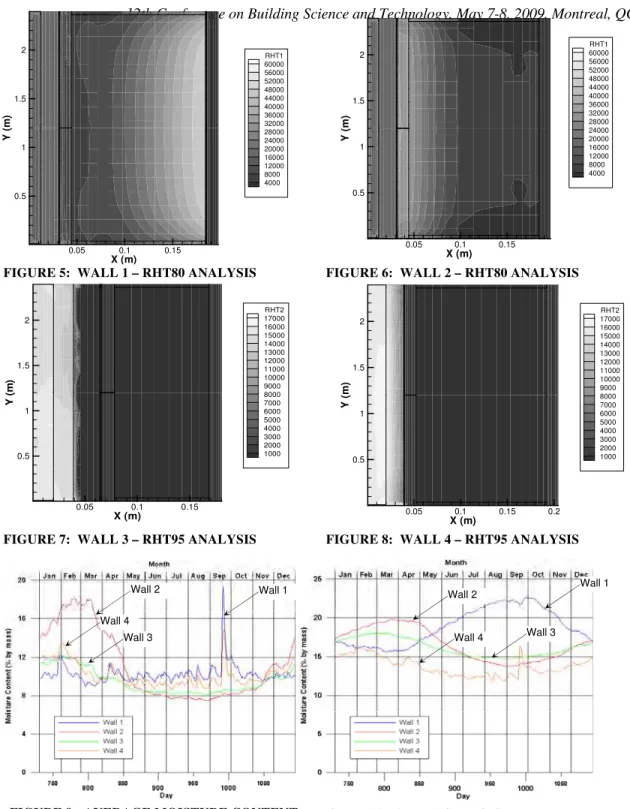
The hygrothermal simulations of the wall assemblies indicate that Wall 1 (classic cold weather) has an area of high hygrothermal loading (i.e. high RHT index values) along the interior side of the poly sheet (Figure 5). Wall 2 shows an area of moderately high RHT index values in the plywood layer (Figure 6). The RHT95 indices for all four walls, including Wall 3 and Wall 4 (Figures 7 and 8), specifically show higher levels of hygrothermal loading in the exterior cladding.
The moisture content in the plywood layer for all of the walls, during the 3rd year of simulation,
generally stays in the range from 8 % to 12% (Figure 9). However, Wall 2 has an extended period of higher moisture content, near 17%, during the months of February and March. There was also a short peak in moisture content in the month of September for Wall 1 (19%) and Wall 4 (15%).
The moisture content in the bottom and top plate stays in the range of 15% to 20% for all of the walls with the exception of Wall 1 (Figure 10). Wall 1 has an extended period above 20% moisture content from July to November.
RH-RHx T Tx Time (2 years) T1 - T x T 2 - T x T3 - T x T 4 - T x RH1-RHx RH2-RHx RH3-RHx RH4-RHx ∑ ∑ (RH-RHX)×(T-TX) RHT RHT RHT RHT
12th Conference on Building Science and Technology, May 7-8, 2009, Montreal, QC, Canada X (m) Y( m ) 0.05 0.1 0.15 0.5 1 1.5 RHT1 60000 56000 52000 48000 44000 40000 36000 32000 28000 24000 20000 16000 12000 8000 4000 2 RHT1 60000 56000 52000 48000 44000 40000 36000 32000 28000 24000 20000 16000 12000 8000 4000 X (m) Y( m ) 0.05 0.1 0.15 0.5 1 1.5 2 ROOFS
The two unvented roofs (Figures 1e and 1f) that have been examined are Roof 1 (traditional truss with rigid, XPS foam over and glass fibre insulation under sheathing) and Roof 2 (traditional truss with spray-on foam insulation under sheathing).
The RHT80 index values show similar results for both the roofs, with the highest values of RHT indices present in the roof tiles (Figures 11 and 12).
FIGURE 7: WALL 3 – RHT95 ANALYSIS FIGURE 8: WALL 4 – RHT95 ANALYSIS FIGURE 5: WALL 1 – RHT80 ANALYSIS FIGURE 6: WALL 2 – RHT80 ANALYSIS
X (m) Y( m ) 0.05 0.1 0.15 0.5 1 1.5 2 RHT2 17000 16000 15000 14000 13000 12000 11000 10000 9000 8000 7000 6000 5000 4000 3000 2000 1000 RHT2 17000 16000 15000 14000 13000 12000 11000 10000 9000 8000 7000 6000 5000 4000 3000 2000 1000 X (m) Y( m ) 0.05 0.1 0.15 0.2 0.5 1 1.5 2 Wall 1
Wall 2 Wall 1 Wall 2
Wall 4
Wall 3
FIGURE 9: AVERAGE MOISTURE CONTENT
IN PLYWOOD. FIGURE 10: AVERAGE MOISTURE CONTENT IN BOTTOM PLATE
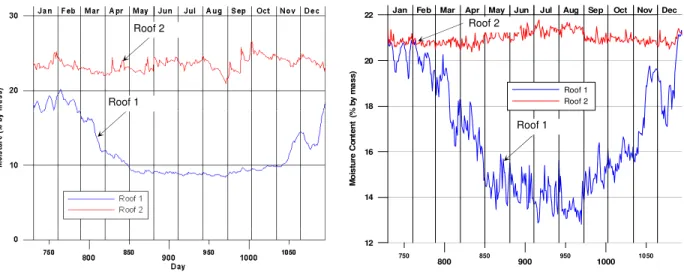
While looking at the total moisture content in these two roofs, Roof 2 has higher total moisture content for the year being examined (Figures 13 and 14). In the plywood, the moisture content in Roof 2 varies around 25% while Roof 1 varies from 10% to 20% (Figure 15). An estimate of the moisture content in the rafters was calculated from the relative humidity in the insulated space. In this case the moisture content also remained higher in Roof 2 (Figure 16).
FIGURE 11: ROOF 1 – RHT80 ANALYSIS FIGURE 12: ROOF 2 – RHT80 ANALYSIS
Total Total Plywood Plywood Roof Tile Roof Tile
FIGURE 13: MOISTURE ACCUMULATION IN
12th Conference on Building Science and Technology, May 7-8, 2009, Montreal, QC, Canada
Months
WALLS WITH AIR LEAKAGE
Hygrothermal simulations with one level of air leakage (1.5 NLA) were conducted on Wall 3 (Super
E®) and Wall 4 (low cost). The RHT80 index values are shown in Figures 17 and 18. There are
visible areas of higher hygrothermal loading (i.e. higher RHT index) inside the stud space and on the bottom plate in both walls with air leakage.
The moisture content in the plywood remained in the range of 8% to 14% for all simulations (Figure 19) and in general air leakage did not influence the moisture content of the plywood significantly. In the top plate the moisture content remained in the range of 12% to 18% (Figure 20). With air leakage there were lower moisture contents in the top plate than in the simulations with no air leakage. In the bottom plate the moisture contents were higher in the simulations with air leakage (Figure 21). In
Wall 3 the moisture content reached a level of around 21% for the period from January to March, and
in Wall 4 the moisture content reached a level of over 25% for the same period.
the top plate the moisture content remained in the range of 12% to 18% (Figure 20). With air leakage there were lower moisture contents in the top plate than in the simulations with no air leakage. In the bottom plate the moisture contents were higher in the simulations with air leakage (Figure 21). In
Wall 3 the moisture content reached a level of around 21% for the period from January to March, and
in Wall 4 the moisture content reached a level of over 25% for the same period.
FIGURE 18: WALL 4 WITH AIR LEAKAGE – RHT80 ANALYSIS
FIGURE 18: WALL 4 WITH AIR LEAKAGE – RHT80 ANALYSIS
FIGURE 17: WALL 3 WITH AIR LEAKAGE – RHT80 ANALYSIS
FIGURE 17: WALL 3 WITH AIR LEAKAGE – RHT80 ANALYSIS X (m) Y( m ) 0.05 0.1 0.15 0.5 1 1.5 2 RHT1 60000 56000 52000 48000 44000 40000 36000 32000 28000 24000 20000 16000 12000 8000 4000 X (m) Y( m ) 0.05 0.1 0.15 0.2 0.5 1 1.5 2 RHT1 60000 56000 52000 48000 44000 40000 36000 32000 28000 24000 20000 16000 12000 8000 4000
FIGURE 15: MOISTURE CONTENT IN PLYWOOD 800 900 1000 750 850 950 1050 12 14 16 18 20 22 Jan M o is tu re C o n te n t (% b y m a s s )
Feb Mar Apr May Jun Jul Aug Sep Oct Nov Dec
Roof 2 Roof 2
Roof 1
Roof 1 Roof 2
Roof 1
FIGURE 16: MOISTURE CONTENT IN RAFTERS
Wall 3
Wall 3 – 1.5NLA Wall 4 – 1.5NLA Wall 4 – 1.5NLA Wall 3
Wall 3 – 1.5NLA
Wall 4
Wall 4
Wall 3 – 1.5NLA Wall 4 – 1.5NLA
CONCLUSIONS
Wall 3 Wall 4
Following three major observations can be made from the results presented in this paper:
1. Under conditions with no air leakage the classic cold weather wood frame wall indicated the increased concern for long-term hygrothermal performance related issues. There were areas of wall cross sections where higher moisture content and RHT indices occurred.
2. The unvented roof simulations show that roof tile is the most vulnerable to higher hygrothermal loading. The roof with foam over and insulation under the sheathing had lower moisture contents in the wood components of the construction.
3.
Air leakage was simulated in both the Super E® wall and the low cost wall. The simulationresults showed increased hygrothermal loading in the stud cavity and on the bottom plate. REFERENCES
Djebbar, R., Kumaran, M.K., Van Reenen, D. and Tariku, F. (2002a). Hygrothermal modelling of building envelope retrofit measures in multi-unit residential and commercial office buildings. IRC/NRC, National Research Council, Ottawa, Canada, Client Final Report B-1110.3, pp. 187.
Djebbar, R.; Kummaran, M.K.; Van Reenen, D.;Tariku, F. (2002b). Use of hygrothermal numerical modeling to identify optimal retrofit options for high-rise buildings. 12th International Heat Transfer Conference, Grenoble, France, Sept. 18, pp. 165-170.
12th Conference on Building Science and Technology, May 7-8, 2009, Montreal, QC, Canada
Hagentoft, C-E., Adan, O., Adl-Zarrabi, B., Becker, R.; Brocken, H., Carmeliet, J., Djebbar, R., Funk, M., Grunewald, J., Hens, H., Kumaran, M.K., Roels, S., Kalagasidis, A.S., Shamir, D. (2004). Assessment Method of Numerical Prediction Models for Combined Heat, Air and Moisture Transfer
in Building Components: Benchmarks for One-dimensional Cases. Journal of Thermal Envelope and
Building Science, v. 27, no. 4, April 2004, pp. 327-352.
Hens, H. (1996). Heat, air and moisture transport, Final Report, Vol. 1, Task 1: Modelling, International Energy Agency Annex 24, Laboratorium Bouwfysica, K. U.-Leuven, Belgium.
Karagiozis, A. (1997). Analysis of the Hygrothermal Behaviour of Residential High-rise Building
Components. Client Report A-3052.4, IRC/NRC, National Research Council Canada, Ottawa.
Kumaran, K., Lackey, J., Normandin, N., Tariku, F and van Reenen, D. (2004). A Thermal and Moisture Transport Property Database for Common Building and Insulating Materials, Final Report
from ASHRAE Research Project 1018-RP, pp. 1-229.
Kumaran, K., Lackey, J., Normandin, N., van Reenen, D. and Tariku, F. (2002). Summary report
from Task 3 of MEWS project. Institute for Research in Construction, National Research Council,
Ottawa, Canada, (NRCC-45369), pp. 1-68.
Kumaran M. K., Mukhopadhyaya P., Cornick S. M., Lacasse, M. A., Maref W., Rousseau M., Nofal M., Quirt J. D. & Dalgliesh W. A. (2003). An Integrated Methodology to Develop Moisture
Management Strategies for Exterior Wall Systems. 9th Conference on Building Science and
Technology, Vancouver, Canada, pp. 16.
Maref, W., Kumaran, M. K., Lacasse, M. A. Swinton, M. C. and van Reenen, D. (2002). Advanced
Hygrothermal Model hygIRC: Laboratory Measurements and Benchmarking. 12th International Heat
Transfer Conference, Grenoble, France, pp. 1-6.
Mukhopadhyaya, P., van Reenen, D., Kumaran, K., Copeland, C., Newman, P. J., El Khanagry, R., and Zalok, E. (2008). “Moisture Performance Assessment of Wood-frame Exterior Building
Envelope Construction in China”, Nordic Symposium on Building Physics 2008, Copenhagen 16 - 18
June, pp. 1055-1062.
Mukhopadhyaya, P., Lackey J., Normandin N., Tariku F., and van Reenen, D. (2004). Hygrothermal Performance of Building Envelope Retrofit Options: Task 1 - A Thermal and Moisture Transport
Property Database, IRC/NRC, National Research Council Canada, Ottawa, Client Final Report, pp.
1-37, (B-1137.5).
Mukhopadhyaya, P. and Kumaran, M. K. (2001). Prediction of Moisture Response of Wood Frame
Walls Using IRC’s Advanced Hygrothermal Model (hygIRC). 2nd Annual Conference on Durability
and Disaster Mitigation in Wood-Frame Housing, pp. 221-226.
Mukhopadhyaya, P. Kumaran, M. K. van Reenen, D. and Tariku F. (2001). Influence of Sheathing
Membrane and Vapour Barrier on Hygrothermal Response of Stucco Walls, International Conference
on Building Envelope Systems and Technologies (ICBEST), Vol. 1, pp. 269-274.
Mukhopadhyaya, P., Kumaran, K., Rousseau, M., Tariku, F. van Reenen, D., and Dalgliesh, W.A.
(2003). Application of Hygrothermal Analyses to Optimise Exterior Wall Design, Research in
Building Physics, Sept. 14-18, Leuven, Belgium, pp. 417-426.
Mukhopadhyaya, P., and van Reenen, D. (2007). Assessment of Moisture Performance of
Wood-frame Walls in China and Taiwan, IRC/NRC, National Research Council Canada, Ottawa, Client
Final Report, pp. 1-176, (B1083.1).
Nofal, M. and Morris, P.I. (2003). Criteria for Unacceptable Damage on Wood Systems,
Japan-Canada Conference on Building Envelope, Vancouver, Japan-Canada, 6/4/2003, pp. 1-14.
Swinton, M.C. and Sander, D.M. (1994). Trade-off Compliance for Houses: Specifications for Calculation Procedures for Demonstrating Compliance to the National Energy Code for Houses using Trade-offs”, pp. 46, March 01, (NRCC-39861).