Publisher’s version / Version de l'éditeur:
Vous avez des questions? Nous pouvons vous aider. Pour communiquer directement avec un auteur, consultez la
première page de la revue dans laquelle son article a été publié afin de trouver ses coordonnées. Si vous n’arrivez pas à les repérer, communiquez avec nous à PublicationsArchive-ArchivesPublications@nrc-cnrc.gc.ca.
Questions? Contact the NRC Publications Archive team at
PublicationsArchive-ArchivesPublications@nrc-cnrc.gc.ca. If you wish to email the authors directly, please see the first page of the publication for their contact information.
https://publications-cnrc.canada.ca/fra/droits
L’accès à ce site Web et l’utilisation de son contenu sont assujettis aux conditions présentées dans le site
LISEZ CES CONDITIONS ATTENTIVEMENT AVANT D’UTILISER CE SITE WEB.
Aging Infrastructures Workshop [Proceedings], pp. 1-20, 2009-07-21
READ THESE TERMS AND CONDITIONS CAREFULLY BEFORE USING THIS WEBSITE. https://nrc-publications.canada.ca/eng/copyright
NRC Publications Archive Record / Notice des Archives des publications du CNRC : https://nrc-publications.canada.ca/eng/view/object/?id=94338bcc-32a2-447a-98b3-deb6a2fef4fe https://publications-cnrc.canada.ca/fra/voir/objet/?id=94338bcc-32a2-447a-98b3-deb6a2fef4fe
NRC Publications Archive
Archives des publications du CNRC
This publication could be one of several versions: author’s original, accepted manuscript or the publisher’s version. / La version de cette publication peut être l’une des suivantes : la version prépublication de l’auteur, la version acceptée du manuscrit ou la version de l’éditeur.
Access and use of this website and the material on it are subject to the Terms and Conditions set forth at
A multi-objective approach for the management of aging critical
highway bridges
http://www.nrc-cnrc.gc.ca/irc
A m ult i-obje c t ive a pproa c h for t he m a na ge m e nt of a ging c rit ic a l
highw a y bridge s
N R C C - 5 1 2 6 6
L o u n i s , Z . ; D a i g l e , L . ; C u s s o n , D . ; A l m a n s o u r ,
H .
J u l y 2 0 0 9
A version of this document is published in / Une version de ce document se trouve dans:
Aging Infrastructures Workshop, Columbia University, New York City, July 21,
2009, pp. 1-20
The material in this document is covered by the provisions of the Copyright Act, by Canadian laws, policies, regulations and international agreements. Such provisions serve to identify the information source and, in specific instances, to prohibit reproduction of materials without written permission. For more information visit http://laws.justice.gc.ca/en/showtdm/cs/C-42
Les renseignements dans ce document sont protégés par la Loi sur le droit d'auteur, par les lois, les politiques et les règlements du Canada et des accords internationaux. Ces dispositions permettent d'identifier la source de l'information et, dans certains cas, d'interdire la copie de documents sans permission écrite. Pour obtenir de plus amples renseignements : http://lois.justice.gc.ca/fr/showtdm/cs/C-42
A Multi-Objective Approach for the Management of
Aging Critical Highway Bridges
Z. Lounis1, L. Daigle, D. Cusson, H. Almansour National Research Council Canada Institute for Research in Construction
Ottawa, ON, Canada, K1A 0R6
ABSTRACT
This paper presents an approach for a multi-objective-based management of aging critical highway bridges to improve their life cycle performance with emphasis on improving public safety and security. The proposed multi-objective optimization framework is presented as an effective approach that overcomes some of the limitations and complexities of cost-benefit or risk analyses, where all consequences need to be expressed in monetary terms. The framework prioritizes first the critical bridges and then identifies the risk mitigation measures that can be used to satisfy several possible management objectives such as maximizing public safety and public security, minimizing traffic disruption and minimizing costs. Risk mitigation strategies can include more frequent and/or more in-depth inspections, load rating, monitoring of the structural performance and security of bridges, rehabilitation and strengthening of damaged elements, and protection of weak and vulnerable components against extreme shocks due to natural hazards or intentional attacks. A multi-objective criticality index is proposed as a prioritization criterion that achieves an adequate best trade-off between all identified and conflicting objectives. The implementation of the proposed approach is demonstrated on three examples that illustrate the prioritization process on a hypothetical network of ten critical bridges and the use of different risk mitigation measures, such as health monitoring and deterioration prediction models on bridge structures.
1. INTRODUCTION
Highway bridges are critical links in the transportation networks that enable personal mobility and facilitate transportation of goods on much longer transportation roads or corridors. Having a reliable Canadian transportation network is of utmost importance to ensuring public safety and security, preserving the high quality of life and competitiveness of Canada’s economy. Hence, it is essential to ensure that the critical links of Canada’s transportation network are kept safe, serviceable and functional as the failure of a single bridge can lead to a complete closure of the roadway and serious disruption of traffic. Bridges are very complex infrastructure systems with several components that have different failure modes, as well as different consequences of failure. Bridges consist of three main sub-systems: (i) substructure; (ii) superstructure; and (iii) deck, which in turn consist of several components made of different materials, such as concrete, steel, timber, etc. There are several types of superstructure systems, including slab-on-girders, solid or voided slabs, rigid frames, box girders, arches, trusses, cable-stayed or suspension systems, which have different load distribution characteristics, behaviors and modes of failure.
A large number of these highway bridges in North America were built during the post-war construction booms of the 1950’s, 1960’s and 1970’s. Highway bridges are complex structural systems that deteriorate with time as a result of cumulative damage effects, increased loads, extreme shocks, inadequate inspection, maintenance and protection, poor workmanship and errors in design. The preservation of these aging bridges is estimated at hundreds of billions of dollars, which is more than can be accommodated by highway agencies. The magnitude of the problem poses technological and economical challenges, specifically which bridges should be given high priority for preservation and protection and what are the optimal strategies that will achieve an acceptable trade-off between their risk of failure and life cycle costs. Many of the bridges in North America are considered deficient or vulnerable in terms of safety, mobility, and security. During their service lives, bridge systems and
1
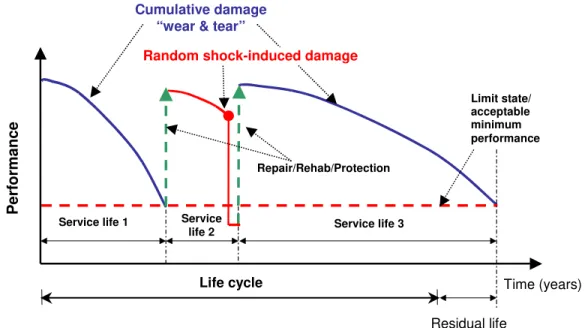
components deteriorate due to the cumulative damaging effects induced by traffic loads, corrosion, fatigue, and environmental effects (e.g. freeze-thaw cycles), as shown in Figure 1. In addition to this cumulative damage, bridges can be subjected to less frequent but severe natural and intentional shocks, such as earthquakes, extreme wind loads, flood, accidental loads due to ship or truck impacts, and possibly explosions from terrorist attacks that could lead to partial or total bridge collapse. Bridges can be identified as critical in terms of safety and security if the consequences of their failure are very serious whereas some of these bridges may additionally reveal a high vulnerability to sudden shocks. The consequences of failure of such bridges can include fatalities, injuries, disruption/closure of disaster response route, illnesses, disruptions of traffic, as well as possible negative environmental and socio-economic impacts. The definition of minimum acceptable safety levels of aging bridges is a complex problem that requires the consideration of several criteria, including: (i) robustness and redundancy of structure; (ii) mode of failure (ductile or brittle); (iii) control of overload on bridge; and (iv) level of inspection of system or component.
The recent developments in sensors and wireless technologies can be used for the continuous or semi-continuous monitoring of the structural health, as well as for the security monitoring of the bridges that have been identified as critical. The recent developments in advanced materials such as high performance and ultra-high performance concrete, corrosion-resistant steel and advanced composites can be used to strengthen, protect and replace damaged bridge systems or components, and build new long-life bridges.
The widespread deterioration, some recent bridge collapses, and the growing concerns for sustainability and security of bridges have highlighted the importance of developing and implementing effective management strategies to improve their life cycle performance. The development and implementation of such management systems is a very complex and challenging problem given the size and age of the bridge network and the constraints on the available funds for their preservation and protection.
Time (years) Pe rf orma nce Life cycle Residual life Limit state/ acceptable minimum performance Service life 1 Cumulative damage “wear & tear”
Service life 2
Repair/Rehab/Protection
Service life 3
Random shock-induced damage
Figure 1. Impacts of deterioration, preservation and protection on life cycle performance of bridges
To address the problem of aging highway bridges, several transportation agencies have developed or initiated the development of bridge management systems to optimize the preservation of their deteriorated structures. Different approaches to preservation optimization have been implemented in the different bridge management systems ranging from simplified heuristic or expert opinion-based approaches to more complex Markovian decision processes. The development of effective bridge management system depends primarily on the availability of reliable condition assessment methods and technologies that can be used to assess the current states and forecast the future states to develop cost-effective short- and long-term management plans. Given the large uncertainties in the occurrences of different types of loads and hazards, their magnitudes, current condition
assessment methods, and deterioration of bridge systems, stochastic modeling of the load and capacity of bridges is required. Such models will enable a more objective quantification of the probabilities of failure of the critical bridges and will help overcome some of the limitations of the qualitative models that are currently in use.
Furthermore, bridge management aims at improving the overall performance of a bridge or a network of bridges through the satisfaction of several objectives, which can include the minimization of maintenance costs, maximization of service life, minimization of risk of failure, minimization of bridge closures, accommodation of increased traffic, etc. Multi-criteria optimization techniques provide a practical tool for optimal prioritizing of bridges for maintenance. In this paper, a multi-objective approach for the management of aging critical bridge structures is presented. It is based on the consideration of the minimization of risk of failure, minimization of maintenance costs at the project level, maximization of overall condition of critical highway bridges by undertaking the largest possible number of critical preservation and protection projects, and minimization of traffic disruption, with more emphasis on high-risk projects. The merits of multi-objective optimization approach are discussed. The compromise programming approach is used to determine the optimal solutions and a multi-objective criticality index is proposed as a parameter for the prioritization of projects for maintenance and protection. Three examples demonstrate the application of the proposed approach for the management of a small network of deficient highway bridge structures and illustrate different risk mitigation measures.
2. MULTI-OBJECTIVE MANAGEMENT OF AGING BRIDGES
The approaches to maintenance optimization implemented in the current bridge management systems are based on single objective optimization, and more specifically on the minimization of maintenance costs or life cycle costs, which represents the present value of all the costs incurred throughout the life cycle of a bridge structure, including, the costs of design, construction, maintenance, repair, rehabilitation, replacement, demolition and, in some instances, the users costs. The management of bridges is a multi-objective optimization problem as the bridge owner or manager seeks to satisfy implicitly and simultaneously several objectives, such as the minimization of costs to owners and users, improvement of public safety and security, improvement of serviceability and functionality, minimization of maintenance time, minimization of traffic disruption, etc. The solution of such bridge management problem can be obtained using the techniques of criteria or multi-objective optimization presented below.
Despite its practicality and relevance, the use of risk as a criterion for decision-making in the management of highway bridges is not easy given the complexities of assessing the probability of failure, as well as the consequences of failure. In the current life cycle cost or cost-benefit analyses, which have been implemented in many bridge management systems that are used by different transportation agencies in North America, all losses, including fatalities, injuries, and social costs are quantified in monetary terms. This means that a monetary value must be assigned to human life, and various methods have been developed. Given the difficulty of accepting the notion of placing any sort of value on human life, Starr (1969) instead evaluated the risk of death from various causes and identified two general categories for risk of death: (i) risk associated with voluntary activities (e.g. risk of death from driving a car) in which the individual evaluates and adjusts his exposure to risk; and (ii) risk associated with involuntary activities (e.g. risk of death due to failure of a bridge), where the risk levels are specified by regulations from governmental agencies. Starr (1969) indicated that the public typically was willing to accept a level a risk 1,000 times greater for voluntary risks than for involuntary risks. Paté-Cornell (1994) proposed a range of acceptable levels of death risk for the public and workers that varies quite widely from 1/100 000 000 to 1/1000 deaths/exposed person/year.
Figure 2. Framework for multi-objective management of aging highway bridges
Improve Life Cycle Performance
of Critical Bridges
Safety
Performance objectives
Fatalities, injuries, illnesses, traffic disruption, pollution, asset destruction, socio-economic impacts H a za rd
s
Ri skA
sse
ssm
en
t
Ri skManag
em
ent
Extreme ShocksExtreme wind, flood, earthquake, vehicle
impact,ship impact, explosion, fire
Priority List of Critical Bridges
Identify safety-critical and security-critical bridges
Bridge Preservation Frequent or In-Depth Inspections Continuous Monitoring i Maintenance/ Strengthening Protection of Critical Systems Quantitative Assessment Structural safety, vulnerability, robustness, serviceability, service life Increasing
Traffic
Environmental Loads
Deicing Salts, seawater, CO2,
temperature, wind
Health Mobility Security Environment
Quality Economy Social Equity
Consequences of Deterioration/Failure
Physical Condition
Multi-Objective Prioritization
Safety, Health, Mobility, Security, Cost, etc…
Assess Current State
Non-destructive evaluation, load rating, continuous health monitoring Aging
Forecast Future States
Stochastic deterioration models Stochastic models of loads
It is clear from the above discussion that the existing approaches to decision making have serious limitations as they express all losses in monetary terms and consider only one criterion at a time, e.g. minimization of owner costs. In this paper, a multi-objective approach for decision-making, which can incorporate all relevant objectives, is proposed to help solve the bridge management problem. Such an approach enables a better evaluation of the effectiveness of preservation and protection strategies in terms of several objectives (safety, security, mobility, cost) and determines the optimal solution that achieves the best trade-off between all of them (including conflicting ones, such as safety and cost). Figure 2 outlines the proposed framework for multi-objective management of highway bridge structures. The development and implementation of this framework will provide effective decision support to bridge owners and managers in optimizing the allocation of their limited funds, as well as improving the life cycle performance of their bridges.
Several approaches have been developed to solve objective optimization problems, including multi-attribute utility theory (Von Neumann and Morgenstern 1947; Keeney and Raiffa 1976), weighted sum approach (Zadeh 1963), compromise programming, constraint approach, and sequential optimization (Koski 1984; Lounis and Cohn 1993, 1995). In this paper, the compromise programming approach is used to solve the multi-objective management problem.
In multi-objective (or vector) optimization problems, the notion of optimality is not that obvious because of the presence of multiple, incommensurable and conflicting objectives. In general, there is no single optimal (non-dominated or superior) solution that simultaneously yields a minimum (or maximum) for all objective functions. The Pareto optimality concept has been introduced as the solution to multi-objective optimization problems (Koski 1984; Lounis and Cohn 1993). A maintenance strategy x* is said to be a Pareto optimum if and only if there exists no maintenance strategy in the feasible set of maintenance alternatives that may yield an improvement of some criterion without worsening at least one other criterion. The multi-criteria maintenance optimization problem can be mathematically stated as follows:
Find: x* = Optimum
Such that: f(x)= [ f1(x), f2(x) ………. fm(x) ]T = minimum x ∈ Ω (1a)
Σ
C(x) ≤ B (1b)Ω ={x ∈ N: βth ≤ β(x) ≤ βmin} (1c)
where f = vector of m optimization objectives (e.g. safety, security, cost, mobility); C(x)= cost of maintenance or protection strategy (x); Ω= subset of the bridge or bridge network that at a specific time contains critical bridge components/systems having a reliability index (β) between a threshold value (safety-critical) and a maximum value controlled by cost; B= Budget constraint for maintenance and protection work; N= entire set of bridges requiring maintenance and protection; and T= transpose symbol.
The concept of Pareto optimality mentioned above, may be stated mathematically as follows (Koski 1984; Lounis and Cohn 1993):
x* is a Pareto optimum if:
fi(x) ≤ fi(x*) for i=1,2,…,m (2a)
with fk(x) < fk(x*) for at least one k (one of the m objectives) (2b) Figure 3 is a schematic illustration of the conflicting nature of the criteria of minimization of maintenance/protection costs and minimization of normalized probability of failure. In general, there are several Pareto optimal solutions (also called non-dominated solutions) for a multi-objective optimization problem as shown in Figure 3. In this figure, two dominated solutions are also shown to illustrate the concept of dominance. Once the set of Pareto optima is generated, the “best” solution that achieves the best compromise between all competing objectives is sought. Such a solution is referred to as “satisficing” solution in the multi-objective optimization literature (Koski 1984; Lounis & Cohn 1993,1995).
Costs
Probability of Failure
Pareto Optima
Dominated or
“Non-Pareto” Solutions
Figure 3. Schematic illustration of Pareto optima and conflicting optimization objectives
In compromise programming, the so-called “satisficing” solution is defined as the solution that minimizes the distance from the set of Pareto optima to the so-called “ideal solution”. This ideal solution is defined as the solution that yields minimum (or maximum) values for all criteria. Such a solution does not exist, but is introduced in compromise programming as a target or a goal to get close to, although impossible to reach. Lounis and Cohn (1993, 1995) proposed a multi-objective optimality or criticality index, “MCI”, as a criterion for ranking competing bridge design alternatives. The criterion used in compromise programming is the minimization of the deviation from the ideal solution f* measured by the family of Lp metrics (Lounis and Cohn 1993, 1995). In this paper, the multi-objective criticality index, “MCI”, is defined as the value of the weighted and normalized deviation from the ideal solution f* measured by the family of Lp metrics:
(3) ) x ( f min ) x ( f max ) x ( f min ) x ( f w ) x ( MCI m 1 i p i i i i p i p / 1 ⎥ ⎥ ⎦ ⎤ ⎢ ⎢ ⎣ ⎡ − − = ∑ =
This family of Lp metrics is a measure of the closeness of the satisficing solution to the ideal solution. The value of the weighting factors wi of the optimization criteria fi (i=1, …, m) depends primarily on the attitude of the decision-maker towards risk in terms of both public safety and public security. In this paper, structural safety is considered as the governing objective therefore a higher weight is placed on the objective of maximization of the reliability index. However, the optimization will also be carried out for equal weighting of all criteria to show the impact of weighting factors on the optimal decision. The choice of “p” indicates the importance given to different deviations from the ideal solution. For example, if p=1, all deviations from the ideal solution are considered in direct proportion to their magnitudes, which corresponds to a group utility (Duckstein 1984). However, for p ≥2, a greater influence is given to larger deviations from the ideal solution, and L2 represents the Euclidian metric. For p=∞, the largest deviation is the only one taken into account and is referred to as the Chebyshev metric or minimax criterion, and L∞corresponds to a purely individual utility (Duckstein 1984; Koski 1984; Lounis and Cohn 1995). In this paper, the Euclidean metric is used to determine the multi-objective criticality index and corresponding “satisficing” solution.
3. STRATEGIES FOR MANAGEMENT OF CRITICAL BRIDGES
As mentioned earlier, existing highway bridges may be subjected to different types of hazards with very different likelihoods and consequences within their life cycles. These hazards can be grouped into three different categories:
1. Progressive cumulative damage such as corrosion, increased traffic loads, fatigue, aggressive environmental factors;
2. Extreme natural or accidental hazards such as earthquake, extreme wind, flooding, truck and ship impact on bridge structures; and
3. Extreme intentional hazards, such as terrorism acts (explosives), vandalism acts, etc.
For a given component/system and a given failure mode, the load effect and strength are time-dependent and present considerable uncertainty in their mean values as well as in their levels of scatter, which increase with time. In general, the strength decreases with time due to corrosion, fatigue and overload. As a result, the safety margin and the corresponding reliability index decrease with time. The prediction of the reliability of a bridge structure throughout its life cycle should be based on a probabilistic modeling of the load and strength of the bridge structure and system, and on the use of appropriate analytical or numerical structural reliability analysis methods. The failure and the end of life of a bridge structure can be defined as the time interval at which the reliability index reaches a limit state or minimum acceptable level, as shown in Figure 1. This minimum value depends on the mode of failure considered, the bridge element or system, the redundancy of the system, and the consequences of failure. This service life is the time at which a major maintenance or protection action is required, which can be rehabilitation, strengthening, protection, or replacement, after which the reliability may be increased to an adequate level. An overview of the different strategies that can be used to reduce the risk of failure of highway bridges is provided in the next sections.
3.1. Performance-based inspection
Most highway agencies recommend that visual inspections of bridges be carried out every two years (e.g. MTO 2000, FHWA 1979). In addition, it is expected that maintenance crews perform routine inspection to identify sudden changes in bridge condition on a more frequent basis. For bridges identified as critical for safety or security reasons, it is proposed that more frequent inspections or specialized investigations should be conducted especially when they meet anyone of the following criteria:
• Structures with single load paths or limited redundancy (in-depth inspection);
• Structures with a critical element in the “poor” condition state (structure evaluation, load testing). • Structures with load limits;
• New types of structures, materials or details with no previous performance history (more frequent inspection/in-depth inspection of details);
• Structures with fatigue prone details (fatigue investigation); • Structures with fracture-critical members (X-ray investigation); • Pins and hangers in arch structures (in-depth inspection); and • Pins in suspended spans and pinned arches (in-depth inspection).
For critical bridges, specialized inspections such as seismic investigation, underwater investigation and substructure condition surveys should be mandatory especially when the likelihood of occurrence of one or more of these extreme shocks (flood, earthquake, vehicle impact, ship impact) is high or even moderate.
3.2. Quantitative condition assessment and deterioration prediction
The most widely used model for the deterioration prediction of bridges and other type of infrastructures is the Markov chain model. This model is being adopted by several highway agencies in their bridge management systems (such as Pontis, Bridgit and other systems) at both network and project levels (Golabi et al. 1992, Hawk 1999, Thompson et al. 1999). It is based on a discretization of the condition of the bridge elements/systems into a finite set of states (i.e. excellent, good, fair, poor) and probabilities that the element or system will jump from one condition state to the next state within a unit time period. These probabilities are most of the time obtained from expert opinions or from a combination of expert opinions and historical data when available using Bayesian updating.
The main advantages of the Markov type models are their compatibility with existing qualitative/discrete bridge condition rating systems and simplicity to use. These models are very practical at the network level, where decisions need to be made on a large number of systems and at different points in time. However, for critical aging highway bridges, the Markov type models have shortcomings that can be summarized as follows:
• The damage states are often based on qualitative condition ratings of bridges that are not uniquely related to measurable physical quantities;
• Qualitative models are inadequate for severely damaged bridges for which safety may become an issue as they only provide a qualitative prediction of the future condition of the asset (e.g. excellent, good, fair, poor);
• Only cumulative damage effect can be modeled (i.e. progressive accumulation of damage with time “wear and tear”), thus cannot predict shock-induced failures caused by extreme events
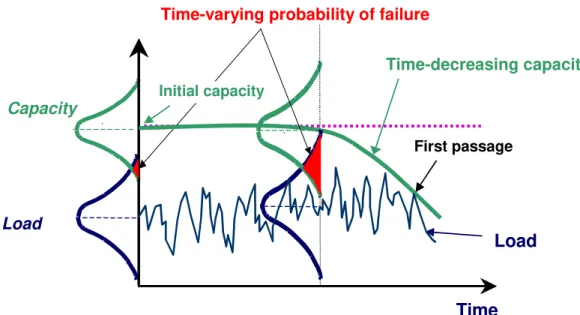
The prediction of the safety of critical highway bridges should be based on rigorous and quantitative models that can provide reliable measures of the remaining capacity of the asset or its probability of failure. If the bridge or a critical element of the bridge is severely deteriorated and its capacity is seriously reduced, it is very important to ensure that the probability of failure does not exceed a specified acceptable level. Generally, the load and capacity are time-dependent and random. Changes in both of their mean values and standard deviations could occur. Very often, the load tends to increase (due to increasing demand), while the capacity tends to decrease due to deterioration. Similarly, the variability or standard deviation of the load may increase with time due to lower confidence in predicting the load for longer periods of time, while the variability or standard deviation of the capacity may increase due to uncertainty in predicting the effect of different deterioration mechanisms on the capacity of the system. Therefore, for a reliable and quantitative assessment of the performance of critical bridges, the use of more advanced stochastic processes is required. This complex time-dependent reliability problem could be schematically represented as shown in Figure 4. Since both the load and capacity are stochastic processes, the prediction of the probability of failure can be formulated as a first passage or crossing time problem and solved using time-dependent reliability analysis methods (Lounis et al. 2003; Mori and Ellingwood 1993). However, for service life prediction and reliability assessment in general, the quantity of interest is not the above instantaneous probability of failure, but rather the probability of failure within an interval of time. The time at which the load crosses the barrier defined by the capacity of the system for the first time is the time to failure and is a random variable. The probability that the capacity is less than the load within the time interval is called the “first passage probability”. As pointed out earlier, the solution of the crossing problem is rather difficult, because the complete history of the stochastic processes within the time interval require a considerable amount of quantitative data on the load (that can be obtained with structural health monitoring) and capacity.
Load
Load
Capacity Initial capacity Time-decreasing capacityTime
Time-varying probability of failure
First passage
Figure 4. Schematic illustration of a crossing problem with stochastic load and capacity
3.3. Continuous/semi-continuous structural health monitoring
The implementation of monitoring strategies can help improve the safety and security of bridges and optimize their in-depth inspection, maintenance, repair, rehabilitation and replacement to reduce their life cycle costs. The continuous and simultaneous measurements at critical discrete points of a deteriorating bridge system can allow the assessment of its performance with respect to different limit states, including safety and serviceability. Moreover, deterioration prediction models can be developed or calibrated from such monitoring data, which can optimize intervention strategies as to how and when to repair or rehabilitate, thus extending the service life of highway bridges. The majority of Canada’s bridges are short and medium-span bridges that exhibit serious deterioration induced by corrosion due to the use of de-icing salts and compounded by increased traffic loads. On the other hand, long-span bridges are very critical structures for their very high initial cost and high volume of traffic. The failure of long span bridges can be catastrophic with a large number of fatalities. Furthermore, such structures can be identified as security-critical.
Long-span bridges are sensitive to reductions in the flexural and torsional stiffness induced by corrosion damage and overload in the superstructure. Their performance is usually controlled by serviceability limit states. The vibration amplitude of the deck due to traffic or wind can become a serious problem, which is further compounded by aging and deterioration that could lead to a significant change of the vibration modes, resulting in serious reduction of the bridge fatigue resistance. Hence, the dynamic performance parameters of long-span bridges should be considered first in a monitoring strategy that would include sensors such as accelerators, pressure (for wind) and deformation sensors. Long span bridges are very flexible systems, which can enable them to absorb some of the damage induced by extreme shock such ship impacts or explosions, assuming no significant local failure. The most effective monitoring technique to mitigate the risk of extreme shocks is the continuous video surveillance as part of the alert/avoidance system.
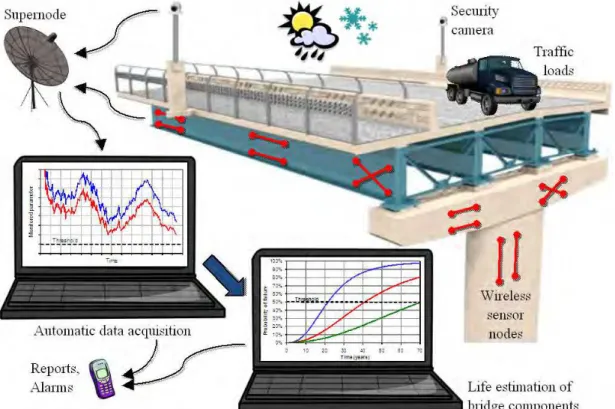
Structural health monitoring (SHM), either with embedded sensors or by actual field-testing, is an evolving technology that allows monitoring the condition of existing or new civil engineering structures. Implementation of SHM as an essential part of structural design will be key to the development of the next generation of long-life smart bridges. Intelligent sensing systems may be composed of four main elements: (i) sensors and actuators collecting data and taking action in an environment of interest; (ii) a network for the transmission of data and control signals; (iii) systems for data management and visualization; and (iv) specific analysis and decision-making applications. Figure 5 illustrates the concept of SHM for a bridge structure.
The selection of the required types and number of sensors located at discrete and critical points in a given bridge relies on the type of bridge and the experience of the engineer and his/her knowledge of the physical, chemical and mechanical processes, and on the budget allocated for SHM. In a larger context, monitoring data can be considered similar to quality assurance and acceptance sampling, since it is not realistically feasible to monitor all performance indicators in all sections of an entire bridge (Frangopol et al. 2008). In-depth information on the design of SHM systems and specific bridge applications can be found elsewhere (Mufti 2001). Structural health monitoring can benefit owners and users of bridge structures in four different areas (Cusson et al. 2009):
(i) Ensuring public safety;
(ii) Development and adoption of new construction technologies; (iii) Development of prediction models; and
(iv) Update of loading data for the design of bridges
Figure 5. Schematic of structural health and security monitoring systems of bridges
3.4. Continuous security monitoring
A continuous video camera surveillance system can be installed to monitor the bridge and immediate surroundings in order to identify and respond to potential threats to the bridge and its components, including deck, piers, approaches, telecommunication, traffic control, lights, etc. Different types of activities can be monitored depending on type of bridge, such as car and truck traffic as well as boats, ships and aircraft activities. Computer vision and pattern recognition technology can also be used to allow computers to process recorded images, watch for danger signs, and send alarms automatically to security officers. Such technologies require high-speed communication systems to deliver the information to remote security offices for analysis, reporting and archiving purposes. It is possible though to process and archive the images locally; however, this would not allow post-catastrophe analysis (FHWA 2009).
3.5. Rehabilitation, strengthening and protection of critical bridge systems and components
The “wear and tear” deterioration caused by lifetime cyclic loading, aging and external environment (freeze-thaw cycles, de-icing salts) reduces bridge serviceability and affects the effective mobility of the users. Wear and tear deterioration also reduces the capacity and the dynamic characteristic performances of bridge components and overall system. These changes in the structure’s original properties diminish its capability to absorb and distribute shocks and could potentially result in a sudden collapse. For long span bridges, increase of wind load intensity and frequency due to climate change may lead to a significant increase of the deck forced vibration and possible deck flutter. Such changes require the development of innovative strengthening techniques to improve its dynamic performance.Rehabilitation methods for wear and tear deterioration are numerous including: patch repair, concrete overlays, partial or complete deck replacement, electrochemical chloride removal, routing and sealing of cracks, crack injection, etc.Bridge strengthening is required when the original bridge capacity has been reduced due to aging, “wear and tear” or/and extreme shocks-induced deterioration, or when the actual or expected loads exceed the design values. Existing strengthening and protection techniques focus on enhancing the strength and/or ductility of structural elements. Methods used include: (i) external steel plates attached to the external surface of bridge elements and connected to the main reinforcement; (ii) external prestressing steel or fibre reinforced polymer
(FRP) tendons; (iii) increase of reinforced concrete element cross section by attaching a precast or cast in place reinforced concrete external part; (iv) cladding/layer compositely connected to the strengthened element; and (v) use of FRP laminates to confine reinforced concrete columns.
In many situations, and depending on the magnitude of the extreme shock, it is not expected from a protection system to prevent bridge collapse, but to rather delay its failure or to transform an expected sudden type failure into a multi-staged or ductile one. The major issue in the development of a bridge or element protection system is to identify which element(s) is the most critical foreseeing that its failure could potentially lead to a complete bridge failure especiallyfor single load path or low redundancy bridge systems. For example, the pier of a single pier bridge or the interior girder of a three girder slab-on-girder bridge, or the key joint in a simply supported truss represents highly critical elements.
The effectiveness of a protection system against extreme shock loads is measured by its capability to absorb and distribute the concentrated impact over a wider region. This will help avoid severe local damage and allow the deformation of a critical zone of a structural element to extend far beyond the protected element itself. There are many new promising materials and techniques that can be used to strengthen and protect bridge structures, such as:
(i) High-strain-rate advanced composites: These materials have very wide range of strength, strain and shock-distribution properties that are suitable in the development of extreme shock protection elements. As an example, an efficient protection system for concrete columns, beams and slabs could be developed using advanced composite sandwich panels formed from two external layers of high-strain-rate FRP and a shock absorbing material as an intermediate layer.
(ii) Ultra high performance concrete (UHPC): This material has very high compressive and tensile strengths, and very high durability compared to traditional concrete. An UHPC cladding or protecting layer
externally bonded to a bridge pier or any security critical zone could significantly delay or even avoid a possible failure due to a large impact or a blast load. The steel fibres in UHPC can bridge the
microcracks normally initiated in concrete by external or internal stress fields. The steel fibre action contributes to the highly ductile behaviour and very high fatigue resistance of UHPC structures
(Almansour and Lounis 2008). These properties make UHPC a very suitable material for extreme shock protection in addition to prevent any possible premature failure.
(iii) External protection system for piers: A wall or dynamic absorption components may be built close to the bridge piers as a protection system to avoid direct exposure of critical bridge elements to extreme loads. (iv) Avoidance mechanisms: Technologies such as weigh-in-motion scale and flashing static signs or
variable message signs that warn drivers of overweight trucks to follow a detour route can also be considered.
It is important to mention that, for critical aging bridges, the installation of strengthening/protection systems applied to parts of the bridge structure have to be combined with rehabilitation when the condition of the structure is inadequate.
3. ILLUSTRATIVE EXAMPLES
Example 1: Prioritization of safety-critical bridges for maintenance and protection
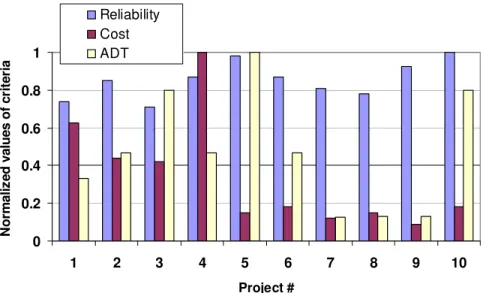
The approach presented in this paper is applied for the maintenance optimization of 10 aging and deficient structures within a network of a given transportation agency. In this example, the feasible maintenance and protection strategies are assumed to be optimized for the individual deficient bridge based on the conventional life cycle costs minimization approach. The objective here is to optimize the prioritization of the 10 maintenance projects considering simultaneously their reliability, maintenance cost, and average daily traffic subject to the constraint of a total available budget of $1.65 Million. The average daily traffic is a very relevant criterion as it indirectly provides a rating of the importance of the bridge relative to the service provided to the users and the socio-economic activity. If the bridge is posted or closed, users incur immediate economic impacts leading to higher travel costs due to longer travel time, higher fuel consumption, lost time, higher vehicle maintenance
costs, and increased environmental impacts due to increased fuel consumption and gas emissions. It can be defined as a criterion for the control of traffic disruption. The reliability of bridge structures is measured by the reliability index, which can be related to the probability of failure using the following approximation: Pf=Φ(−β), where Φ is the cumulative distribution function of the standard normal distribution. A reliability index of 2 corresponds to a nominal probability of failure of 0.02, while a reliability index of 3 corresponds to a nominal probability of failure of 0.0013 (an order of magnitude lower). It should be pointed out that increasing the reliability of an existing structure is much more problematic and expensive than specifying a higher reliability index at the design stage prior construction.
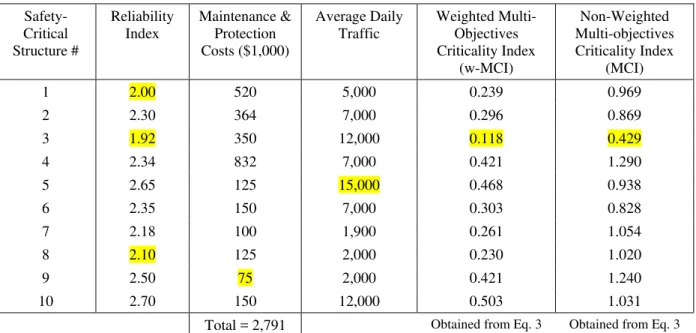
Table 1 shows the values of the reliability index, maintenance/protection cost and average daily traffic associated with each bridge project, while Figure 6 shows their normalized values (with regard to the maximum value). Figure 7 illustrates the conflicting nature of these objectives and the difficulty in prioritizing, as the project with the highest urgency in terms of safety (Project #3) is not ranked number one in terms of maintenance/protection cost (Project #9) or in terms of mobility or traffic (Project #5). The safety levels shown in Table 1 are relatively low given that these bridge structures are being continuously monitored and all assessed structures are assumed redundant (i.e. the failure of a structure will lead only to local failure and not to total collapse). In the case of less robust and less redundant structures, much higher values for the minimum reliability index will be required. Using the compromise programming and the L2 metric, the proposed multi-objective criticality index (MCI) is determined for the investigated bridge projects for two cases: Case 1: Weighted MCI, in which weights of 0.5, 0.3, and 0.2 are assigned to safety, maintenance/protection cost, and average daily traffic, respectively (i.e. a risk averse preference).
Table 1. Multi objective-based prioritization of critical bridge structures
Safety-Critical Structure # Reliability Index Maintenance & Protection Costs ($1,000) Average Daily Traffic Weighted Multi-Objectives Criticality Index (w-MCI) Non-Weighted Multi-objectives Criticality Index (MCI) 1 2.00 520 5,000 0.239 0.969 2 2.30 364 7,000 0.296 0.869 3 1.92 350 12,000 0.118 0.429 4 2.34 832 7,000 0.421 1.290 5 2.65 125 15,000 0.468 0.938 6 2.35 150 7,000 0.303 0.828 7 2.18 100 1,900 0.261 1.054 8 2.10 125 2,000 0.230 1.020 9 2.50 75 2,000 0.421 1.240 10 2.70 150 12,000 0.503 1.031
Total = 2,791 Obtained from Eq. 3 Obtained from Eq. 3
Figure 6. Normalized Values of Prioritization Criteria for Maintenance and Protection Projects 0 0.2 0.4 0.6 0.8 1 1 2 3 4 5 6 7 8 9 10 Project # N o rma li z ed val u es o f cr it er ia Reliability Cost ADT
Figure 7. Weighted and non-weighted multi-objective criticality indices
0 0.2 0.4 0.6 0.8 1 1.2 1.4 1 2 3 4 5 6 7 8 9 10 Project # Weighted MCI Non-Weighted MCI
The total maintenance and protection cost for these 10 projects is $2.791 million, which is well in excess of the available budget of $1.65 million. From Table 1, the “ideal” (but non-existing) solution is associated with the following “ideal” criterion vector f*=[f1min f2min f3max]T= [1.92, 75000, 15000]T. Using the weighted MCI (Table 1 and Fig. 8), the satisficing solution is found to be Project # 3 for both weighted and non-weighted cases. Figure 8, however, illustrates the differences in the ranking for the other projects. For example, the second highest priority is Project #8 for weighted MCI and Project # 6 for non-weighted MCI, which is due to the higher importance given to reliability in the weighted objectives. The difference in ranking between these two MCI indices varies from 0 for Project #3 to 5 ranking levels for Project # 5.
Considering now the budgetary constraint, the following projects will be scheduled for maintenance and protection:
(i) Weighted MCI-based prioritization: Projects #3, #8, #1, #7, #2, and #4 for a total cost of $1.609 million. The other projects are delayed to the following year; however, detailed analysis is required to assess if bridge posting or closure is needed.
(ii) Non-Weighted MCI-based prioritization: Projects #3, #6, #2, #5, #1, and #8 for a total cost of $1.634 million. The other projects are delayed to the following year; however, detailed analysis is required to assess if bridge posting or closure is needed.
Example 2: Health monitoring of corrosion-damaged bridge deck
This case study is provided to demonstrate that stochastic deterioration models are efficient tools to assess the future physical condition and predict the service life of critical bridges. Input data obtained from field testing, as compared to generally suggested values, significantly improve the resulting predictions because they can capture time and location variations of the main influential parameters.
In 1996, the Ministry of Transportation of Québec undertook the rehabilitation of the Vachon Bridge, which is a major highway bridge in Laval (near Montreal) Canada. Part of the rehabilitation consisted of rebuilding the severely corroded barrier walls, of which ten 35-m long spans were selected for the application and evaluation of corrosion inhibiting systems. The wall reinforcement consisted of 15-mm diameter bars as illustrated in Figure 8. The concrete had a water-cement ratio (w/c) of 0.36 (selected to obtain low permeability), a cement content of 450 kg/m3, and an average 28-day strength of 45 MPa. On-site surveys of the barrier wall were performed annually from 1997 to 2006, including measurements of corrosion potential and corrosion rate in the barrier wall, of which the concrete cover was 75 mm. For early detection of corrosion, sets of rebar ladders were embedded during construction. The ladder bars had concrete cover thicknesses of 13 mm, 25 mm, 38 mm, and 50 mm (Fig. 8), allowing additional corrosion measurements to be taken. More details can be found in Cusson and Qian (2009).
Figure 8. Cross-section of reconstructed barrier wall (Vachon Bridge, Laval, Canada)
Concrete cores were taken from the bridge barrier walls after 1, 2, 4, 5, 8 and 10 years of exposure to deicing salts in order to test several parameters, including chloride concentration. Of the 10 spans of barrier wall under study, three of them had identical concrete formulations and concrete surface conditions (referred to as Spans 12, 19 and 21 in Cusson and Qian 2009).
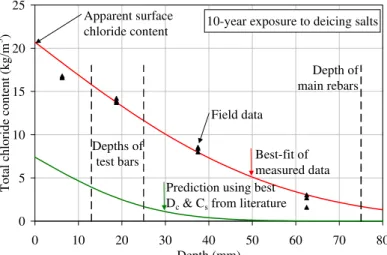
Figure 9 presents the average total chloride contents measured in concrete after 10 years of exposure to deicing salts. The best-fit curve was obtained by linear regression analysis of the measured data and Crank’s solution to Fick’s 2nd law of diffusion (Crank 1975, Tuuti 1993):
C
(
x
,
t
)
=
C
S(
1
−
erf
(
0
.
5
x
/
D
Ct
)
325 mm 550 mm 890 mm Depths of ladder bars: 13 mm 25 mm 38 mm 50 mm Depth of rebars: 75 mm)
(4)where C(x,t) is the chloride concentration at depth x after time t; Cs is the apparent surface chloride concentration; erf is the error function, and Dc is the apparent chloride diffusion coefficient. From the field data, an average apparent surface chloride content of 20.7 kg/m3 and an average apparent chloride diffusion coefficient of 0.93 cm2/year were obtained. In reality, the highest near-surface chloride content was measured to be at least 16.8 kg/m3 in the barrier wall, which is already quite higher than the maximum value of 8.9 kg/m3 suggested by Weyers (1998) for geographical regions with severe levels of exposure to deicing salts. Note that
these guidelines were developed in the US and may not apply to regions like Canada or other northern countries, where more de-icing salts are used for longer winter periods. Similarly, the apparent chloride diffusion coefficient measured for the concrete barrier wall was found to be much larger than those obtained from the literature on similar concrete structures. For example, Figure 9 shows the predicted chloride profile using Equation 4 with a mean Cs = 7.4 kg/m3 suggested by Weyers (1998) for severe exposure conditions, and Dc = 0.21 cm2/year measured by Dhir et al. (1990) on a concrete very similar to that used in this case study. It can be seen that the chloride profile is largely underestimated after only ten years of salt exposure. These discrepancies can be explained by the large fluctuations of many factors influencing chloride ingress into concrete, including concrete mixture formulation, hydration and curing characteristics, temperature and humidity conditions, and surface chloride concentrations. It can be concluded that determining the chloride profile for a given concrete structure using carefully-selected literature values, even from apparently-similar concretes, can result in inaccurate estimations, thus resulting in poor predictions of the remaining service life of the structure.
10-year exposure to deicing salts
0 5 10 15 20 25 0 10 20 30 40 50 60 70 8 Depth (mm)
Total chloride content (kg/m
3 ) Apparent surface chloride content 0 Field data Best-fit of measured data Prediction using best
Dc & Cs from literature
Depth of main rebars
Depths of test bars
Figure 9. Measured and predicted profiles of total chloride content after 10 years
Figure 10 presents the measured apparent surface chloride concentration over time, where it is shown that it increased significantly over time and reached a maximum value of 23 kg/m3 after 9 years. Figure 10 also presents the apparent chloride diffusion coefficient over time, where it is observed to decrease by a factor of 2 from Year 2 to Year 10. This could be explained in part by the continuing cement hydration and corresponding reduction in concrete porosity. Knowing that most chloride diffusion prediction models use constant values of Cs and Dc, the above observations suggest that simplified models may give inaccurate predictions if input values of Cs and Dc are not updated with field monitoring data.
0 5 10 15 20 25 0 2 4 6 8 10 12 Time (years)
App. surf. Cl content (kg/m
3 ) 0 1 2 3 4 5
App. Cl diffusion coef. (cm
2 /yr)
From field data of Spans 12, 19 & 21
Best-fit of app. Cs
Best-fit of app. Dc
Figure 10. Measured apparent surface chloride contents and chloride diffusion coefficients over 10 years
In order to predict the time of corrosion initiation (ti), Eq. 4 was rearranged by setting C(x,t) equal to a chloride threshold value (Cth), at which steel corrosion can initiate, and x equal to the effective cover depth (dc). Assuming an elastic behaviour for concrete in tension, stresses generated by corrosion products were estimated using the thick-wall cylinder model (Bažant 1979, Lounis and Daigle 2008), which calculates the increase in rebar diameter Δd for each stage of corrosion-induced damage. The corrosion propagation times (tp), corresponding to the onset of internal cracking, surface cracking, and delamination/spalling were found as follows:
[
]
s r r pj
S
d
d
t
ρ
α
ρ
π
/
/
1
2
−
Δ
=
(5)where d is the rebar diameter; S is the rebar spacing; jr is the rust production rate per unit area; ρr is the density of corrosion products (3600 kg/m3 for Fe(OH)3); ρs is the density of steel (7860 kg/m3); and α is the molecular weight ratio of metal iron to the corrosion product (0.52). The total time to reach a given corrosion-induced damage level is then found as the sum of the corrosion initiation time (ti) and the individual corrosion propagation times (tp) up to that level.
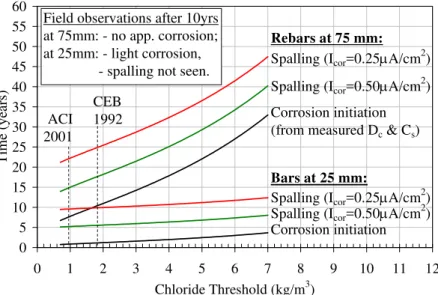
Figure 11 presents a sensitivity analysis of the times to initiate corrosion and concrete spalling, depending on several factors: (i) cover thickness; (ii) chloride threshold; and (iii) corrosion rate. At the 75 mm depth (location of main rebars), the prediction indicates a time to corrosion initiation between 6 and 10 years based on threshold values suggested by ACI and CEB. However, no significant corrosion was observed on sections of reinforcing bars cut from the barrier wall after 10 years (Cusson and Qian 2009).
0 5 10 15 20 25 30 35 40 45 50 55 60 0 1 2 3 4 5 6 7 8 9 10 11 1 Chloride Threshold (kg/m3) Time (years) Corrosion initiation
(from measured Dc & Cs)
Spalling (Icor=0.25μA/cm
2
)
Spalling (Icor=0.50μA/cm
2 ) 2 ACI 2001 CEB 1992 Rebars at 75 mm: Bars at 25 mm: Corrosion initiation
Spalling (Icor=0.25μA/cm
2
)
Spalling (Icor=0.50μA/cm
2
) Field observations after 10yrs
at 75mm: - no app. corrosion; at 25mm: - light corrosion, - spalling not seen.
Figure 11. Sensitivity analysis of time to rebar corrosion and time to concrete spalling
Combined with the observation that the concrete surfaces over the 25-mm deep bars were still free of defects after 10 years (Cusson and Qian 2007), it seems that chloride threshold values larger than 2 kg/m3 would be more appropriate in this case than the ACI and CEB values. In fact, the literature shows a strong disagreement amongst researchers on the range of values to use for the chloride threshold of conventional reinforcing steel in concrete (Alonso et al. 2000, Lounis and Daigle 2008). At a depth of 75 mm, the models predicted concrete spalling after 15 to 17 years of exposure, based on the commonly used corrosion rate of 0.50 μm/cm2
and on the ACI and CEB chloride threshold values. Again, this event appears to be quite unlikely in this case. In fact, the average corrosion rates measured in the bridge barrier walls (near cracks) were 0.25 μm/cm2
for the 75-mm deep reinforcement (and 0.30 μm/cm2
for the 25-mm deep test bars). With this field data, and assuming a chloride threshold larger than 2 kg/m3, the models predict the onset of spalling after at least 25 years for the 75-mm deep bars, which appears to be a more appropriate prediction.
Example 3: Health monitoring of concrete repair systems
This case study is presented to illustrate the use and benefits of structural health monitoring as a tool to evaluate the quality and durability of alternative repair methods.
To help address the need for a broadened knowledge base and new repair technologies, NRC and the Ministry of Transportation of Ontario (MTO) partnered in 1999 on a three-year project to field-test five proprietary commercial concrete repair systems (Cusson et al. 2006). The goal was to study the effectiveness of commercial concrete repair systems in preventing corrosion of steel reinforcement and shrinkage cracking of aging bridge decks. Testing took place on a highway bridge, near Renfrew (Ontario), as shown in Fig. 12. Five proprietary commercial repair systems (including special concretes and corrosion inhibiting admixtures) and one control system of normal concrete were used to create a series of test patches on different sections of corrosion-damaged reinforced concrete barrier walls exposed to freeze-thaw cycles, wet-dry cycles and de-icing salt contamination. The 28-day compressive strength of these repair concretes ranged from 25 MPa to 50 MPa.
During the patching process, sensors were installed in the test sections and surrounding concrete (Fig. 13). Relative humidity (RH) sensors were used to assess the moisture gradient across the repaired section, which provided information on the moisture transfer between the patch and substrate, the risk of differential shrinkage, and the risk of freeze-thaw damage at the interface. The MnO2 reference electrodes (RE) were used to detect a variation of the half-cell potential along the reinforcing bar going through both the repair and adjacent substrate, which provided information on macro-cell corrosion in the substrate. Strain gauges (SG or SD) were used to detect possible patch delamination if the strain patterns did not match. Electrical resistance probes (RP) were used to obtain additional data to support and complement the data obtained from the RH and RE sensors. The data acquisition system consisted of four data loggers equipped with a cellular modem for remote communication and powered by three car batteries, which were recharged by solar panels (Fig. 12).
Fig. 12. CNR Bridge near Renfrew, Canada Fig. 13. Location of sensors in typical test section
RE3 RE4 RP2 RH2 SG 8 0 5 m m [ 3 2 in .] RH1 200 mm [8 in.] Instrumented rebar SD Repair area
Traffic side of barrier wall RE2 RP1 RE1 Old concrete 450 mm [18 in.] 250 [10 mm in.] RE3 RE4 RP2 RH2 SG 8 0 5 m m [ 3 2 in .] RH1 200 mm [8 in.] Instrumented rebar SD Repair area
Traffic side of barrier wall RE2 RP1 RE1 Old concrete 450 mm [18 in.] 250 [10 mm in.]
The findings indicate that the commercial proprietary repair systems performed slightly better in delaying corrosion when compared to control repairs made of normal concrete. Fig. 14 shows the monthly average of the corrosion potential of the reinforcing steel measured in the patch on electrode RE4 (located 400 mm away from the old concrete). It is shown that the corrosion potential in the control section shifted towards more negative values, from –320 mV to –470 mV three years later, indicating an increased risk of reinforcement corrosion. In all other test sections, the corrosion potential in the patches remained practically unchanged with values between –200 mV and –350 mV, a range indicating that corrosion is uncertain according to ASTM C876. Fig. 15 presents the monthly average of the corrosion potential of the reinforcing steel measured in the old concrete on electrode RE1 (located 400 mm away from the patch). The curves show that the corrosion potential of the old concrete in all test sections shifted towards more negative values by more than 100 mV within the three-year period. This is an indication that the risk of corrosion in the substrate has increased after the repair. Shrinkage cracking, however, was observed and detected by the strain gauges in all patches tested in this study, including the control
patching system. It is believed that the delay in corrosion is significant enough to make the use of commercial proprietary concrete repair systems worthwhile, as long as the systems provide low water permeability, high electrical resistivity and low shrinkage.
Fig. 14. Corrosion potential in patches Fig. 15. Corrosion potential in old concrete
-500 -450 -400 -350 -300 -250 -200 -150 -100
Nov-99 May-00 Nov-00 May-01 Nov-01 May-02 Nov-02 Time P o te nt ia l ( m V v s C S E) Ctrl Ctrl 12 5 5 12 6 6 2 2 3 3 10 10
Calibrated with external CSE
-500 -450 -400 -350 -300 -250 -200 -150 -100
Nov-99 May-00 Nov-00 May-01 Nov-01 May-02 Nov-02 Time P o te n tia l (m V v s C S E ) Ctrl 12 5 6 2 3 10 6 12 2 3 10 5 Ctrl
Calibrated with external CSE
4. DISCUSSION
Case study No. 2 showed that some of the input data that are commonly used in service life prediction models (e.g. surface chloride content, chloride diffusion coefficient, chloride threshold, and corrosion rate) could be very different from actual field values, because these parameters vary widely in time and location and are highly uncertain. Although the case study is on bridge barrier walls, the lessons learned also apply to other parts of a bridge as long as they show a bare concrete surface exposed to similar levels of chlorides, like a bare concrete deck.
In order to deal with the high variability and uncertainty of input data, two approaches could be used in combination. As mentioned before, structure health monitoring is one approach that can continuously provide valuable information on several key parameters simultaneously. For example, corrosion rates are usually ‘manually’ measured during the summer time for convenience, resulting in higher than yearly-average rates. This could result in overly conservative predictions of service life. On the other hand, remote monitoring of the corrosion rate with embedded instrumentation on a daily basis could provide a meaningful value of the yearly average, which can still be expected to increase as reinforcement corrosion and concrete deterioration develop over the years. The second approach is the use of probabilistic models accounting for this variability using average values and coefficients of variation of key parameters as well as their stochastic correlation in time and space (Lounis and Daigle 2008). Such models are more robust than deterministic models, and can be calibrated with SHM data.
5. CONCLUSIONS
This paper showed that the maintenance and protection management of aging critical bridges could be formulated as a multi-objective optimization problem. The obtained solutions achieved a satisfactory trade-off between several competing criteria, including the maximization of safety and security, and minimization of maintenance costs and minimization of traffic disruption. The use of proposed multi-objective criticality index can yield the optimal ranking of the critical bridge structures in terms of their priority for maintenance and protection. Different risk mitigation strategies can be implemented to improve the performance of critical bridges. Moreover, service life predictions of existing bridges could be significantly improved by updating the models with data from structural health monitoring.
REFERENCES
Almansour, H and Lounis, Z. Structural Performance of Precast Prestressed Bridge Girders Built with Ultra High Performance Concrete, 2nd International Symposium on Ultra High Performance Concrete, Kassel, Germany, March 5-7, 2008, p. 823-830.
Alonso, C., Andrade, C., Castellote, M., Castro, P. Chloride threshold values to depassivate reinforcing bars embedded in a standardized OPC mortar, Cement and Concrete Research, 30(7), July 2000, p. 1047-1055. Bažant, Z.P., Physical model for steel corrosion in concrete sea structures – theory. Journal of the Structural
Division, 105(ST6), 1979, p. 1137-1153.
Cusson, D., Almansour, H., Lounis, L. and Daigle, L. Monitoring for durability and structural behavior of medium and long-span concrete bridges, 4th Intl. Conference on Structural Health Monitoring on Intelligent Infrastructure (SHMII-4) 2009, 22-24 July 2009, Zurich, Switzerland.
Cusson, D., Qian, S.: Ten-year evaluation of corrosion-inhibiting systems in concrete bridge barrier walls, ACI
Materials Journal, Vol.106, No.3, May-June 2009.
Cusson, D., Qian, S., Hoogeveen, T.: Field Performance of Concrete Repair Systems on Highway Bridge, ACI
Materials Journal, Vol. 103, No. 5, 2006, pp. 366-373.
Crank, J., The mathematics of diffusion, Second edition, Oxford University Press, London, 1975, 414 p.
Dhir, R.K., Jones, M.R., Ahmed, H.E.H., Seneviratne, A.M.G., Rapid estimation of chloride diffusion coefficient in concrete, Magazine of Concrete Research, Vol. 42, 1990, p. 177-185.
Duckstein, L. Multiobjective optimization in structural design: The model choice problem. New directions in optimum structural design, Atrek et al., eds., J. Wiley and Sons, N.Y. 1984, 459-481.
FHWA (1979 and 1996). Recording and Coding Guide for the Structure Inventory and Appraisal of the
Nation’s Bridges. Report no. FHWA-PD-96-001. Federal Highway Administration. U.S. Department of transportation.
FHWA, iFlorida Model Deployment Final Evaluation Report, Report No. FHWA-HOP-08-050, January 2009, 274 p.
Frangopol, D.M., Strauss, A., Kim, S., Bridge reliability assessment based on monitoring, Journal of Bridge
Engineering, ASCE, May-June 2008, p. 258-270
Golabi, K., Thompson, P.D., and Hyman, W.A. Pontis- version 2.0: Technical manual: a network optimization
system for bridge improvement and maintenance. Report FHWA-SA-93-031,1993, Federal Highway Administration, Washington, D.C.
Hawk, H. Bridgit: user friendly approach to bridge management. Proc. 8th Intnl. Bridge Management Conference, 1999, TRB-FHWA, Paper F-7.
Keeney, R.L., and Raiffa, H. Decisions with Multiple Objectives: Preferences and Value Tradeoffs. J. Wiley & Sons, New York, 1976.
Koski, J. Multi-objective optimization in structural design. In new Directions in Optimum Structural Design, Atrek et al., eds., Wiley, New York, 1984, pp. 484-503.
Lounis, Z, and Cohn, M.Z. Multi-objective optimization of prestressed concrete structures. J. Struct. Engrg., ASCE, 1993, 119(3): 794-795.
Lounis, Z., and Cohn, M.Z. An engineering approach to multi-criteria optimization of highway bridges. J. of
Computer-Aided Civil & Infrast. Engrg., 1995, 10(4): 253-238
Lounis, Z., Daigle, L., Reliability-based decision support tool for life cycle design and management of highway bridge decks, Annual Conf. of the Transportation Association of Canada, Toronto, Sept. 2008, 19 p.
Lounis, Z. and Amleh, L. Reliability-based chloride ingress and reinforcement corrosion of aging bridge decks. In Life Cycle Performance of Deteriorating Structures, Frangopol, D. (eds.), 2003, pp. 113-122.
Melchers, R. E. Structural Reliability- Analysis and Prediction. Ellis Horwood Ltd, 1987, Chichester, England. Mori, Y., and Ellingwood, B. Reliability-based service life assessment of aging concrete structures. ASCE J. of
Struct. Engrg., 1993, 119(5): 1600-1621.
Ministry of Transportation, Ontario. Ontario Structure Inspection Manual (OSIM). Engineering Standards Branch, Bridge Office, MTO, 2000.
Mufti, A., Guidelines for structural health monitoring, ISIS Manual No. 2, 2001, http://www.isiscanada.com/manuals/No2_contents.pdf.
20 Paté-Cornell, M.E. Quantitative safety goals for risk management of industrial facilities. J. Structural Safety,
Vol. 13, 1994, pp.145-157.
Starr, C. Social benefit vs. technical risk. Science, American Association for the Advancement of Science, Vol. 165, 1969, pp. 1232-1238.
Thompson, P.D., and Shepard, R.W. Pontis. Transportation Research Circular 324, Transportation Research Board, Washington, D.C., 1994, pp.35-42.
Tuutti, K., The effect of individual parameters on chloride induced corrosion, in Chloride Penetration into Concrete Structures, L.-O. Nilsson (ed.), Göteborg, Sweden, 1993, p. 18-25.
Von Neumann, J. and Morgenstern, O. Theory of Games and Economic Behavior. Princeton University Press, 1947, Princeton.
Weyers, R.E., Service life model for concrete structure in chloride laden environments, ACI materials Journal, 95(4), July-August 1998, p. 445-453.
Zadeh, L.A. Optimality and non-scalar valued performance criteria. IEEE Trans. Aut. Cont, Vol. 8, No.1, 1963, pp.59-60.